The Romance of Documentation and Blogging: A Story of Analytics


At Volkov Labs, when we launched multiple online channels to share our Grafana expertise, we never imagined our documentation and blog would attract such a massive audience. Two months after revamping our approach in December, we welcomed visitors from over 100 countries—a testament to the power of well-crafted content.
I’ve always found traditional documentation uninspiring. And I’m not alone. Problem-solvers don’t want to Learn Grafana in a generic sense; they need specific answers to specific questions. This realization drove us to rethink documentation, transforming it into a dynamic, user-focused resource. The result? A structured knowledge base paired with powerful web analytics that keeps us ahead of the curve.
Our efforts in reorganizing READMEs, doc files, issues, examples, and blog posts have paid off. Today, we’re not just creating content—we’re building a living ecosystem of educational materials while tracking performance to guide our next steps.
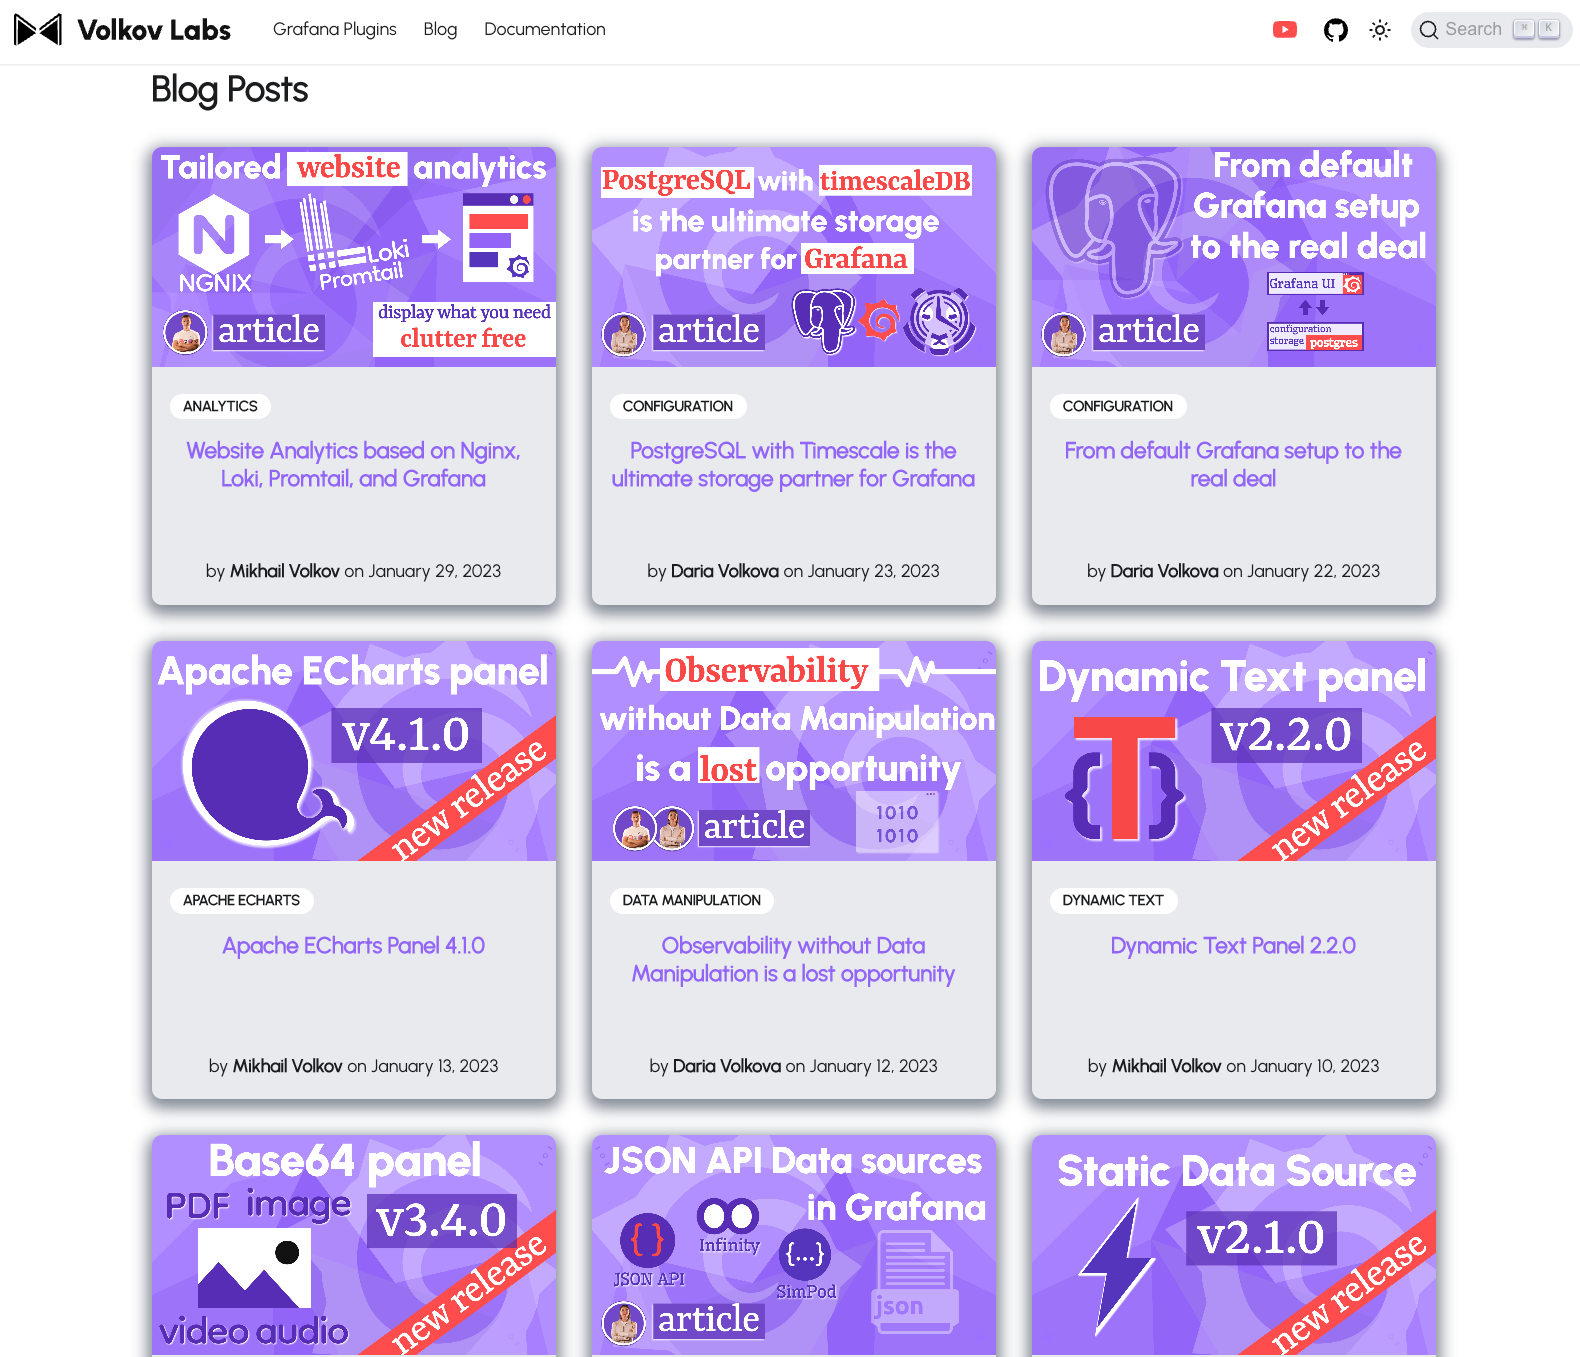
Blog: From Medium to Mastery
A year ago, we started a technical blog to share personal experiences and development insights, hoping to connect with a wider audience. Without our own platform at the time, we turned to Medium—a fantastic space for tech blogging. It served us well initially, but as we dove into Google Analytics and Search tools, we noticed a problem: Medium was competing with our then-nascent documentation rather than complementing it.
Additionally, Medium’s stylistic constraints limited our ability to create a consistent, recognizable visual identity. So, we made a strategic shift to host all content on our own platform, giving us full control over style, analytics, and user experience.
While we still value Medium as readers to stay updated on tech trends, business logic dictated a unified home for our content. This move has allowed us to craft a seamless experience for our audience.
Documentation: The Backbone of Knowledge
Documentation and blogging are two sides of the same coin, each enhancing the other. Our documentation provides quick “WHAT” and “HOW-TO” answers, while blog posts dive deeper—covering step-by-step tutorials, innovative use cases, release notes, and major announcements.
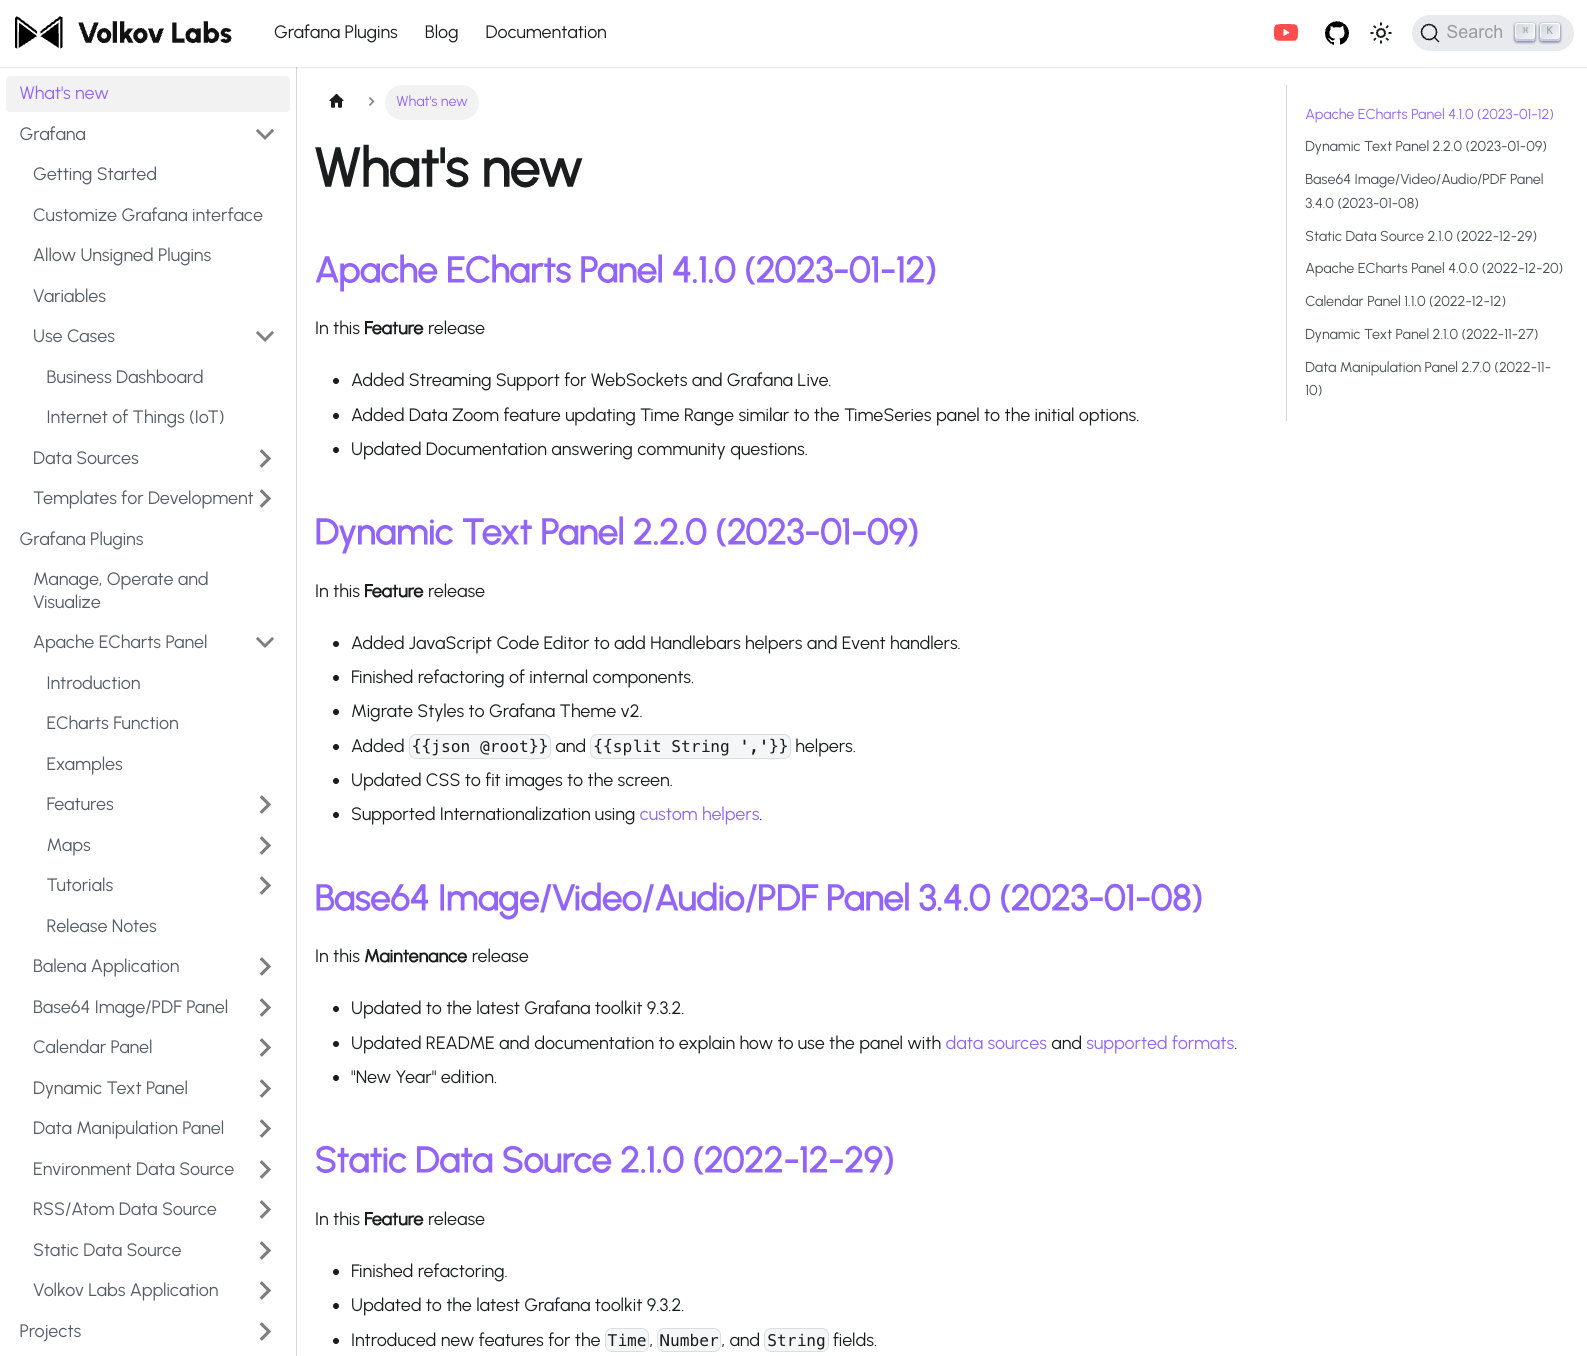
Both are dynamic resources, evolving daily based on community feedback and requests. This iterative process ensures we’re always addressing real user needs.
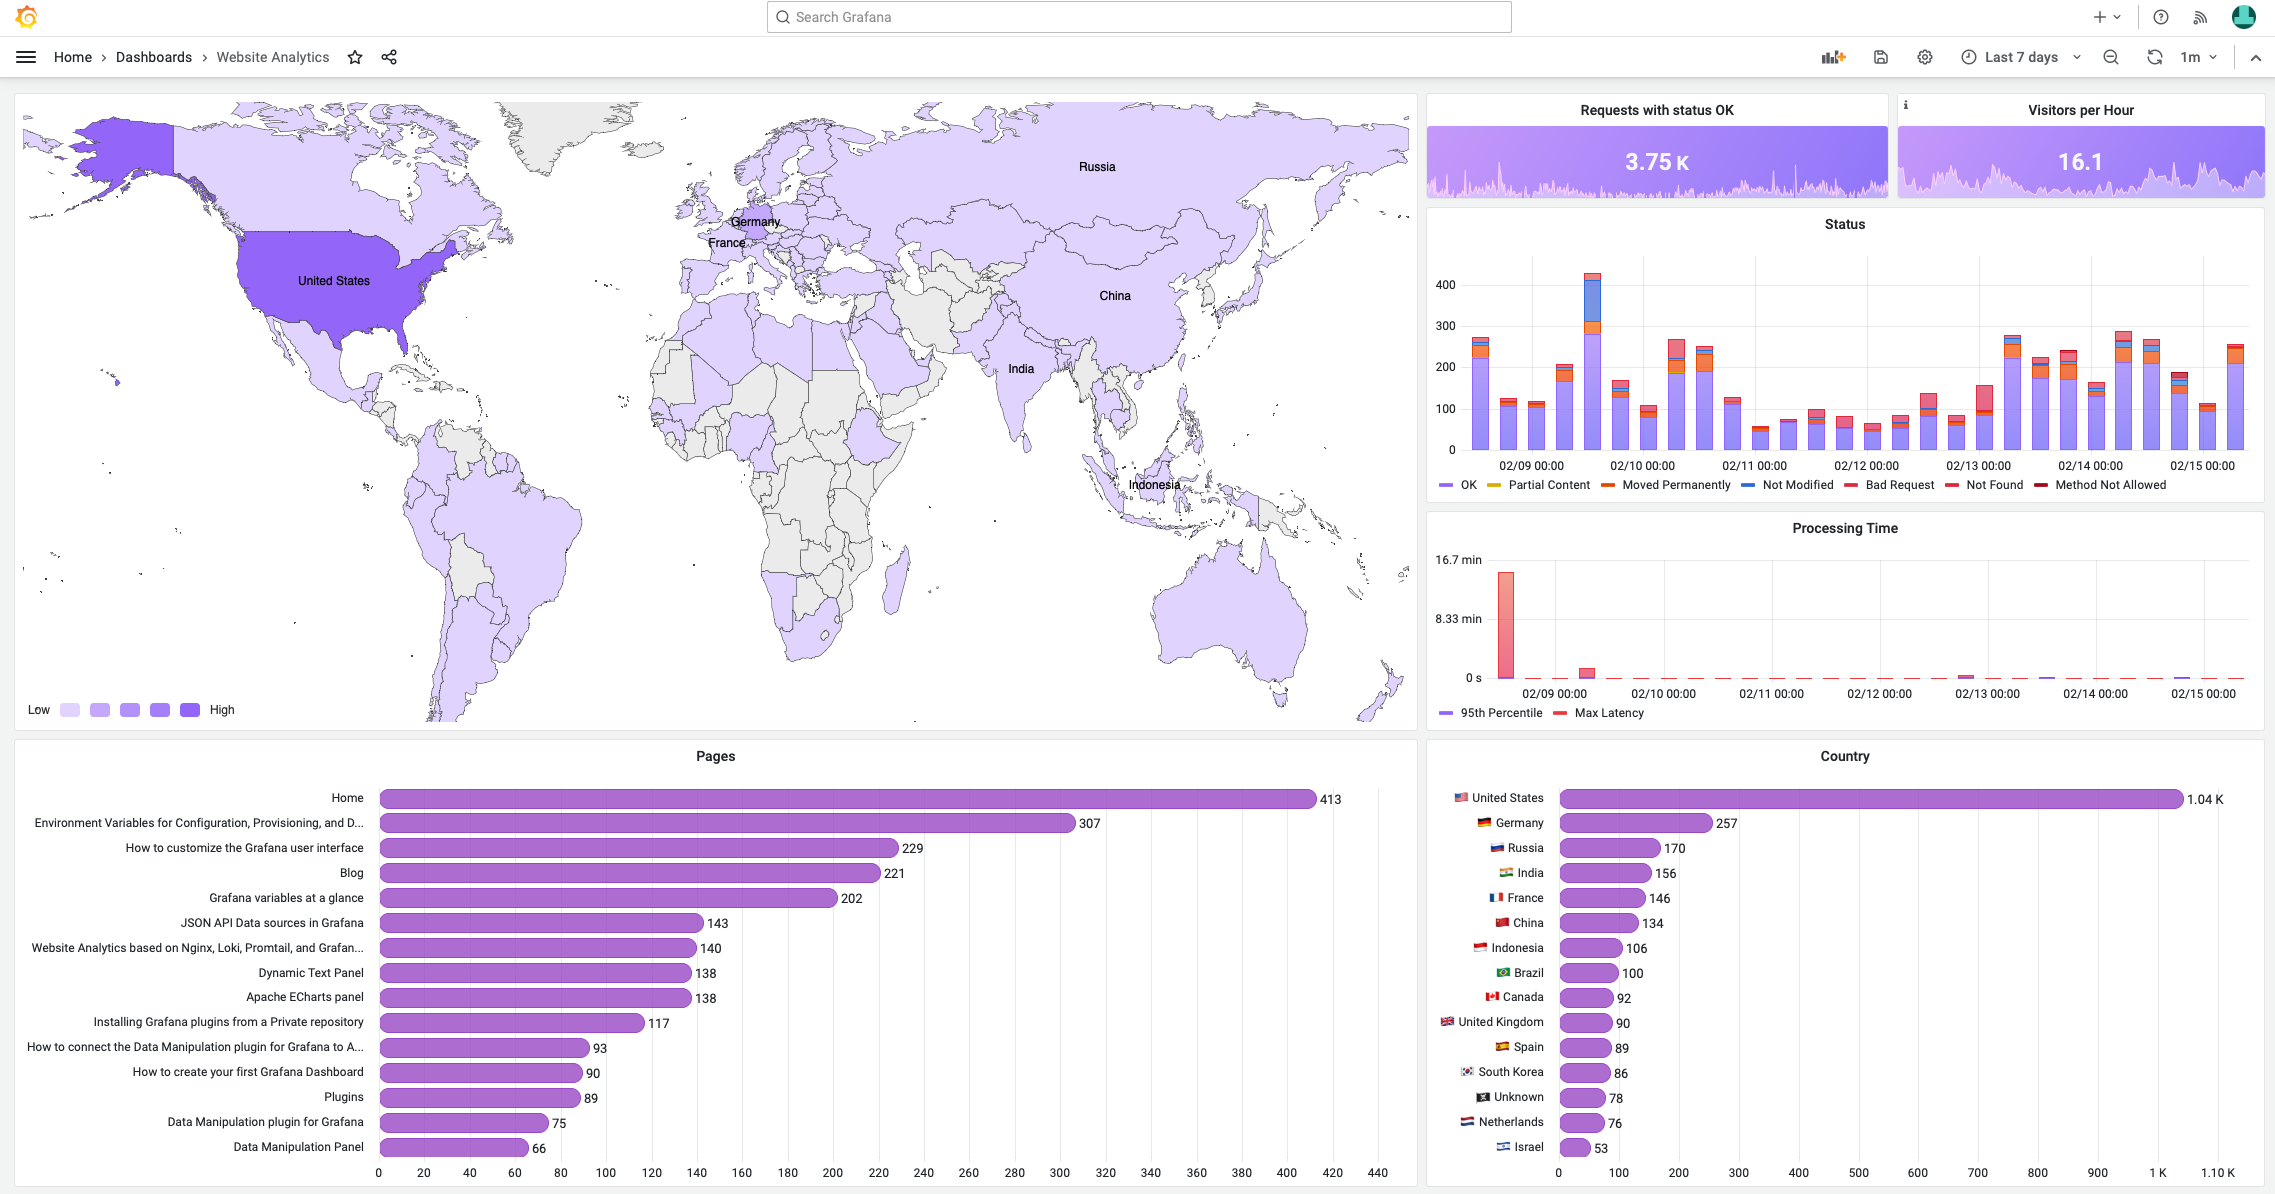
Analytics Dashboard: Our Pulse Check
Our analytics dashboard is a constant presence on our main office display. A quick glance reveals critical insights:
- How many users are engaging with our content right now.
- Which countries they’re from.
- Whether there are delays in our responses (are we still online and responsive?).
- If there are any security threats or break-in attempts.
- What topics are trending among our audience.
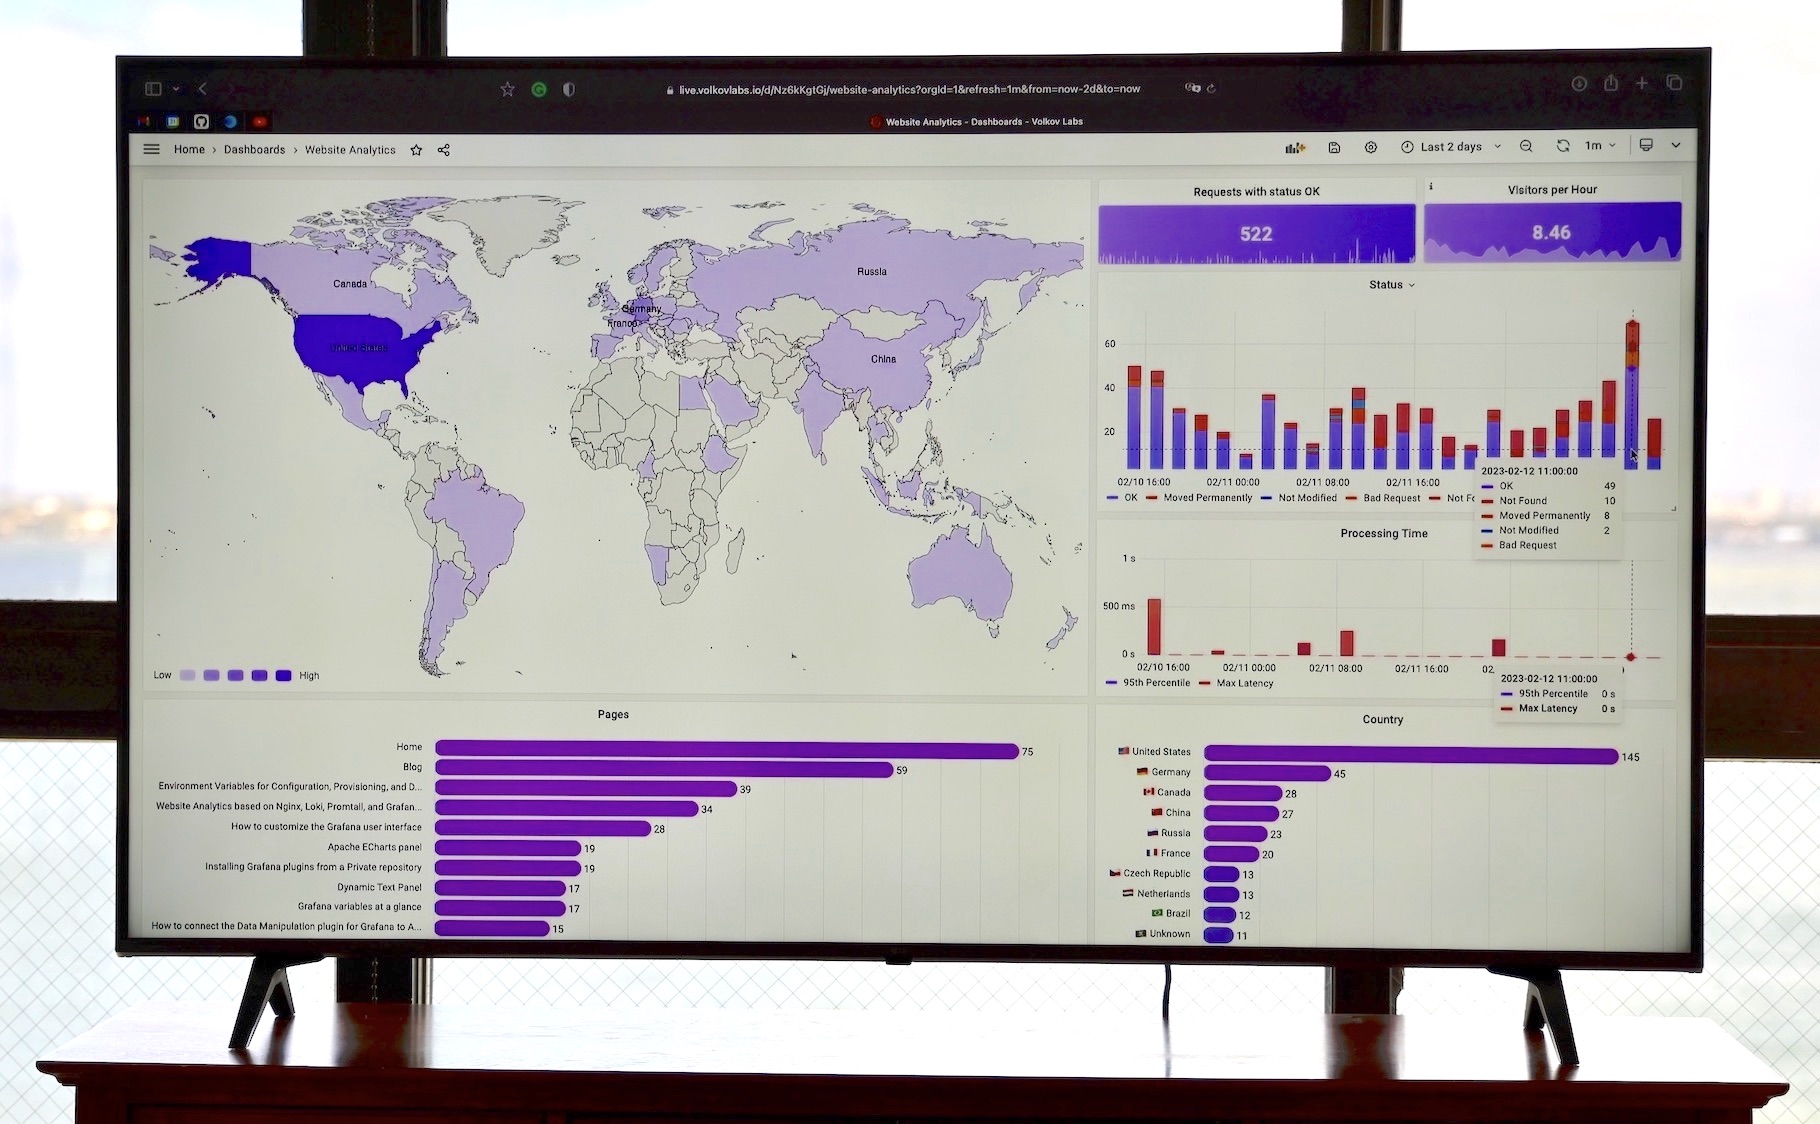
This dashboard is our web heart rate monitor, guiding us through a sea of questions and helping prioritize future content.
Search: Making Discovery Painless
Search shouldn’t be a struggle—and yes, even we got lost in our own content at times. That’s why we implemented Algolia Search for our blog and documentation. The results have been transformative.
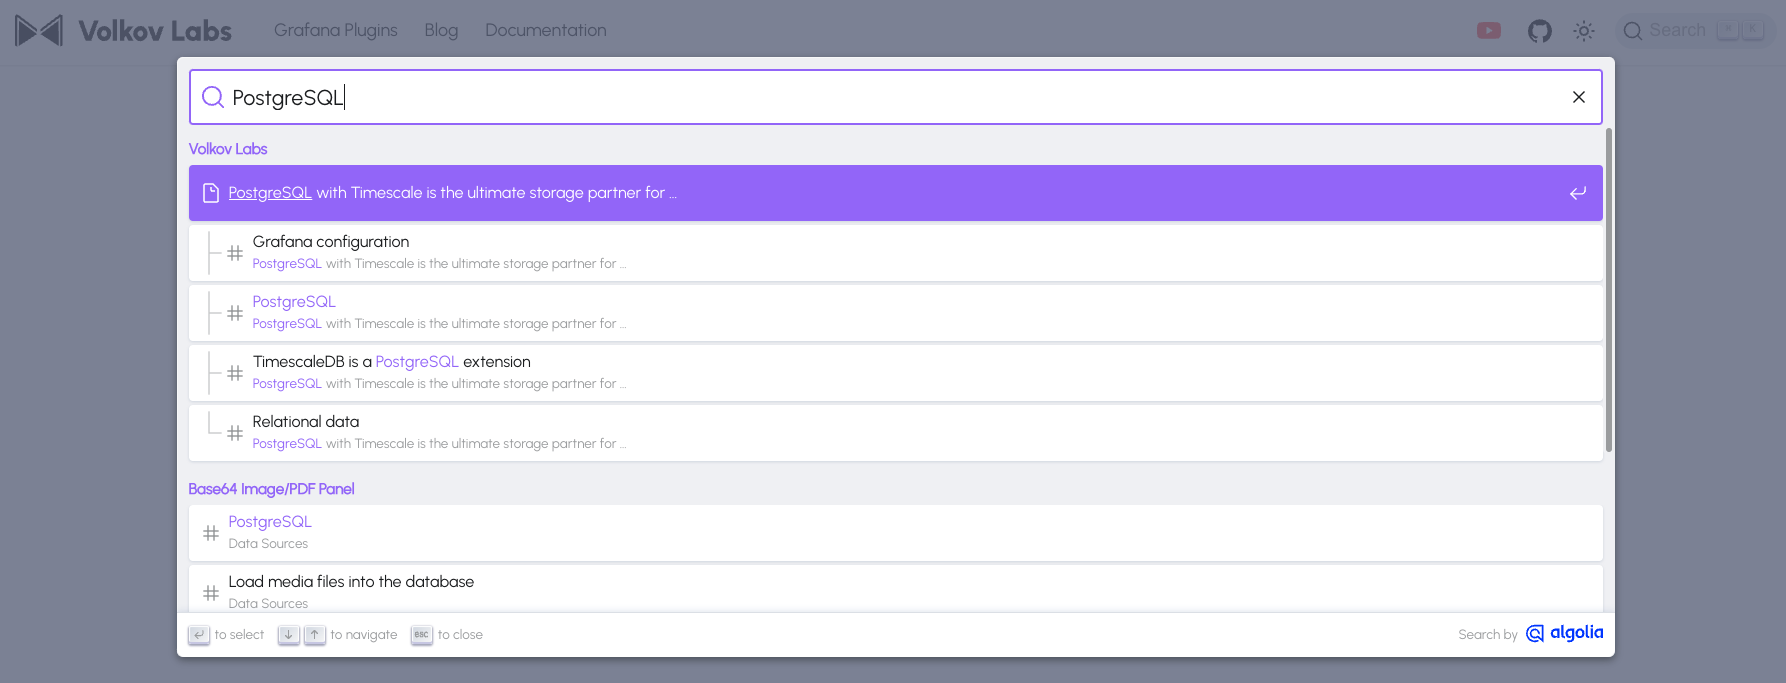
During setup, Algolia’s Crawler helped us identify and fix internal issues, and its intuitive UI made configuration a breeze. More importantly, Algolia provides actionable data on what visitors are searching for—and struggling to find—enabling us to close content gaps.
Tutorial: Build Your Own Analytics Dashboard
Curious about setting up a similar system? We’ve detailed the process of configuring Nginx, Loki, Promtail, and Grafana in our article, Website Analytics with Nginx, Loki, Promtail, and Grafana. It’s packed with our latest insights.
For a visual walkthrough, check out the video below. Note that the dashboard shown differs slightly from our production version, but the principles remain the same.
Summary: A Symbiotic Relationship
Documentation is the skeleton; blog posts are the flesh. Documentation outlines the essentials, while blog posts add color and context. One provides direction, the other explains the “why.” We believe both are equally vital, which is why we refine them daily.
Our analytics dashboard acts as a compass, helping us navigate user needs and requests with precision. Together, these elements form a powerful ecosystem that drives engagement and innovation at Volkov Labs.