Grafana variables at a glance, Environment data source explained

After a brief acquaintance with Grafana in sandboxes, production application developers come to the need to work with variables serving different architectural levels. This article outlines three logical levels with corresponding variables and their purposes.
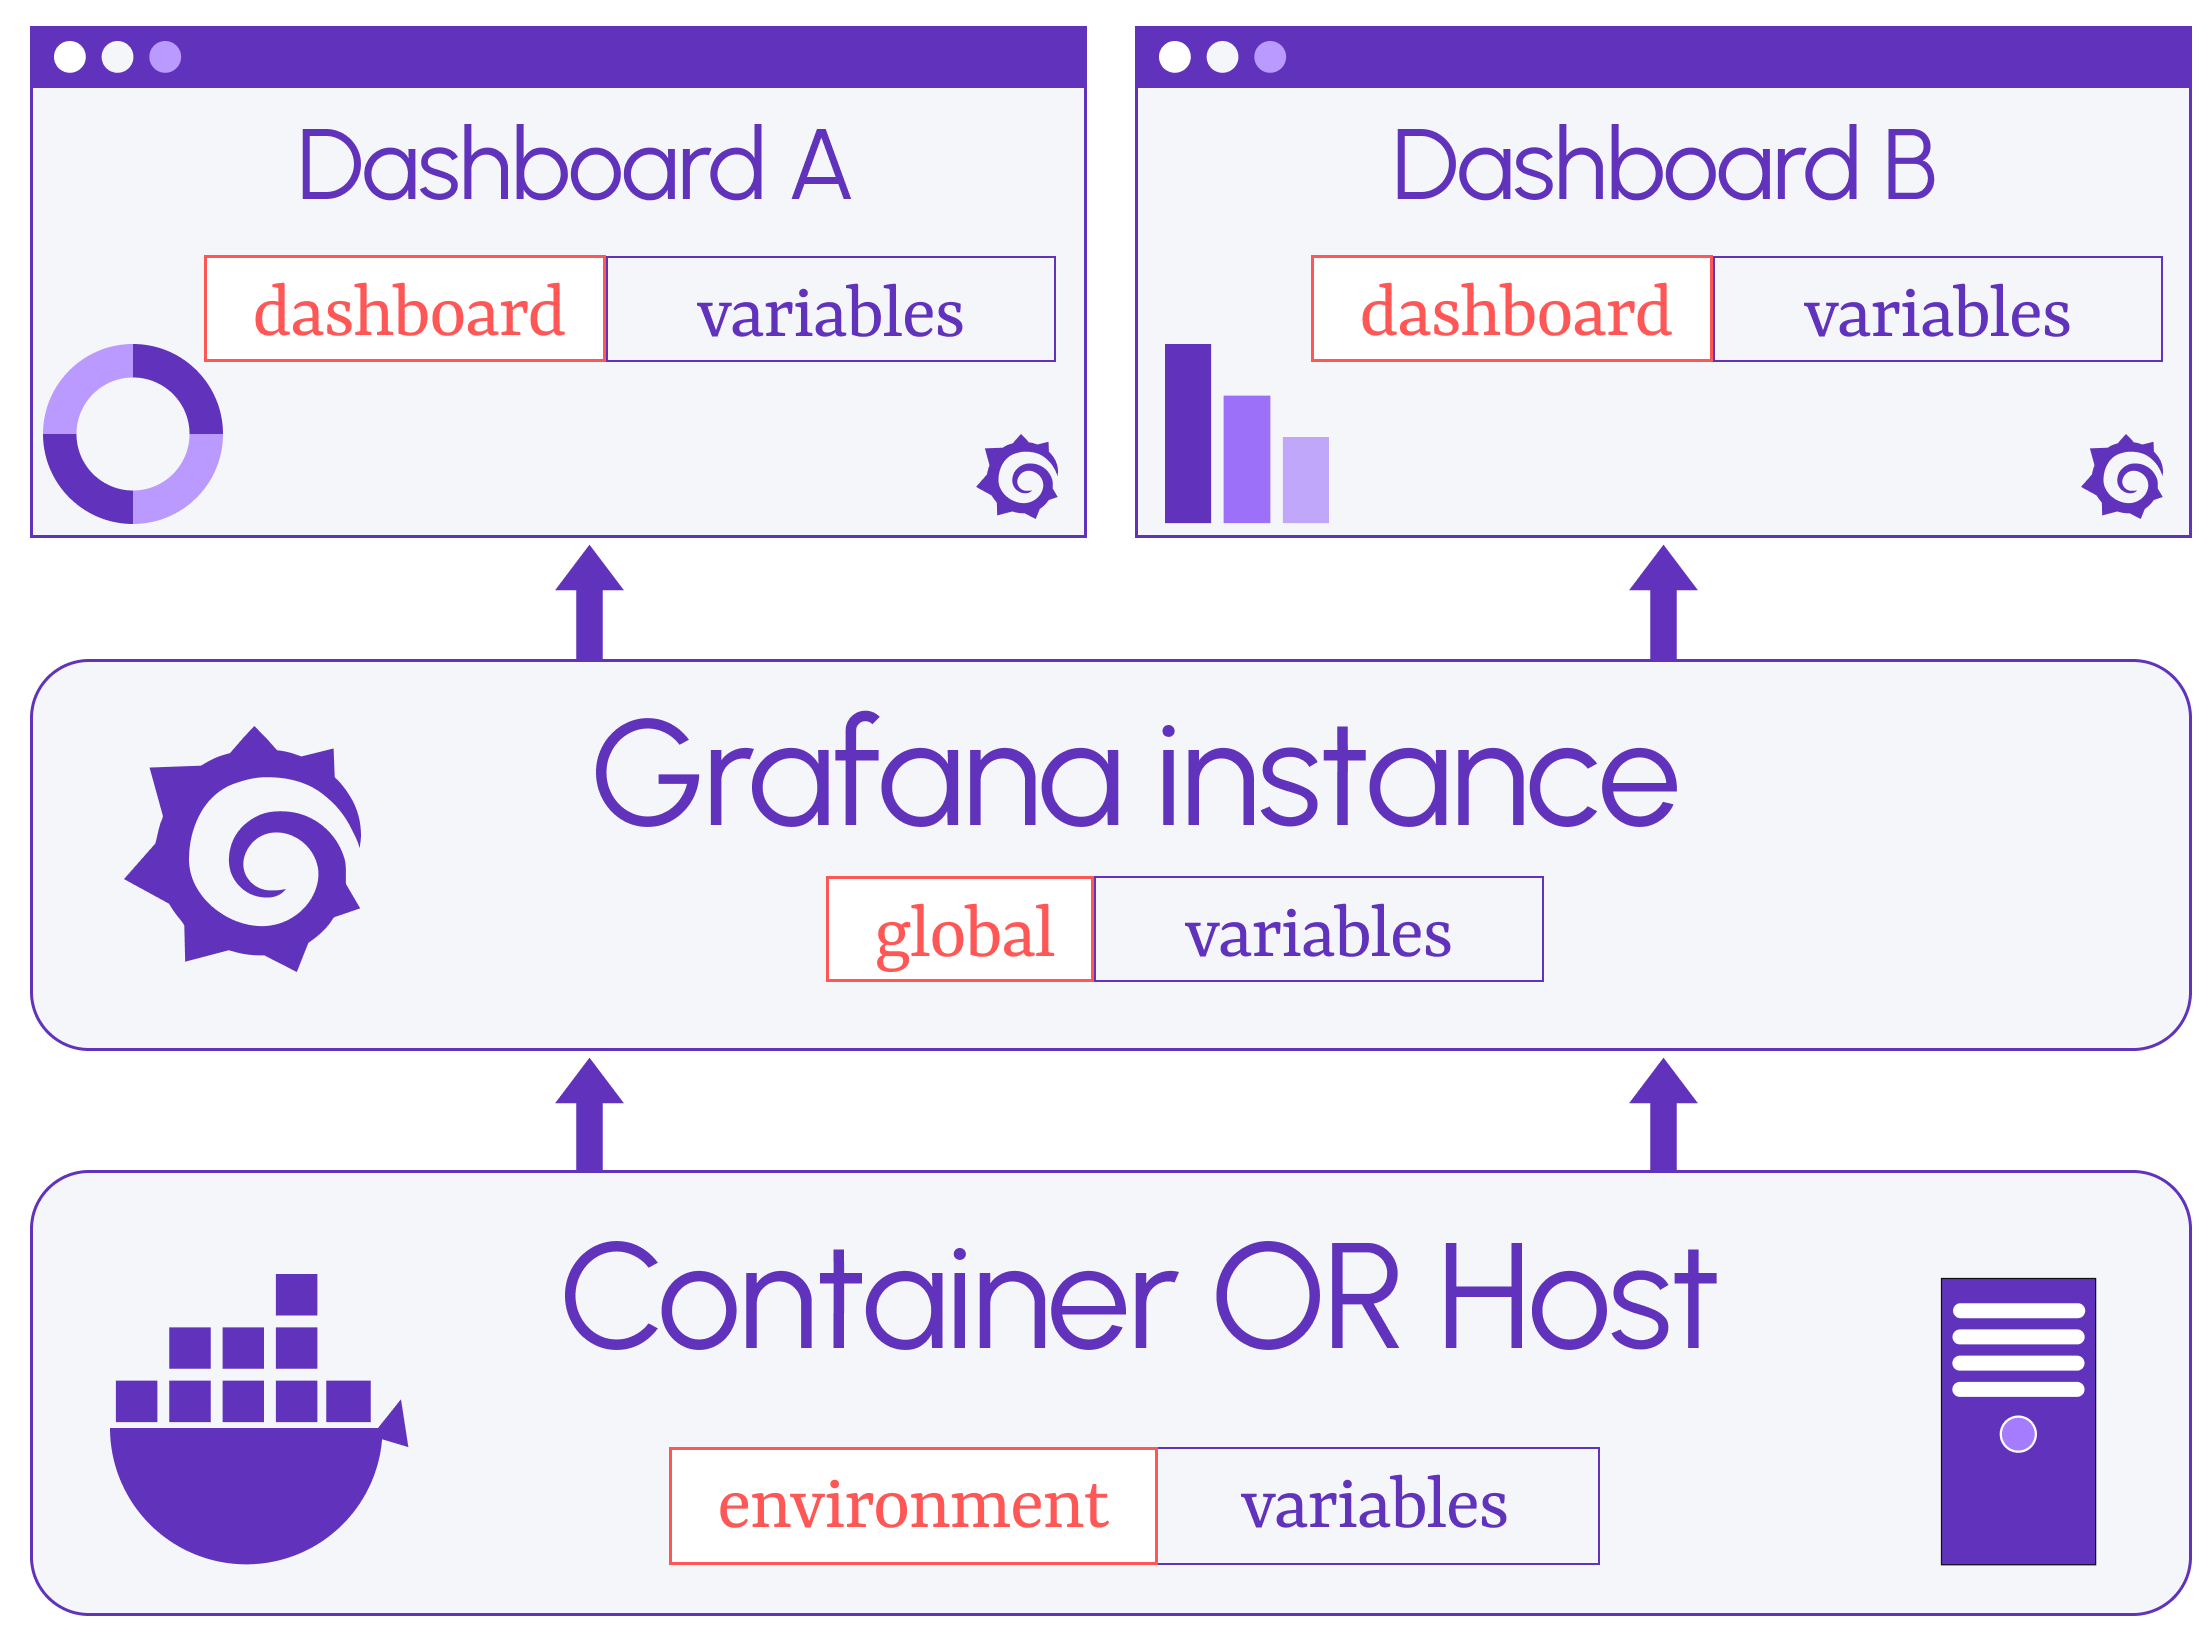
Let's start with the schema below. It provides a fantastic summary of the subject.
Dashboard variables serve the analytical dashboards, and global Grafana variables rule in the Grafana instance. Environment variables help in configuring system processes where Grafana is installed.
The YouTube version of this article is on our YouTube channel.
Dashboard variables
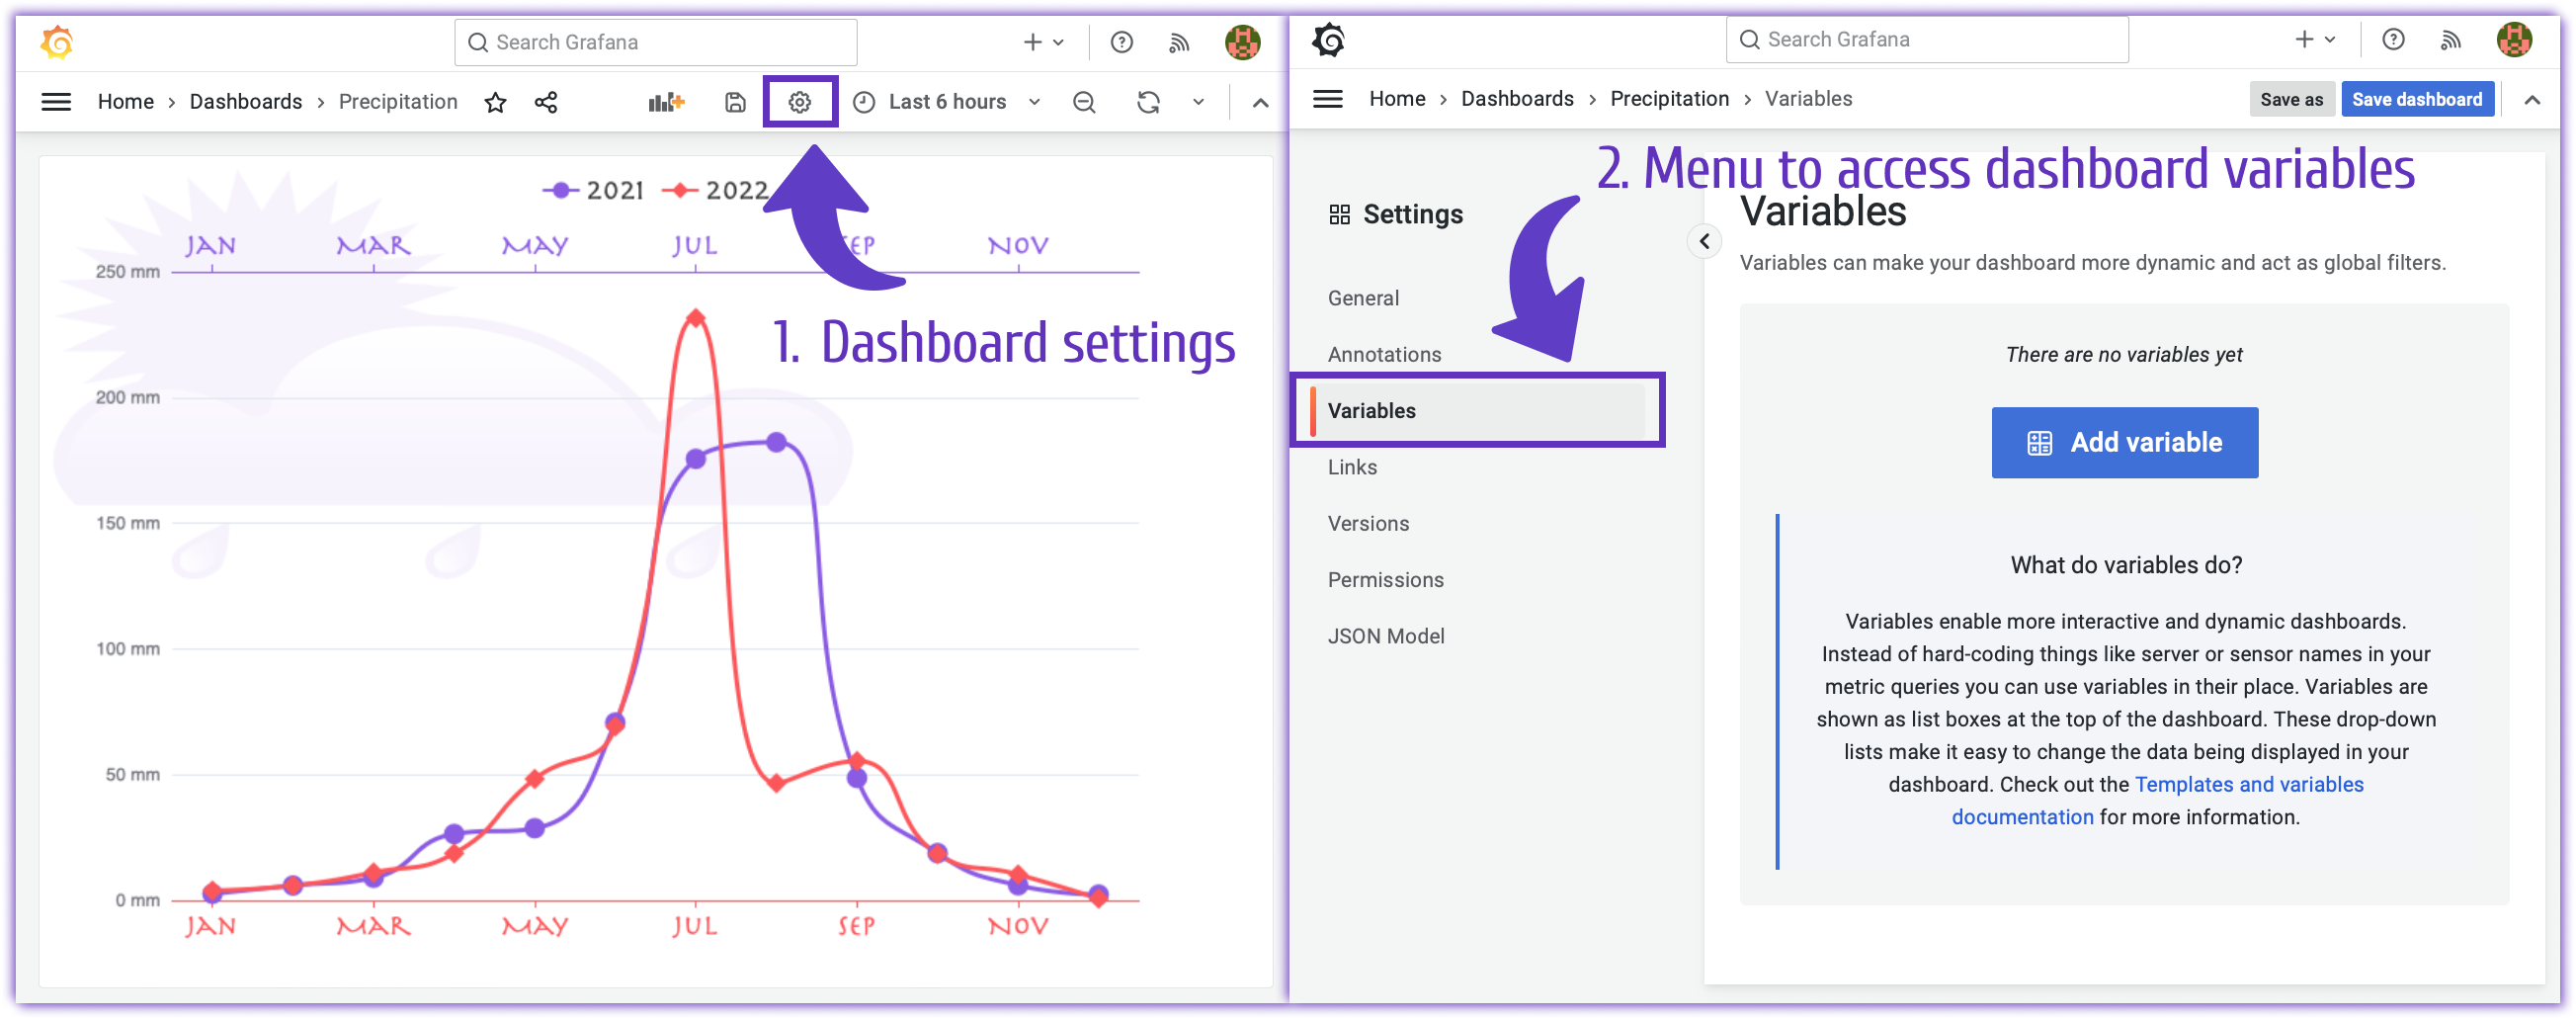
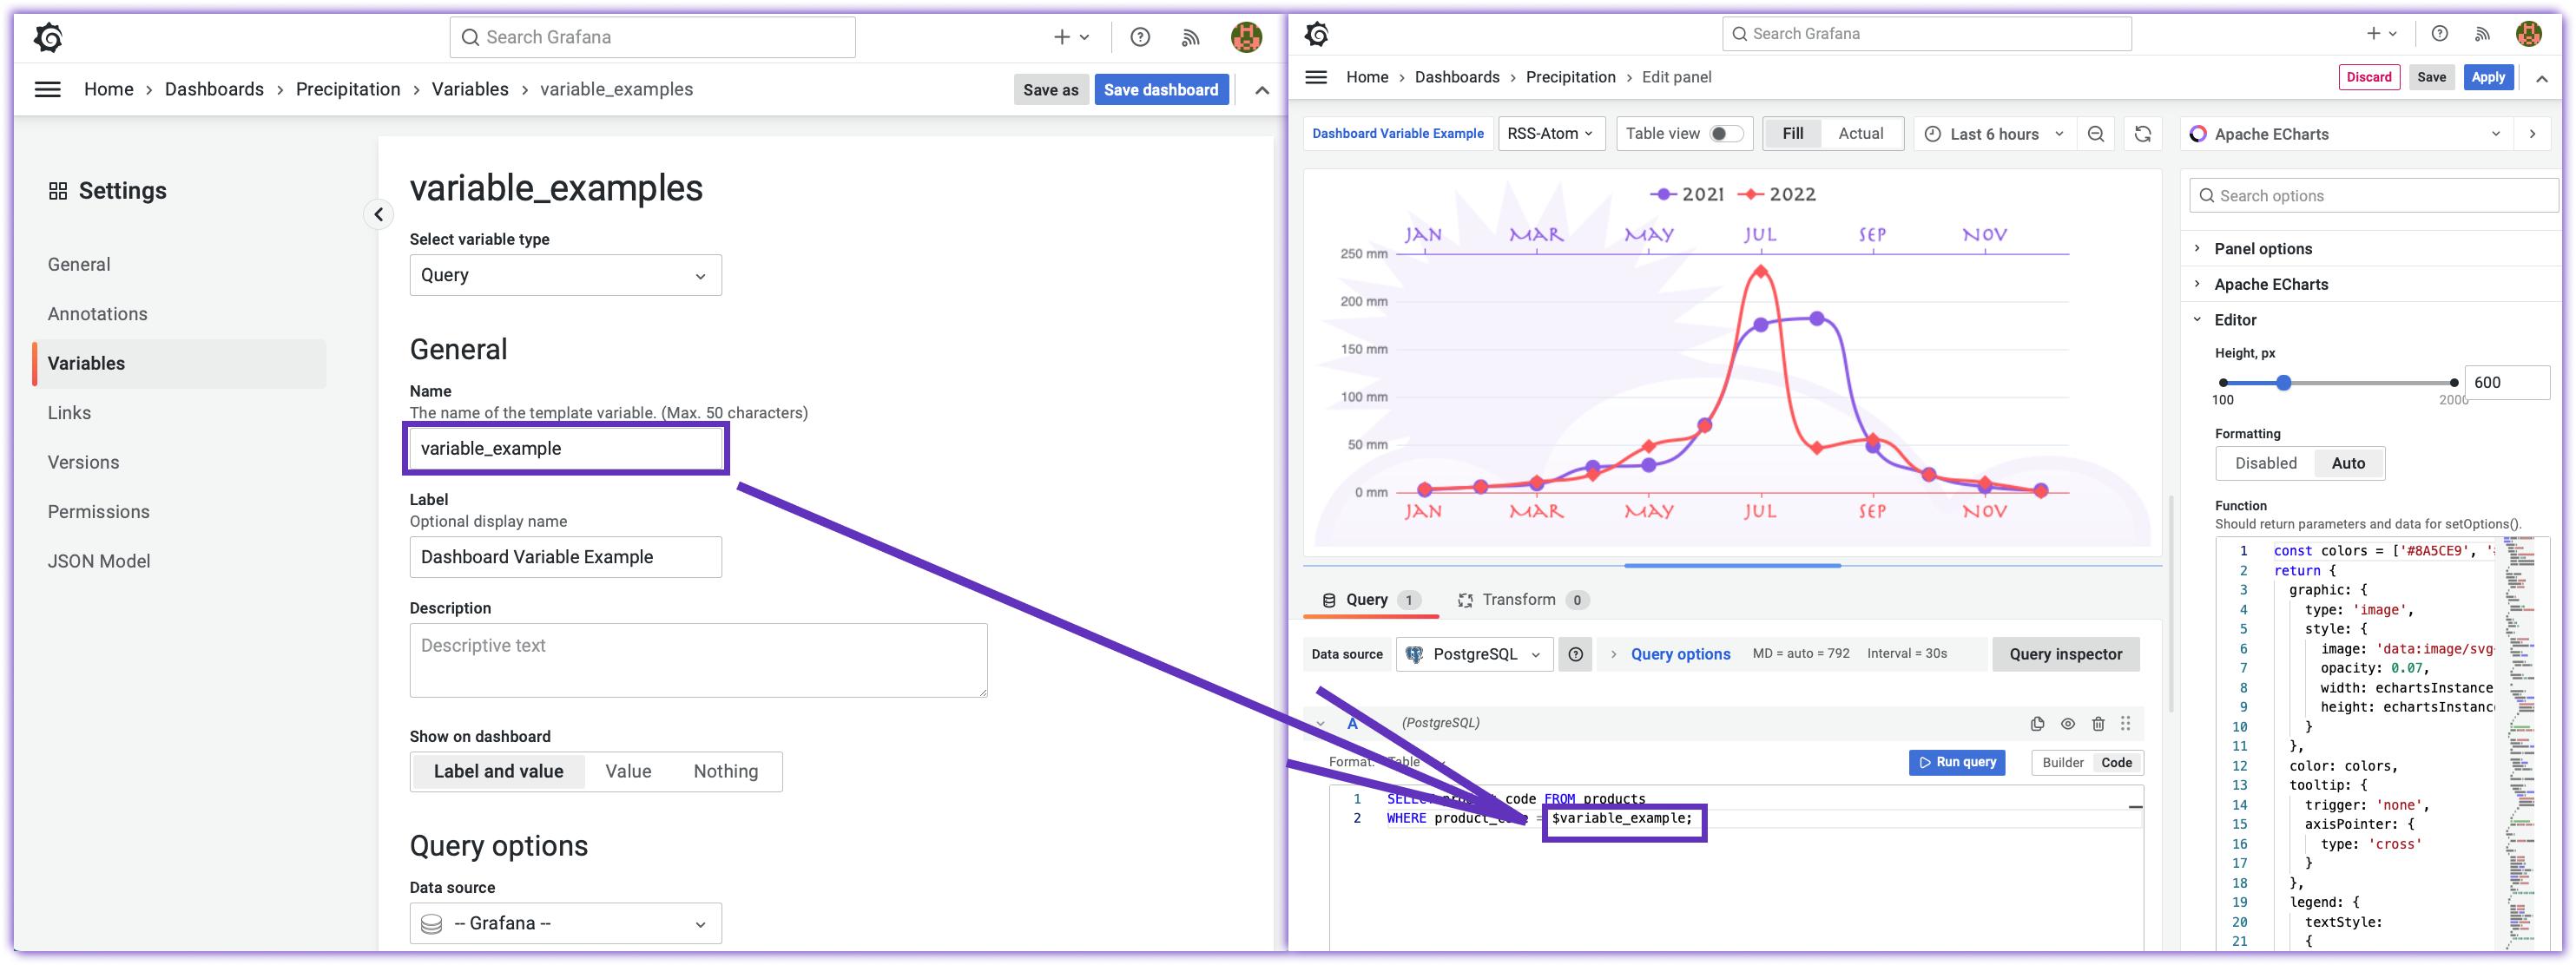
As the name implies, they are created for a dashboard. Only users with Edit permissions or higher can maintain them. The dashboard variables configuration menu is located in the Dashboard settings, Variables menu.
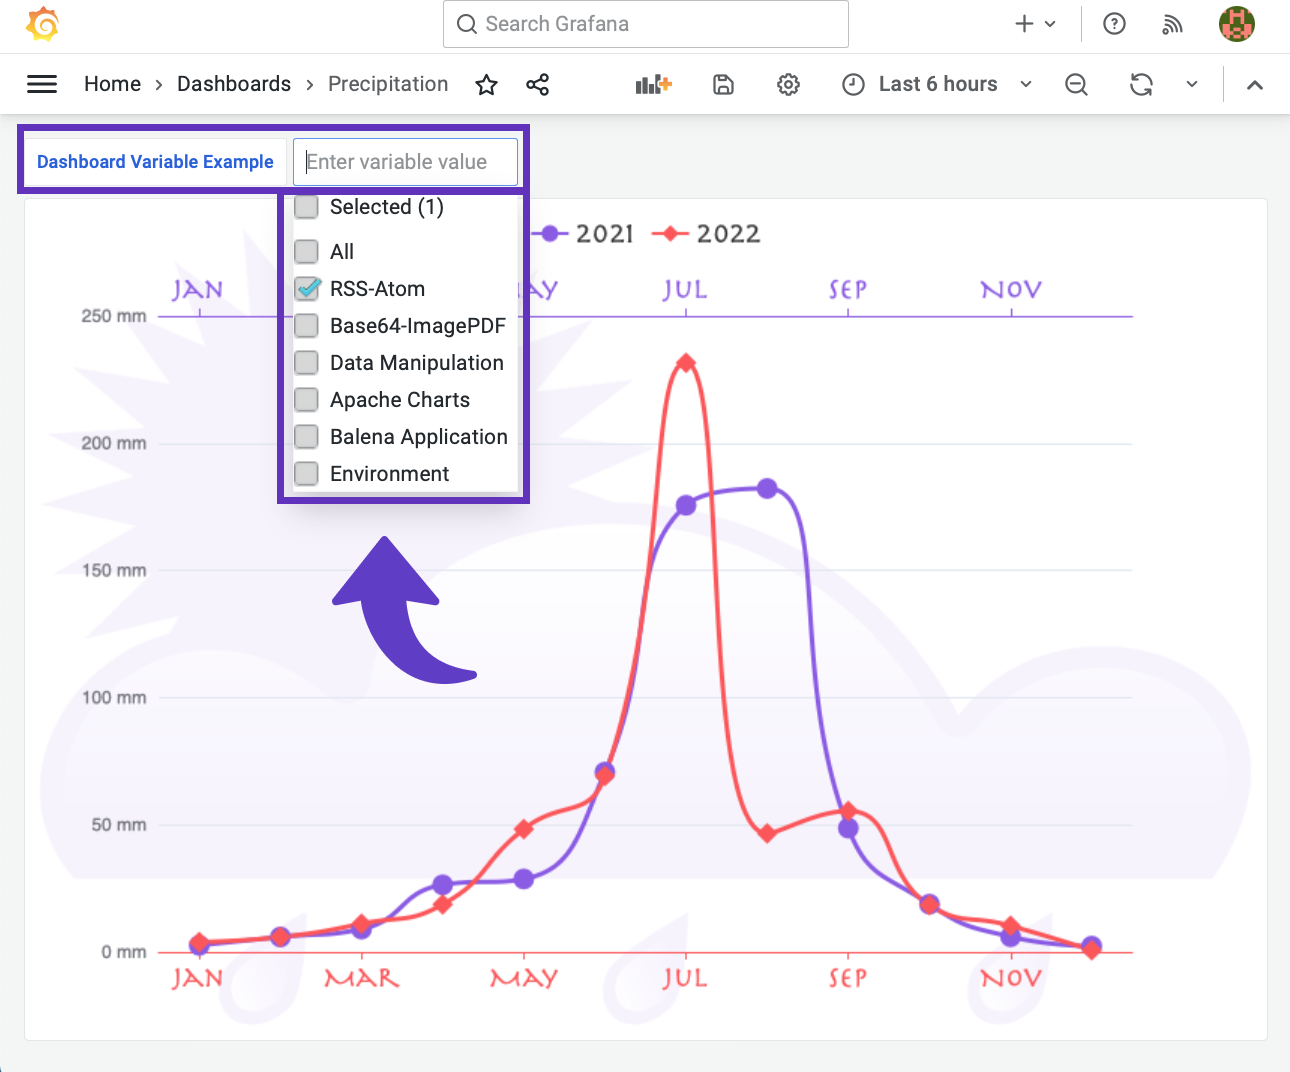
Once a variable is created, it is displayed on the top of your dashboard as a drop-down list unless you made it hidden. Multi-selection and Select All are optional and configurable in the Variable management panel.
To reference a dashboard variable in the queries and panels' code, add a $ (dollar sign) as a prefix.
Most of the time a dashboard variable plays a filter role to limit the displayed data on your panels. If that is the purpose, add it to all your dashboard queries accordingly.
Any dashboard variable is a one-dimensional array of data elements.
Hard-coded
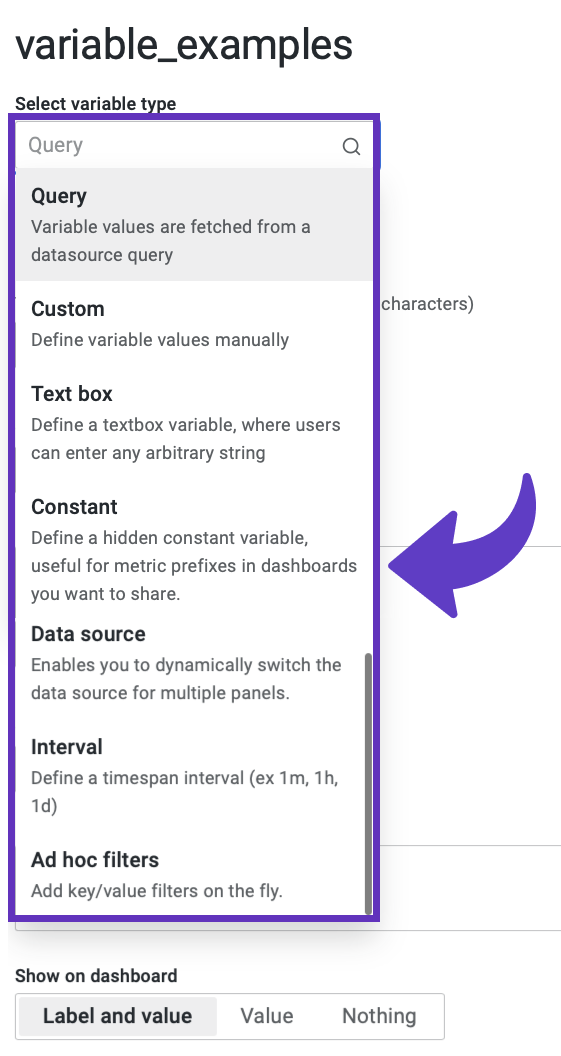
Meaning set up when you create a variable. The types for these are:
- Constant. It is one value. Example:
1. - Custom. It is many values. Example:
1, 2, 3, 56. - Interval. It is a built-in Grafana type designed to use as a time interval parameter. Examples are
500ms,30m,1h,6h,1d,14d, etc.
Text box
I am not aware of a good business case for the use of this one. If you do, please, share. This type of dashboard variable allows the user to enter any value in a text box.
One concerning issue with that it is not a foolproof concept. A dashboard creator would need to add an extra validation for any limitation of characters to ensure meaningful parameters.
The other concerning detail, this type also might give a wrong impression that the entered value can be stored in the data source. It is not true.
The time span of the entered value is limited until the next dashboard refresh. The text box is just plainly what it is, the values are not stored anywhere, and the user can not reuse the entered values without typing them again, nor could they be sent down the pipeline for processing.
Query
This is my favorite type of dashboard variable. They are populated from the connected data source according to your query.
Global variables
Grafana Global variables are read-only and designed to store the statuses of the working Grafana instance. You can think of them as process indicators.
| Variable | Description |
|---|---|
${__dashboard} | Name of the current dashboard. |
${__from} | From of Time Range in epoch milliseconds. |
${__interval} | Parameter to group by time. |
${__org.name} | Name of the current organization. |
${__org} | Id of the current organization. |
${__to} | To of Time Range in epoch milliseconds. |
${__user.email} | Email for the current user. |
${__user.id} | Id of the current user. |
${__user.login} | Login handle of the current user. |
You can find the complete list of all global variables in the Grafana Documentation.
Environment variables
Grafana could be installed in a Docker container or directly on the operating system. If you need more details, watch the following YouTube video demonstrating two types of Grafana installation in a Docker container and on Windows/Mac.
In both types of installation, an environment variable is a key-value parameter that is designed to either capture a descriptive system element or value to impact the running process. In other words, those variables can keep the system configuration secrets and statuses. That imposes the need for extra caution while working with them.
Environment Data Source
To stay out of trouble, Grafana core chose not to support the environment variables at this time. Yet, many industrial cases require the ability to display environment variables, for instance, in cases where the goal is to manage numerous remote devices (ex, IoT networks).
Following the community demand, we created an Environment data source to supplement that ability. Employing the Environment data source allows you to display and use the environment variables of all your devices in one spot, the Grafana dashboard.
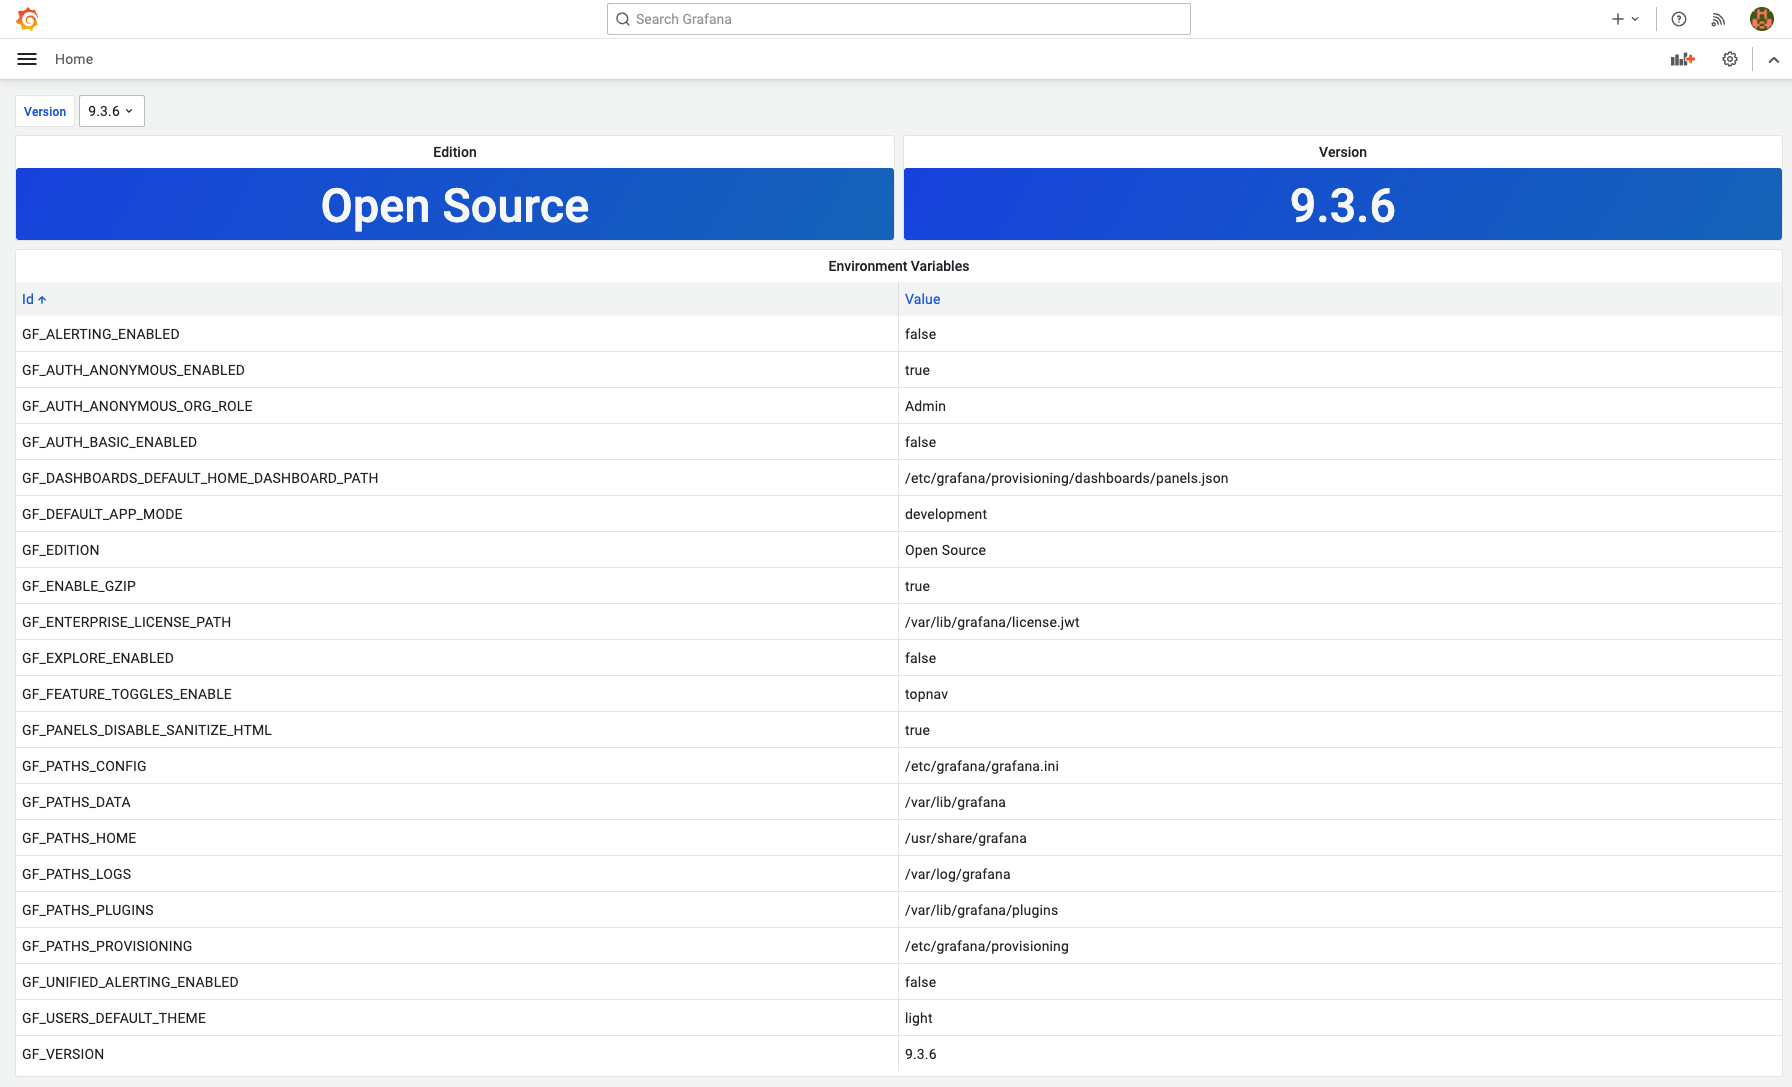
For demo purposes below, I use the standard Table panel. Here is what the list of all my environment variables looks like:
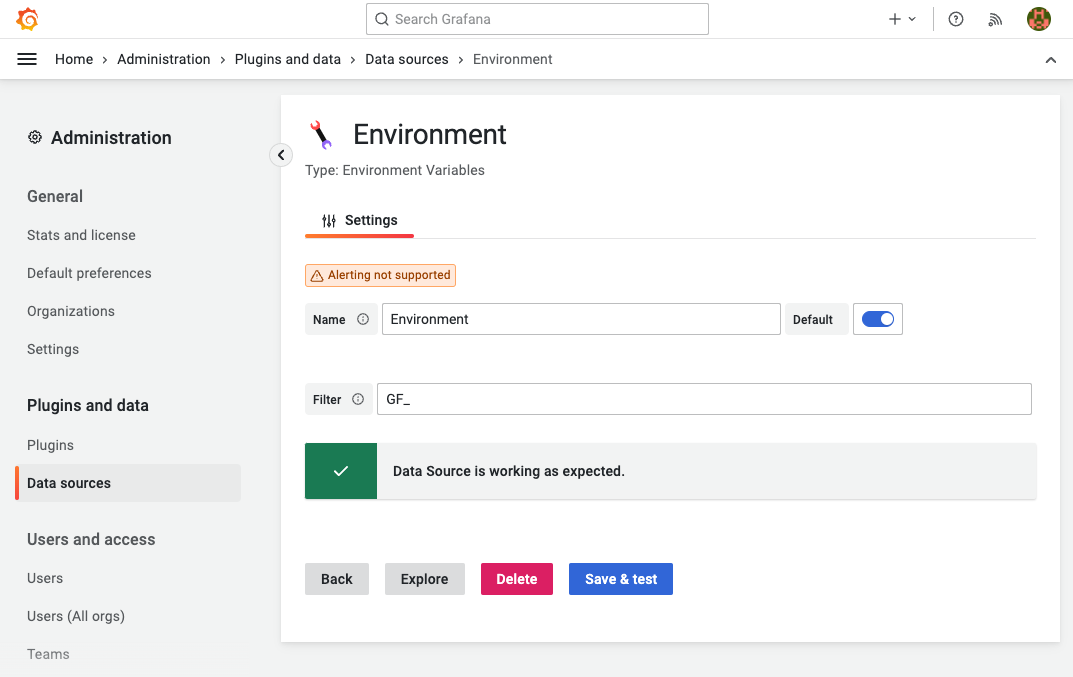
Configuration
To make the environmental data source more secure, you can restrict the variables that are allowed to be shown in the Environment data source configuration. For the endless possibilities, the filter utilizes a regex pattern
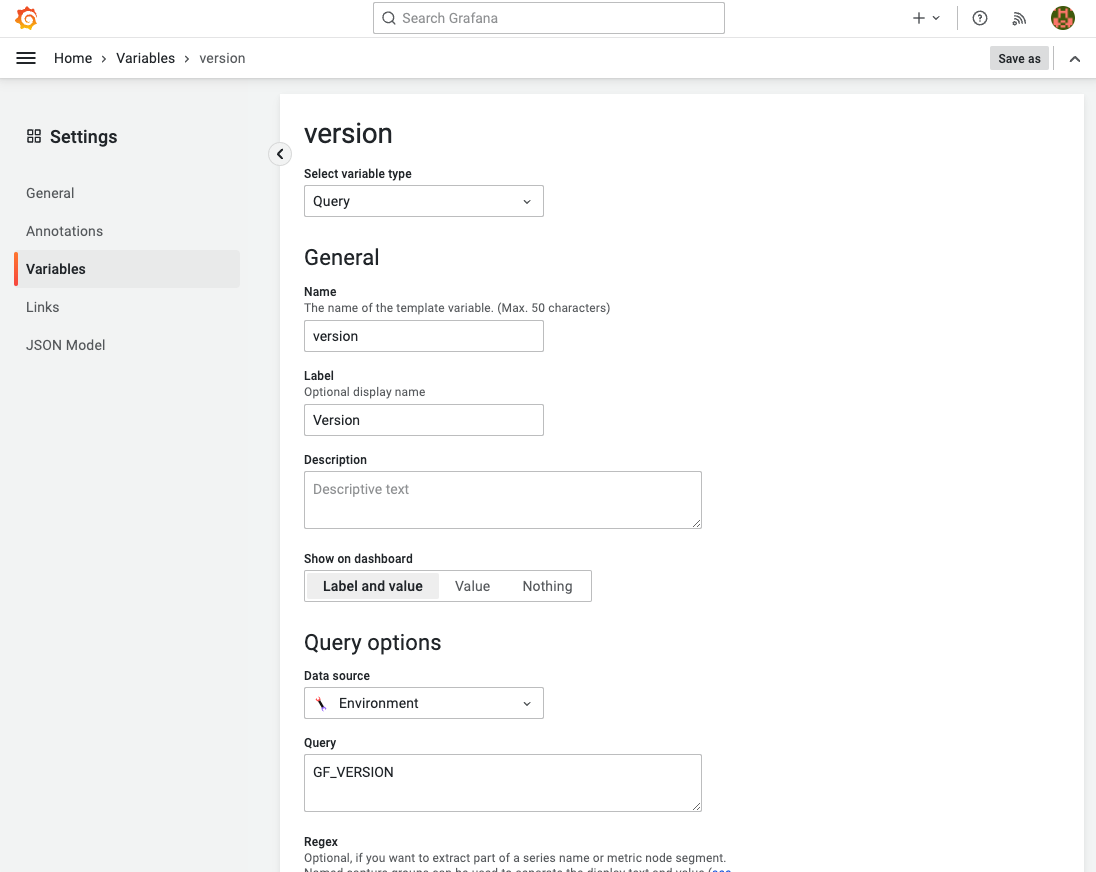
One more exciting thing to point out. Any environment variable your dashboard gets access to via the Environment data source can be used as a dashboard variable!
For that, when you create a dashboard variable, select the Environment data source.