Environment Variables for Configuration, Provisioning, and Dashboards in Grafana

The number of use cases operating Grafana as a platform to build modern applications is increasing. Compared to a single central Grafana instance, we are looking at multiple distributed installations with new data sources.
One example is the Environment data source, which we created for our customer, who uses balenaCloud, the container-based platform for deploying Internet of Things (IoT) fleets of connected Linux devices.
In balenaCloud each IoT device is independent of its own Grafana instance, and each device can be uniquely identified by environment variables exposed within the project.
Watch this video about the dashboard, global, and environment variables in Grafana.
Before looking at the Environment data source, let's examine how you can utilize environment variables in Grafana.
Configuration
Grafana has default and custom configuration files. You can customize your Grafana instance by modifying the configuration file or using environment variables.
To override an option, use a predefined pattern GF_<SectionName>_<KeyName> to name exported variables.
export GF_DEFAULT_INSTANCE_NAME=my-instance
export GF_SECURITY_ADMIN_USER=owner
export GF_AUTH_GOOGLE_CLIENT_SECRET=newS3cretKey
Docker
If you are using Docker and Docker Compose, then environment variables can be set in the command line or the docker-compose.yml file.
grafana:
  container_name: grafana
  image: grafana/grafana:latest
  ports:
    - 3000:3000
  environment:
    - GF_AUTH_ANONYMOUS_ORG_ROLE=Admin
    - GF_AUTH_ANONYMOUS_ENABLED=true
    - GF_AUTH_BASIC_ENABLED=false
    - GF_ENABLE_GZIP=true
    - GF_USERS_DEFAULT_THEME=light
You can find all available configuration options in the Documentation.
Provisioning
It is possible to use environment variable interpolation in all three provisioning configuration types. The allowed syntax is either $ENV_VAR_NAME or ${ENV_VAR_NAME} and can be used only for values.
Dashboard's definition files do not support environment variables, just in the dashboard provisioning configuration.
Example of using environment variables for data source provisioning.
datasources:
  - name: Example
    url: http://localhost:$PORT
    user: $USER
    secureJsonData:
      password: $PASSWORD
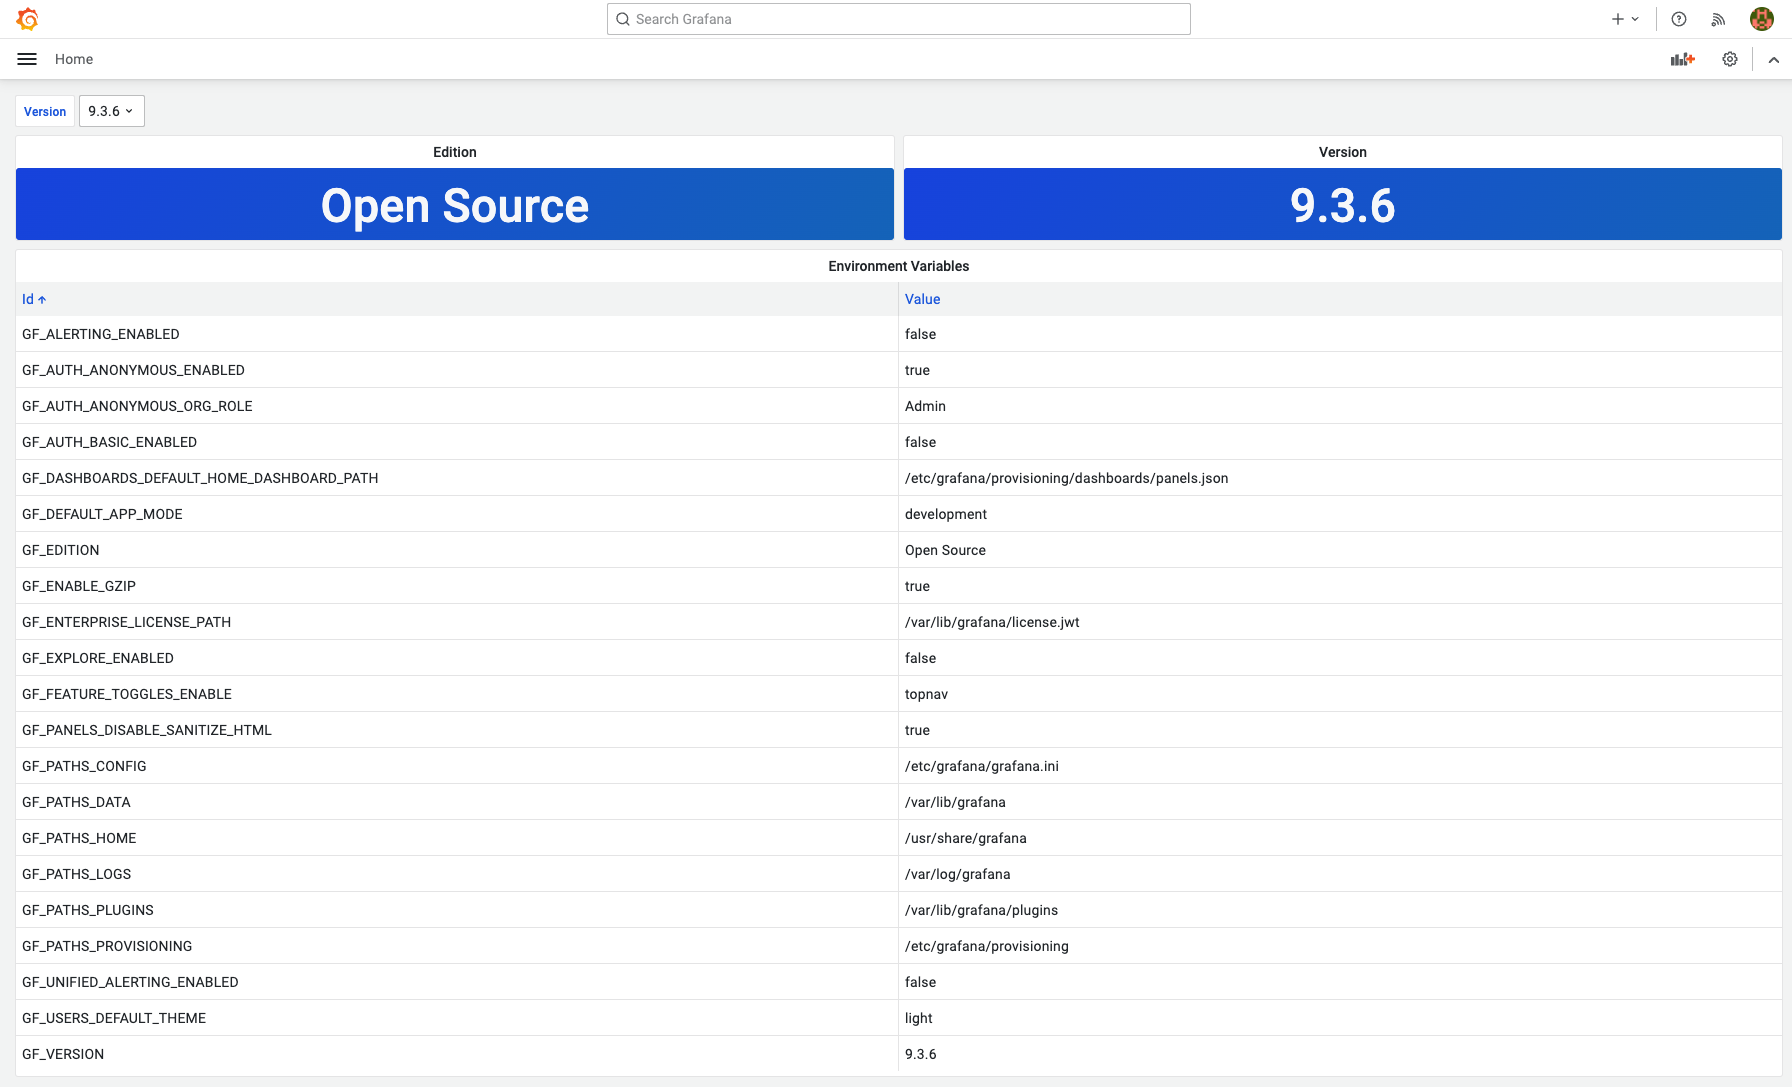
Display Environment Variables
Surprisingly, we could not find a solution on how to display environment variables on the dashboard and decided to create a backend data source plugin that retrieves environment variables exposed to the Grafana instance.
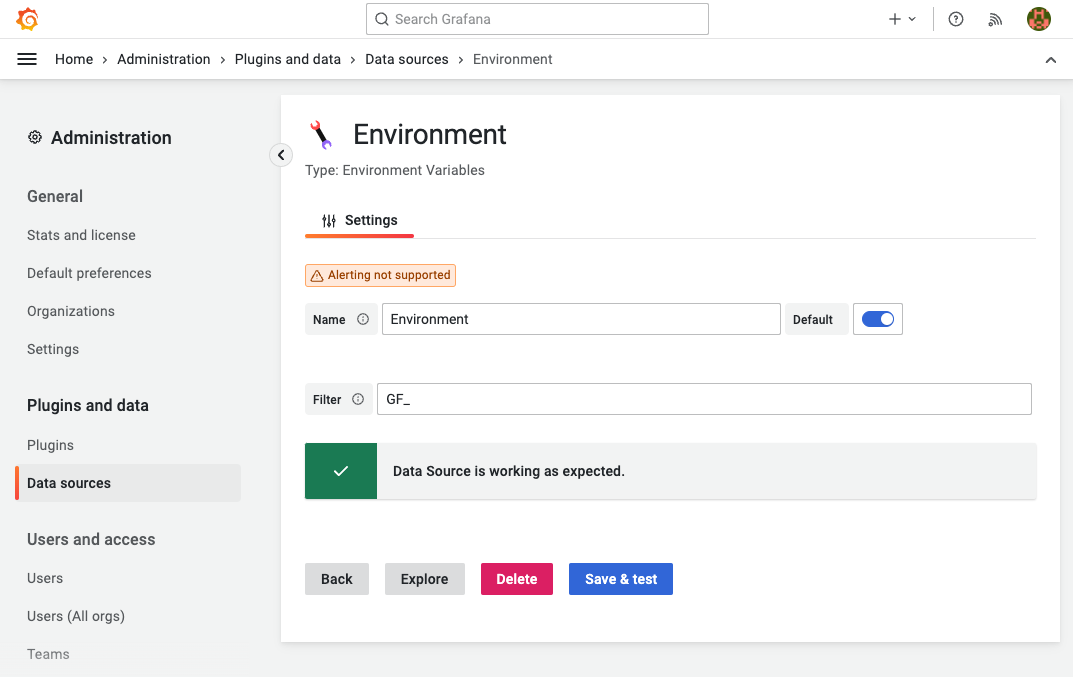
Configuration
In Settings, the data source has the Filter option to avoid exposing unnecessary or secured variables.
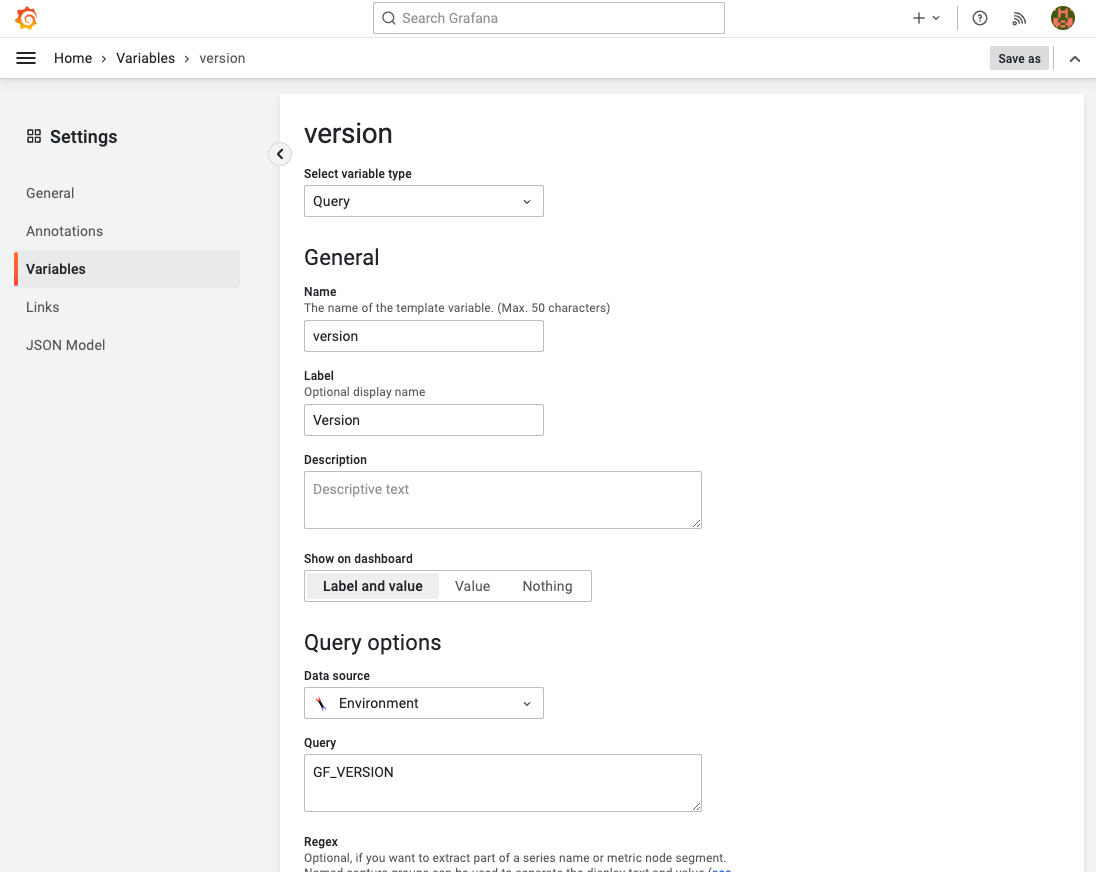
Dashboard Variables
Dashboard variables allow you to create more interactive and dynamic dashboards. Instead of hard-coding things like server, application, and sensor names in your metric queries, you can use variables in their place. Variables are displayed as dropdown lists at the top of the dashboard.
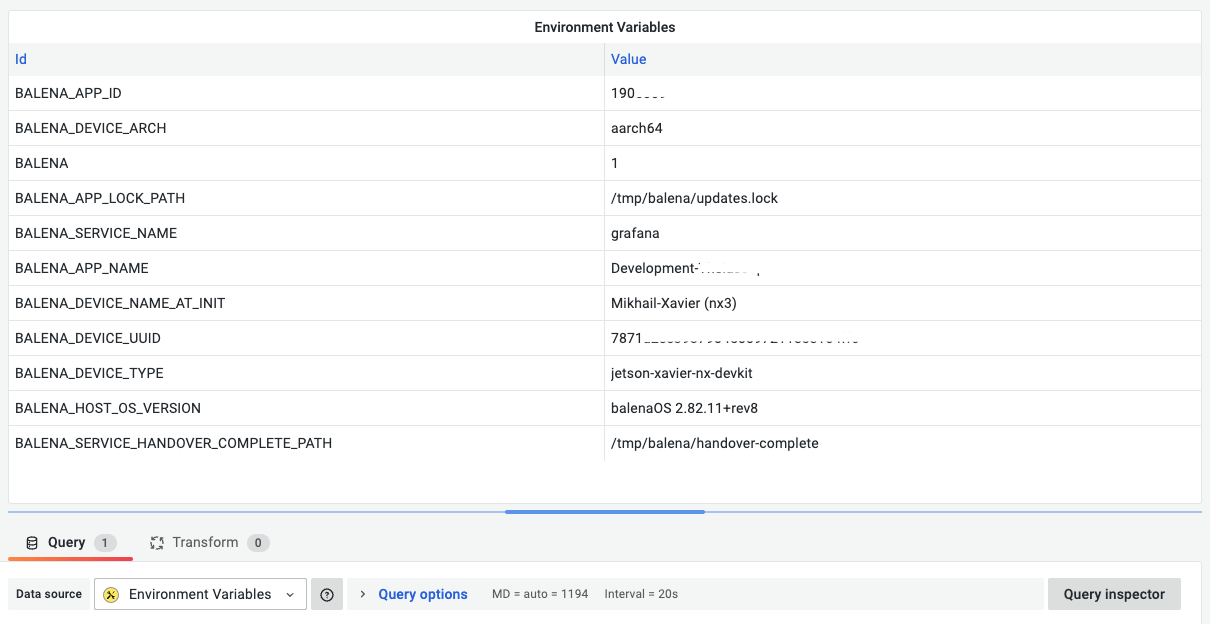
The Environment data source supports querying environment variables and returns its value to retrieve metric queries or display them on the dashboard.
balenaCloud
Balena is a complete set of tools for building, deploying and managing fleets of connected Linux devices. As we mentioned, each IoT device in our project provides Grafana with a custom application plugin for end-users.
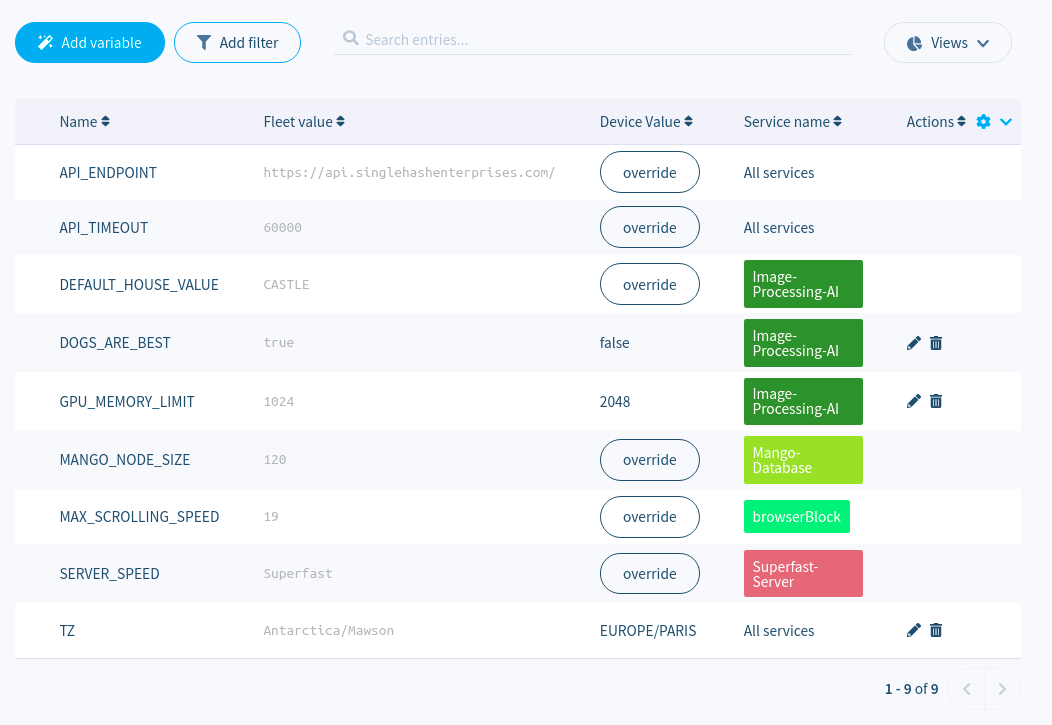
Variables can be added to the device and assigned to a specific service or all services running on the device. You can use environment variables to store secrets and other sensitive values out of your codebase and configure them when needed.
Employing the Environment data source, you can retrieve custom and generic environment variables configured for the IoT device and display them on Grafana's Home page and improve other dashboards.