Unlock your data's potential: why Business Table is Grafana's hidden advantage


At Volkov Labs, we're all about making Grafana work harder for businesses—and our Business Table panel is a prime example. Grafana's native table panel is great for basic data display, but when it comes to business use cases—think sales tracking, inventory management, or customer insights—you need more.
That's where Business Table steps in, transforming static data into an interactive, actionable tool. Here's why it's a must-have for your dashboards.
Turn Data into a Clear, Visual Story
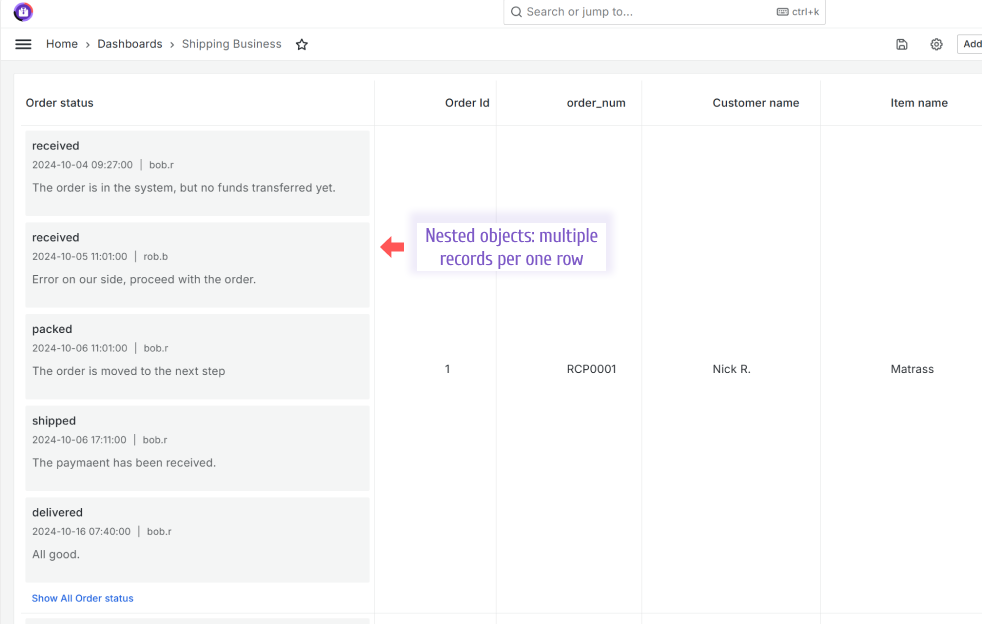
Let's face it: raw data can be overwhelming. Business Table takes your sprawling datasets—whether from SQL, APIs, or Prometheus—and organizes them into a clean, intuitive table. With features like tree views (expandable/collapsible rows) and tabbed layouts for multiple data frames, you can dig into details without losing the big picture.
It's perfect for presenting nested info, like order histories or hierarchical team stats.
Edit on the Fly—No More Back-and-Forth
Since version 1.9.0, Business Table lets you add, edit, or delete rows right in your dashboard. Imagine updating a task list, tweaking inventory counts, or logging customer notes without leaving Grafana.
This interactivity cuts out the middleman—your data stays live, and your team stays productive. It's a game-changer for workflows that demand real-time adjustments.
Filter and Paginate Like a Pro
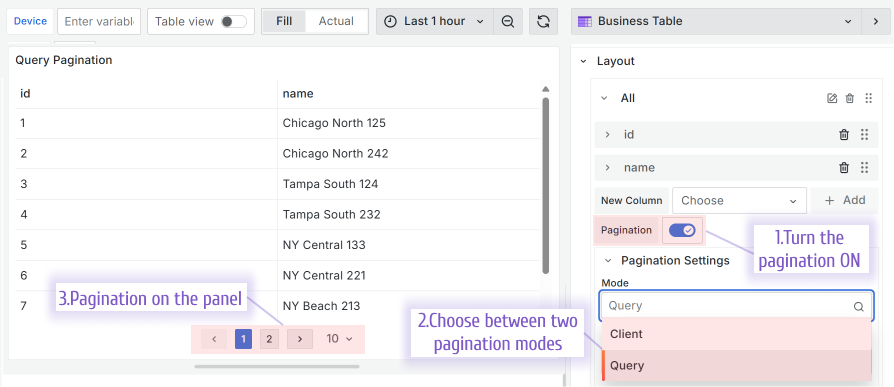
Big datasets? No problem. Business Table hooks into Grafana's dashboard variables for dynamic filtering—say, zooming in on sales for a specific region or product. Plus, server-side pagination keeps things snappy, even with thousands of rows.
You get the data you need, fast, without the lag.
Spot Issues Instantly with Thresholds
Business isn't just numbers; it's decisions. With Business Table, Grafana's threshold system comes alive—color-code cells, rows, or totals based on your KPIs. A cell turning red when stock dips below 50? A row lighting up green when sales hit the target?
These visual cues make it easy to act before small issues become big problems.
Customize to Fit Your Business
One size doesn't fit all, and Business Table gets that. Add nested objects (like comments in a cell), tweak column types (switches, text editors, you name it), or hide headers for a minimalist look.
Whether you're tracking logistics, managing support tickets, or analyzing customer trends, you can tailor the layout to match your needs perfectly.
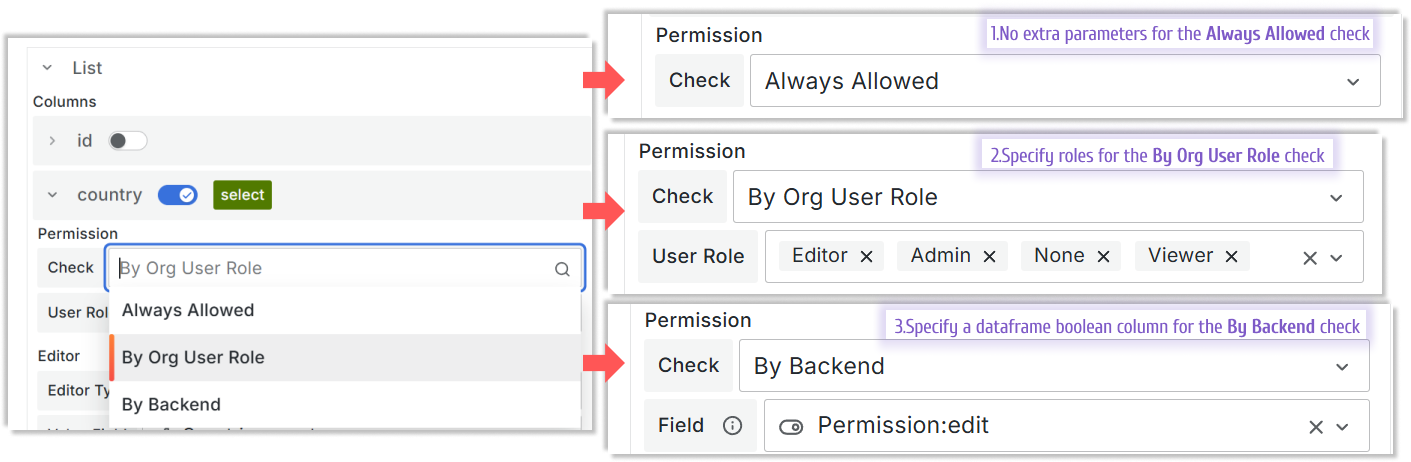
In addition, you have a powerful flexibility when it comes to permissions. You can easily restrict/grant access to specific actions following your business case requirements.
Choose between permission by user role or any custom logic.
Supercharge Your Business Suite Experience
As part of our Business Suite, this plugin plays nicely with companions like Business Charts, Business Variable and others. Pair it with real-time alerts or sleek visualizations, and you've got a full Business Intelligence platform in Grafana.
It's not just a table—it's the backbone of a smarter dashboard ecosystem.

Why It Matters
Grafana's power lies in its flexibility, but businesses need more than pretty graphs. The Business Table plugin bridges that gap, turning data into a living, breathing part of your operations.
Whether you're a small team juggling tasks or an enterprise monitoring global metrics, it delivers clarity, control, and efficiency—all within the platform you already love.
Ready to Try It?
The Business Table plugin is available in Grafana catalog. Install it, play with it, and see how it transforms your dashboards.
Let's make your data work as hard as you do.
Volkov Labs Is Now Closed
Following our acquisition, Volkov Labs has officially ceased operations as of September 26, 2025. We are no longer accepting feedback, support requests, or partnership inquiries. The Business Suite for Grafana repositories have been archived on our GitHub organization, and no further development or support will be provided.
We are deeply grateful for the incredible support from our community and partners over the past four years.