Business Charts
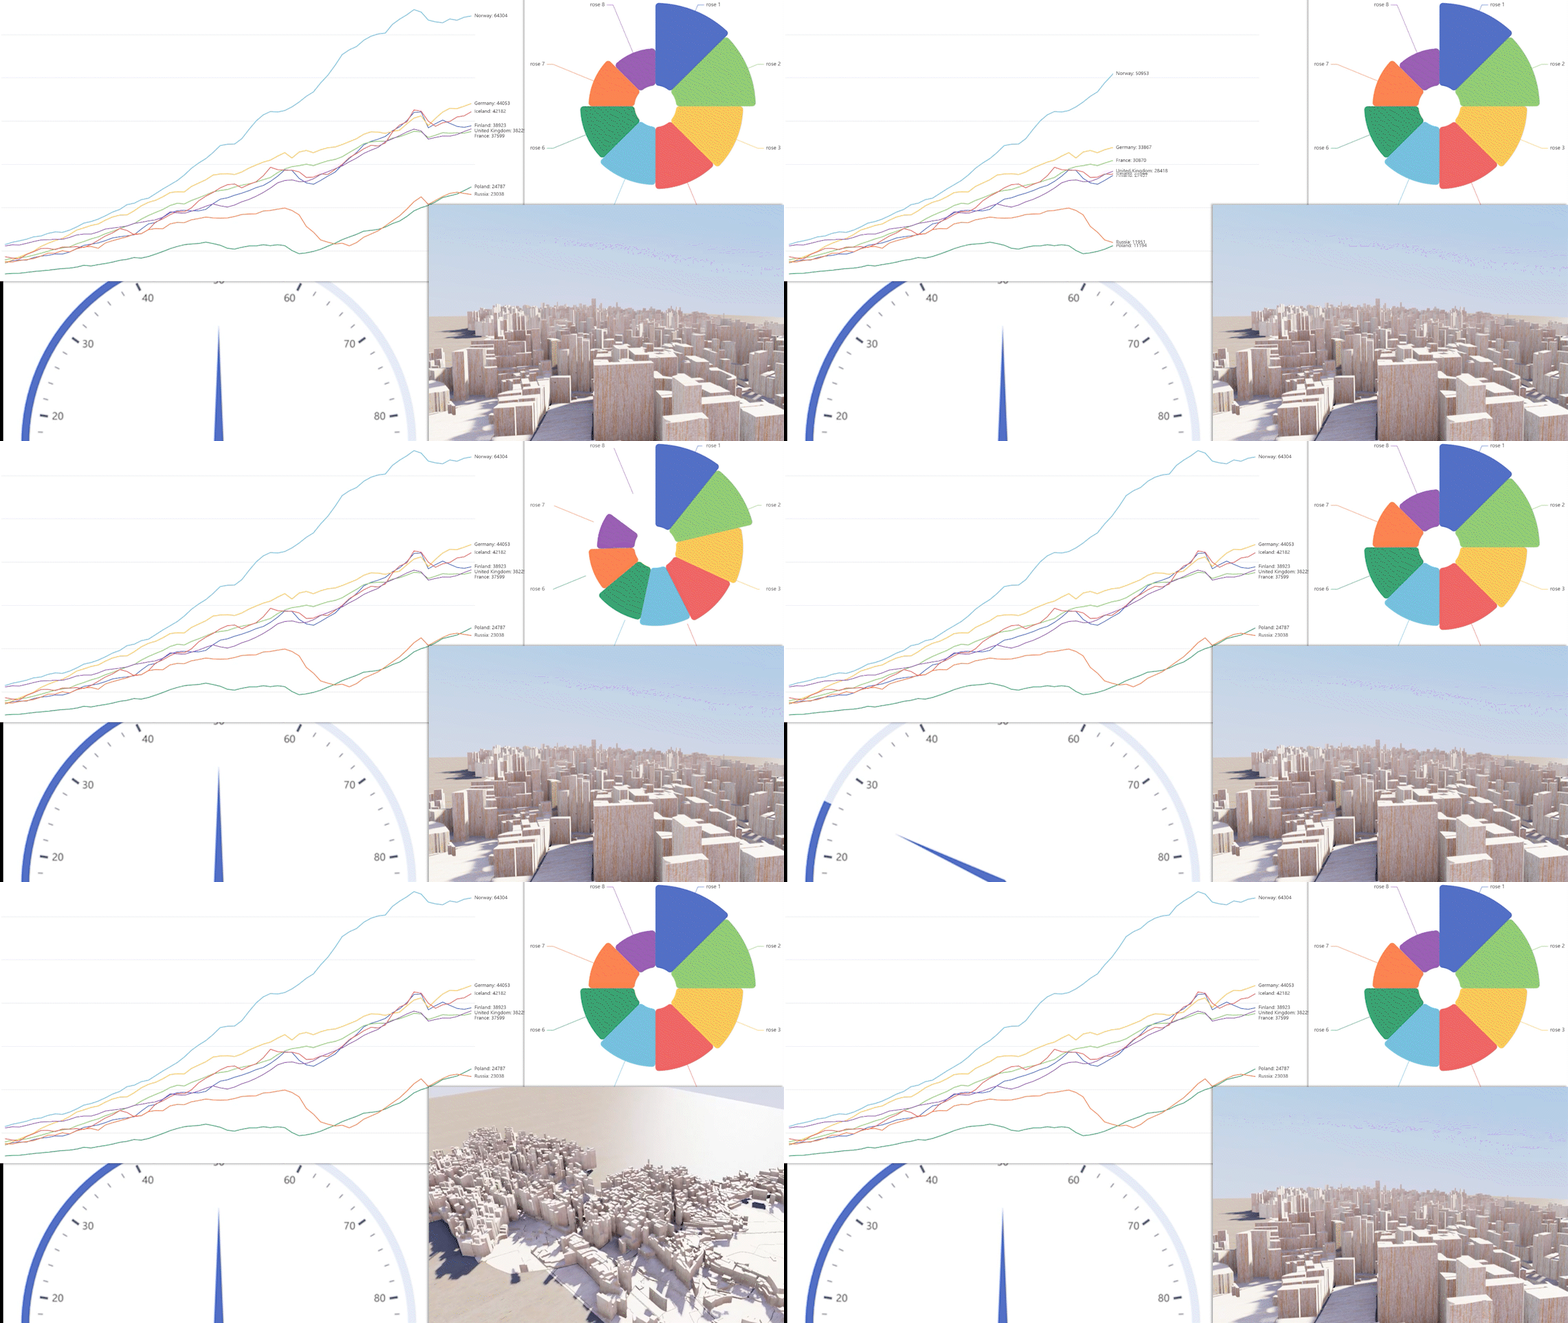
The Business Charts panel allows you to integrate charts and graphs created by the Apache ECharts library into your Grafana dashboard.
Apache ECharts is a powerful and versatile data visualization library providing a wide range of chart types including statistical capabilities. It is written in pure JavaScript and based on zrender, a lightweight graphic library for chart rendering.
The Business Charts plugin offers an easy way of adding intuitive, interactive, and highly customizable charts to your Grafana dashboard.
Requirements
- Business Charts panel 7.X requires Grafana 11 or Grafana 12.
- Business Charts panel 6.X requires Grafana 10 or Grafana 11.
- Apache ECharts panel 5.X requires Grafana 9 or Grafana 10.
- Apache ECharts panel 3.X and 4.X require Grafana 8.5 or Grafana 9.
Getting Started
You can install the Business Charts panel from the Grafana Plugins catalog or using the Grafana command line tool.
For the latter, please use the following command.
grafana cli plugins install volkovlabs-echarts-panel
Highlights
- Provides Monaco Code Editor for:
- Working with Grafana data frames (JavaScript).
- Updating chart configurations in the JSON format.
- Customizing theme configurations.
- Supports Code Editor suggestions for parameters and variables.
- Supports SVG and Canvas renderers.
- Supports variables and locationService to make charts interactive.
- Includes USA and World GeoJSON maps. Additional maps can be loaded dynamically.
- Supports Baidu, Gaode, and Google Maps using API with required provision of the access key.
- Includes ECharts-GL proving 3D plots, globe visualization, and WebGL acceleration.
- Includes ecStat, a statistical and data mining tool.
- Includes Liquid Fill Chart to represent data in percentage.
- Supports real-time data updates using streaming data sources and Grafana Live.
- Supports light and dark themes adjusted to the Grafana theme.
- Based on Apache ECharts 5.5.1.
- Provides 100+ ready-to-use examples at echarts.volkovlabs.io.
- Supports the Wordcloud extension.

Tutorial
This is the first video we created about Business Charts after the plugin rebranding. It features dazzling chart examples followed by a high-level plugin architecture. Knowing the basics of plugin architecture will help you create your custom charts.
To get you started quicker we prepared the web resource with numerous ready-to-use examples. In the video, Daria demonstrates how to work with this resource.
The main obstacle for many plugin users is the data transmission from the Grafana data frame(s) into the Charts function. In the video, in addition to the resource with how-to examples, Daria introduces the Visual Editor - the mechanism we started to work on to simplify the transmission.
We have many other tutorials that you can find helpful. You can review all related to this plugin tutorials here.
Documentation
| Section | Description |
|---|---|
| Charts Function | Explains how to configure the main Apache ECharts library function. |
| Visual Editor | Explains how to work with the Visual Editor. |
| Examples | Explains how to get started with the Apache ECharts Examples in Grafana. |
| Features | Demonstrates the Business Charts panel features. |
| Maps | Demonstrates how to work with different maps. |
| Tutorials | Tutorials for the Business Charts panel. |
| Release Notes | Stay up to date with the latest features and updates. |
Acknowledgment
The Apache Software Foundation Apache ECharts, ECharts, Apache, the Apache feather, and the Apache ECharts project logo are either registered trademarks or trademarks of the Apache Software Foundation.
License
Apache License Version 2.0, see LICENSE.
Volkov Labs Is Now Closed
Following our acquisition, Volkov Labs has officially ceased operations as of September 26, 2025. We are no longer accepting feedback, support requests, or partnership inquiries. The Business Suite for Grafana repositories have been archived on our GitHub organization, and no further development or support will be provided.
We are deeply grateful for the incredible support from our community and partners over the past four years.