Charts Function
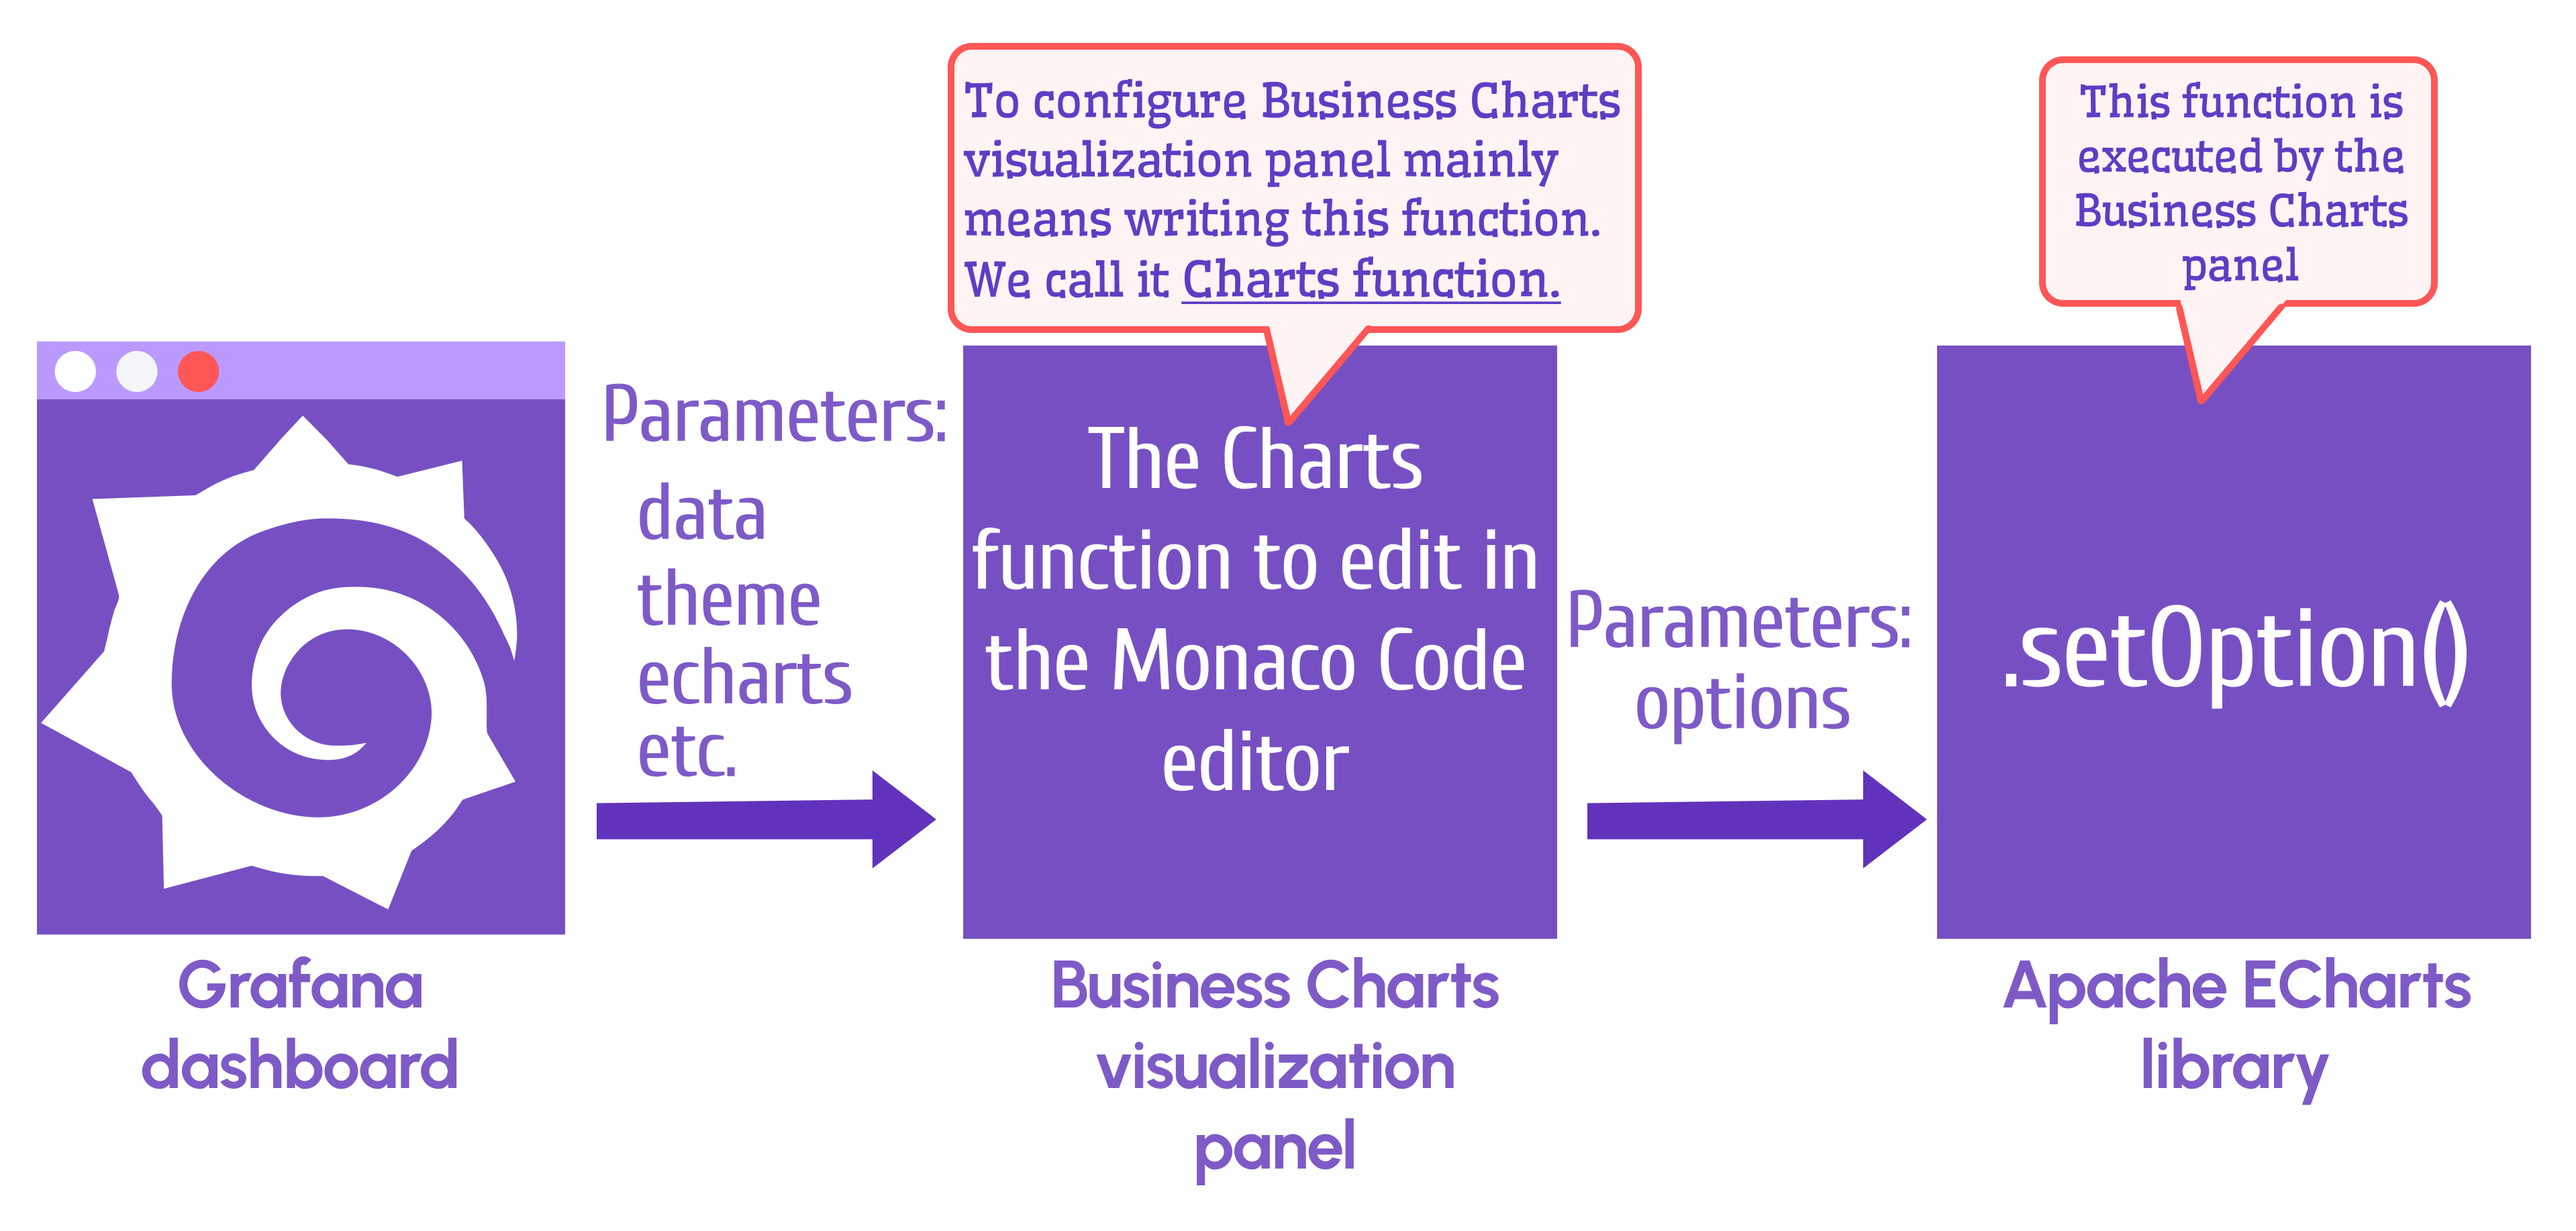
setOption(options) is the primary function in the Apache ECharts library. It is depicted as a square on the right in the schema below. This function gets called by the Business Charts panel (the Charts Function) with only one required parameter options.
The parameter options describes the charts in the JSON format.
Getting started
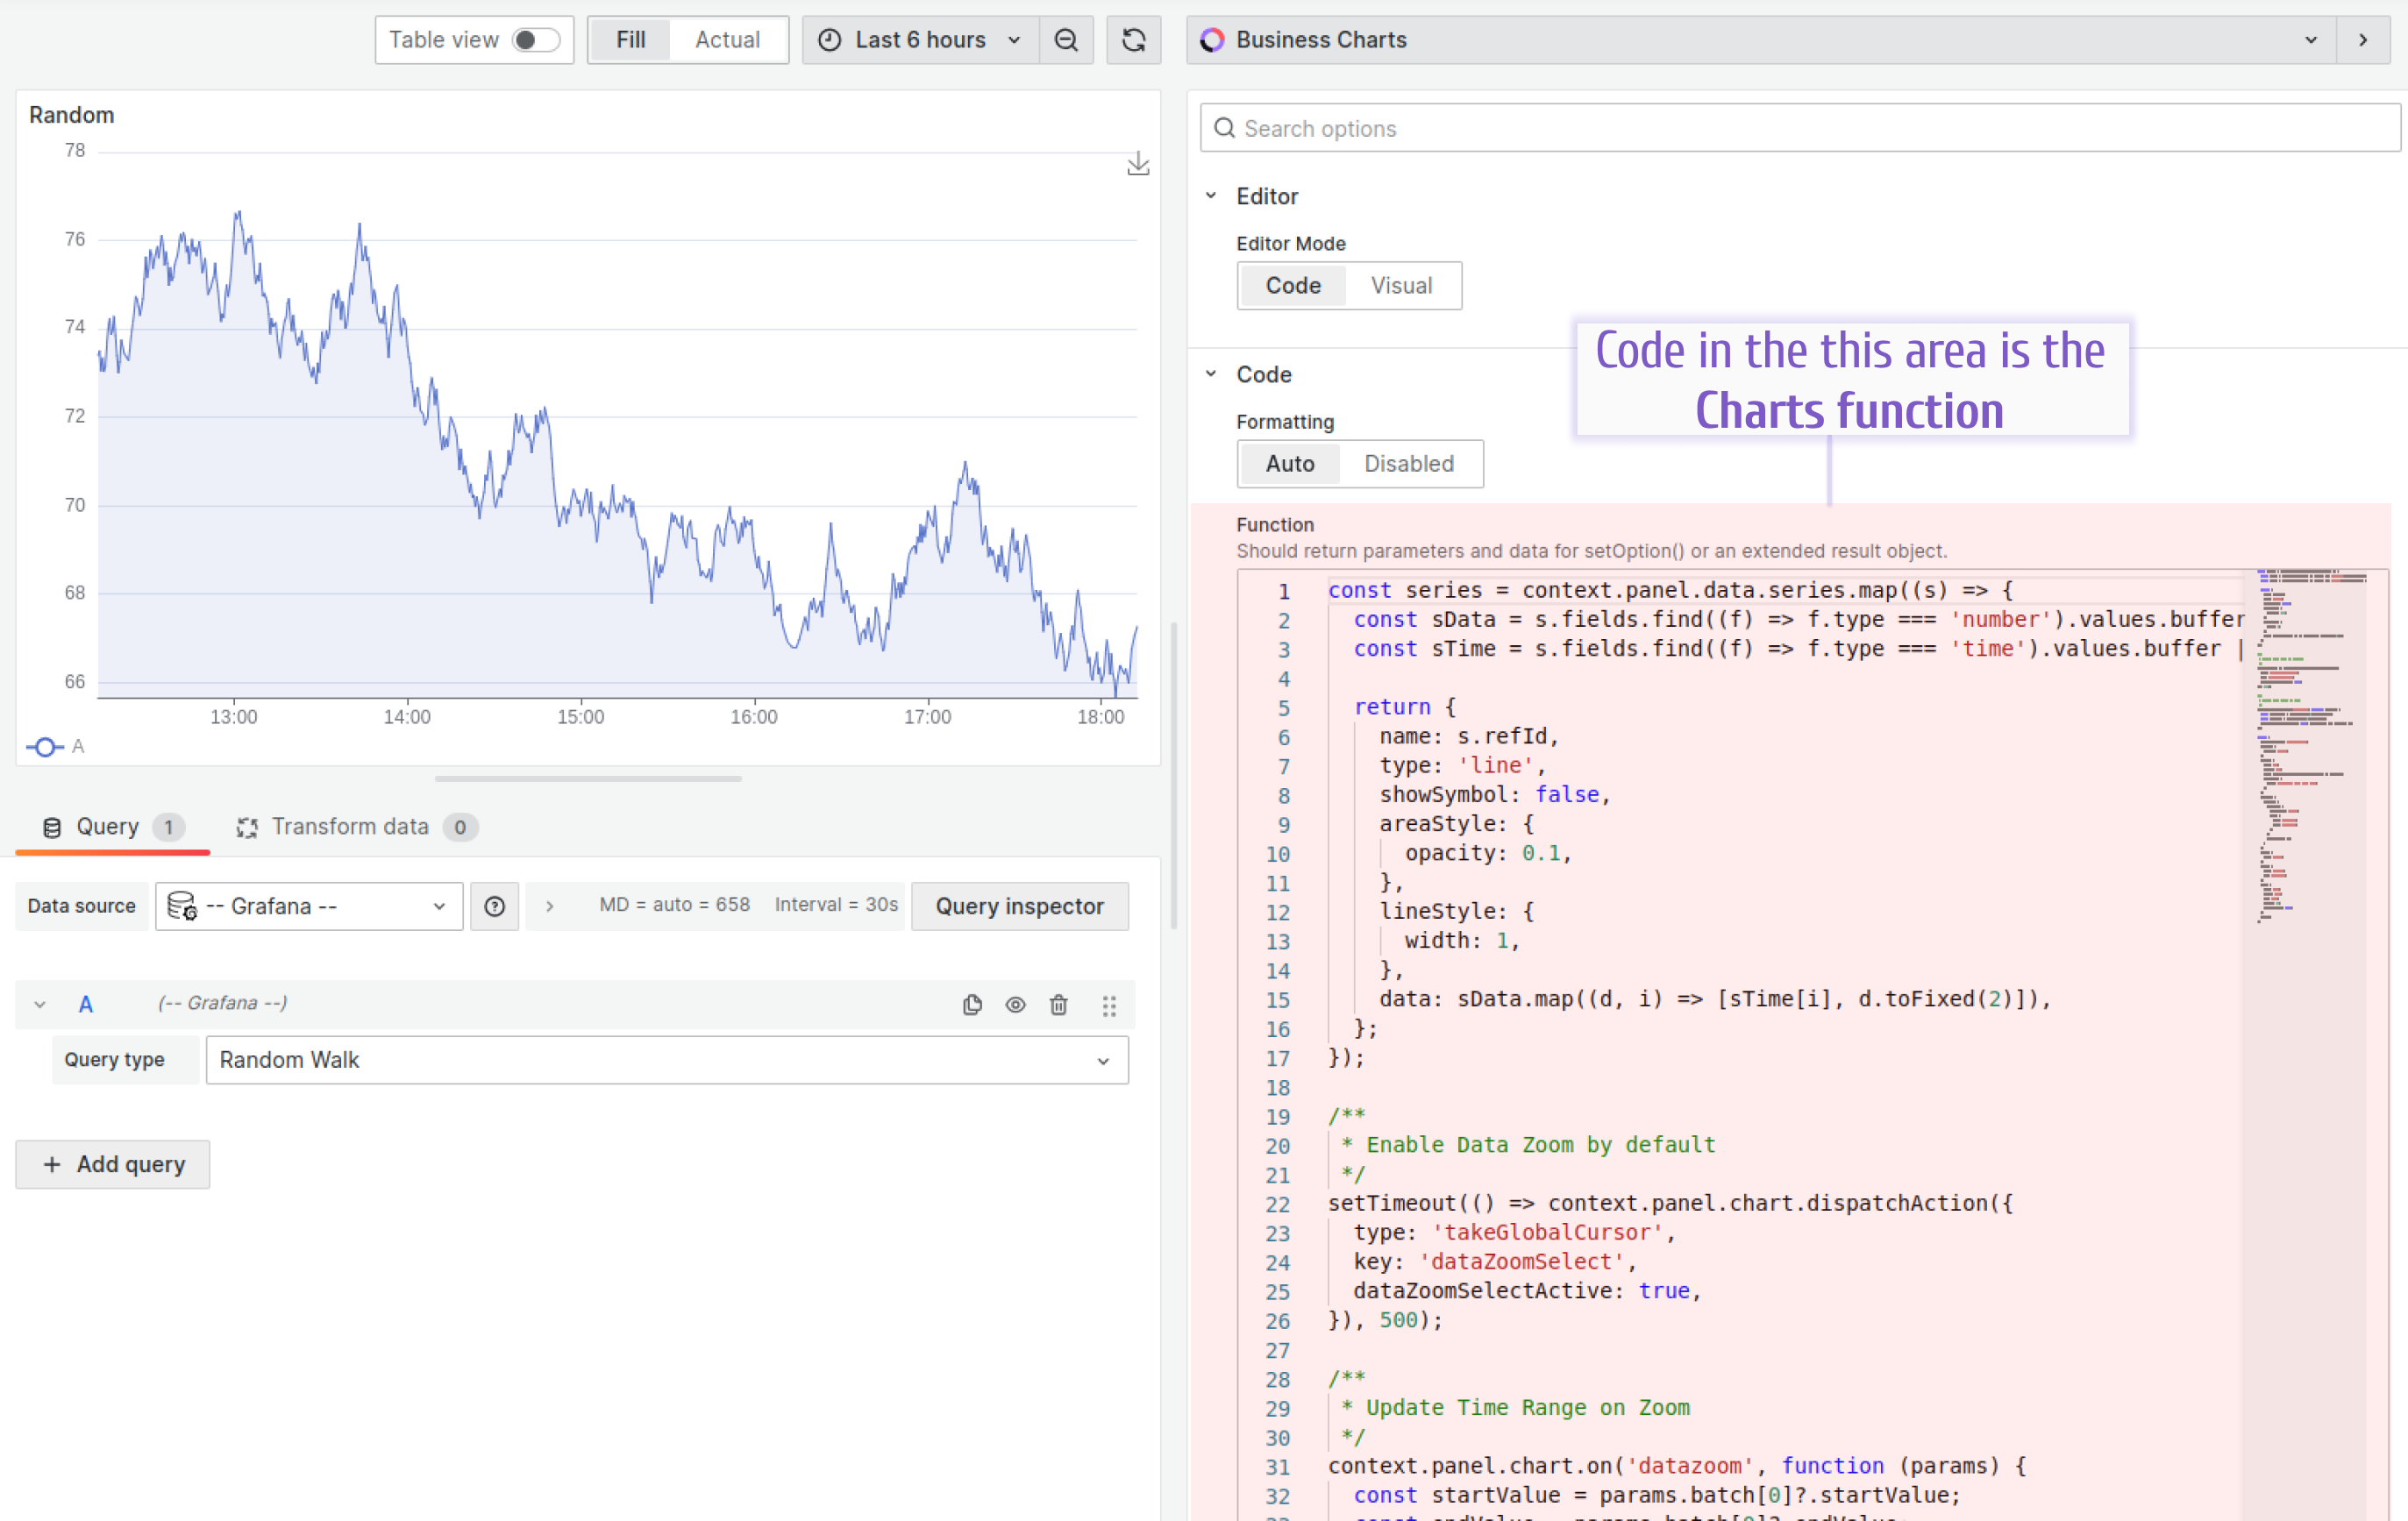
To configure the Business Charts panel mainly means writing the Charts Function. Generally, this function contains two parts:
- JavaScript to read data points from the data source.
- JSON to specify a graph as
options.
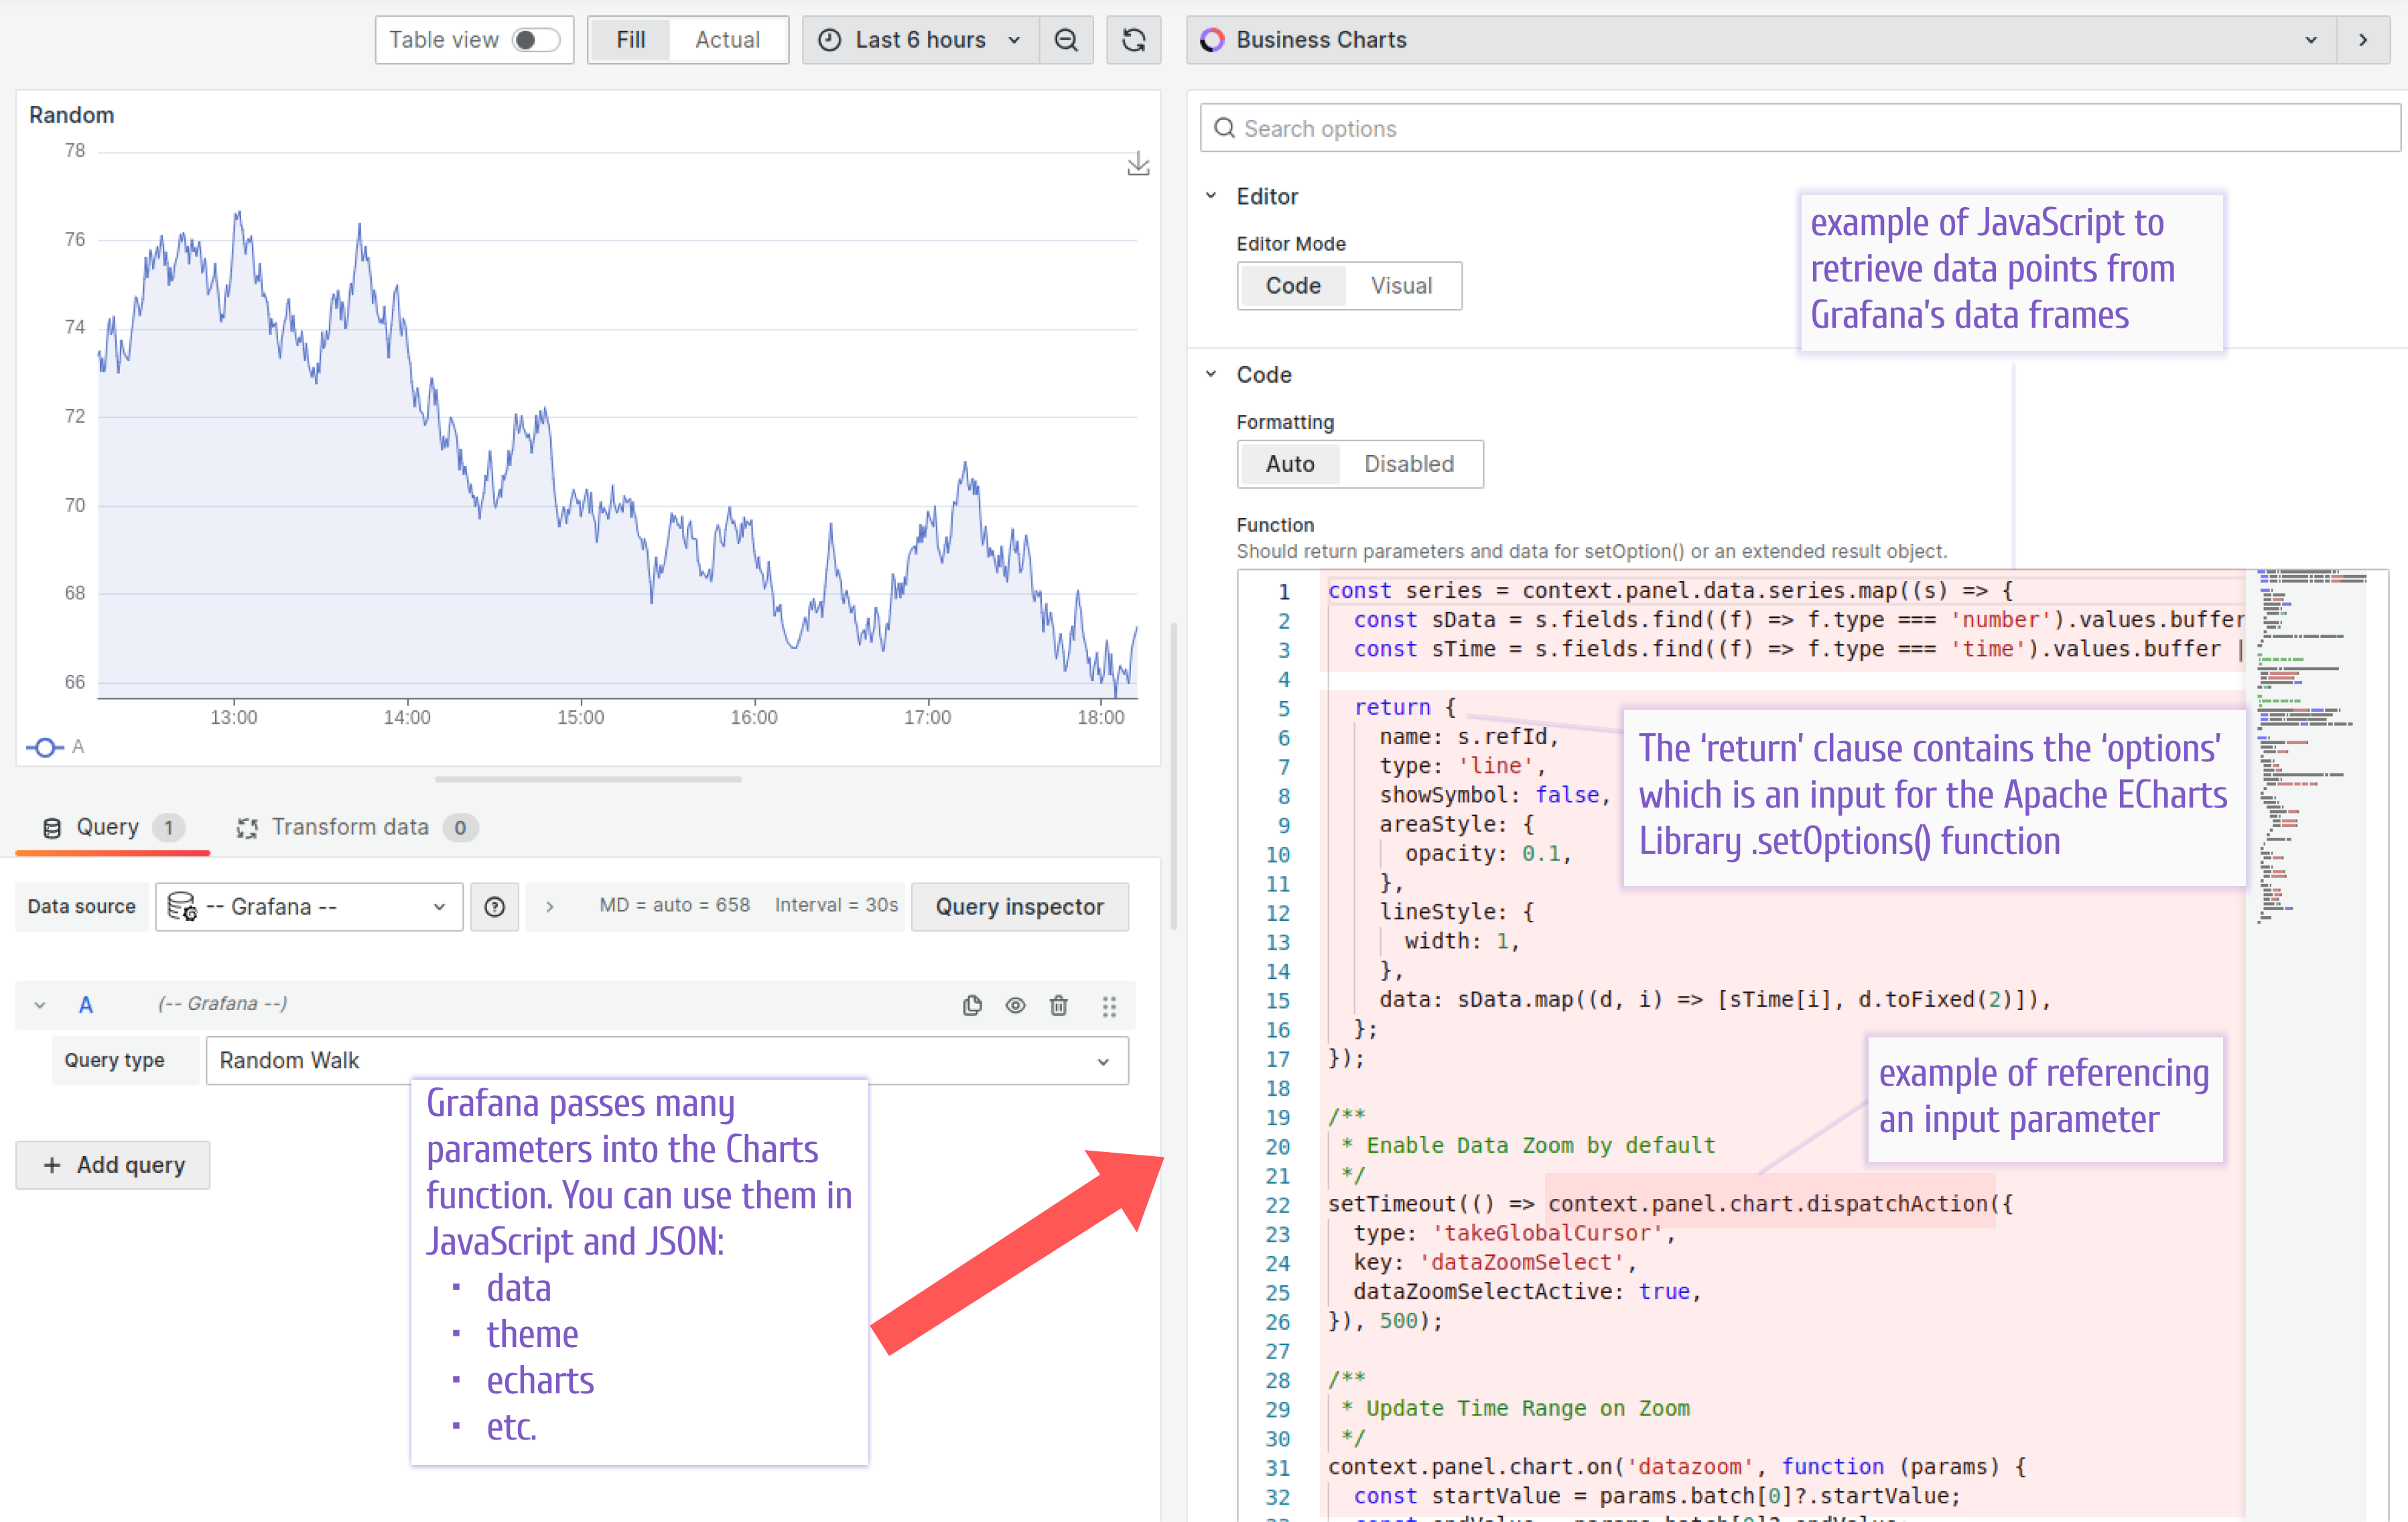
Both parts can use parameters passed into the Charts function. You can find the complete list of parameters in the table below.
See the schema and the print screen below for illustration.
Options
The return clause is where you need to specify the options parameter to be passed into the setOption(options) Apache ECharts library function.
Parameters
| Parameter | Description |
|---|---|
context.echarts | Apache ECharts library. |
context.ecStat | A statistical and data mining tool for Apache ECharts. |
context.editor.dataset | [Visual mode] ECharts dataset. |
context.editor.series | [Visual mode] ECharts series. |
context.grafana.eventBus | Publish and subscribe to application events. |
context.grafana.locationService | Works with browser location and history. |
context.grafana.notifyError(['Header', 'Error Message']) | Display error notifications. |
context.grafana.notifySuccess(['Header', 'Message']) | Display success notifications. |
context.grafana.refresh() | Function to refresh dashboard panels using application events. |
context.grafana.replaceVariables() | Function to interpolate variables. |
context.grafana.theme | Theme object. |
context.panel.chart | Instance of the Apache ECharts library. See the example in the screenshot above. |
context.panel.data | Object containing a time range, series, and request information. |
Inspect
To inspect those parameters, use the browser's developer console.
console.log(
  context.panel.data,
  context.grafana.theme,
  context.panel.chart,
  context.echarts,
  context.grafana.replaceVariables,
  context.grafana.locationService
);
Notifications
You can display success and error notifications when handling specific events.
context.grafana.notifySuccess(["Update", "Values updated successfully."]);
context.grafana.notifyError([
  "Update",
  `An error occurred while updating values.`,
]);