AI Observability: Revolutionizing Business Alerting in BI Platform


At Volkov Labs, we’re committed to pushing the boundaries of Business Intelligence (BI) by integrating innovative technologies that deliver actionable insights and unparalleled user experiences. Our latest breakthrough—AI Observability—redefines how businesses handle critical alerts within our BI platform.
By leveraging cutting-edge AI models such as Grok 4 from xAI and Anthropic Claude, we’ve transformed Business Alerting into a dynamic, context-aware system. This enables intelligent notifications across email, Slack, and Grafana Incident workflows. In this blog post, we’ll explore how AI Observability enhances alerting, enabling teams to respond faster and more effectively to critical issues.
AI Observability will be available in the upcoming BI 3.7.0 release.
The Challenge: Static Alerts in a Fast-Moving World
Traditional alerting systems often depend on static templates and predefined thresholds. While these systems serve a basic purpose, they lack the flexibility and depth needed in today’s dynamic business landscape. Alerts frequently provide minimal context, leaving teams to manually investigate issues. This not only wastes valuable time but also risks delayed responses or missed opportunities.
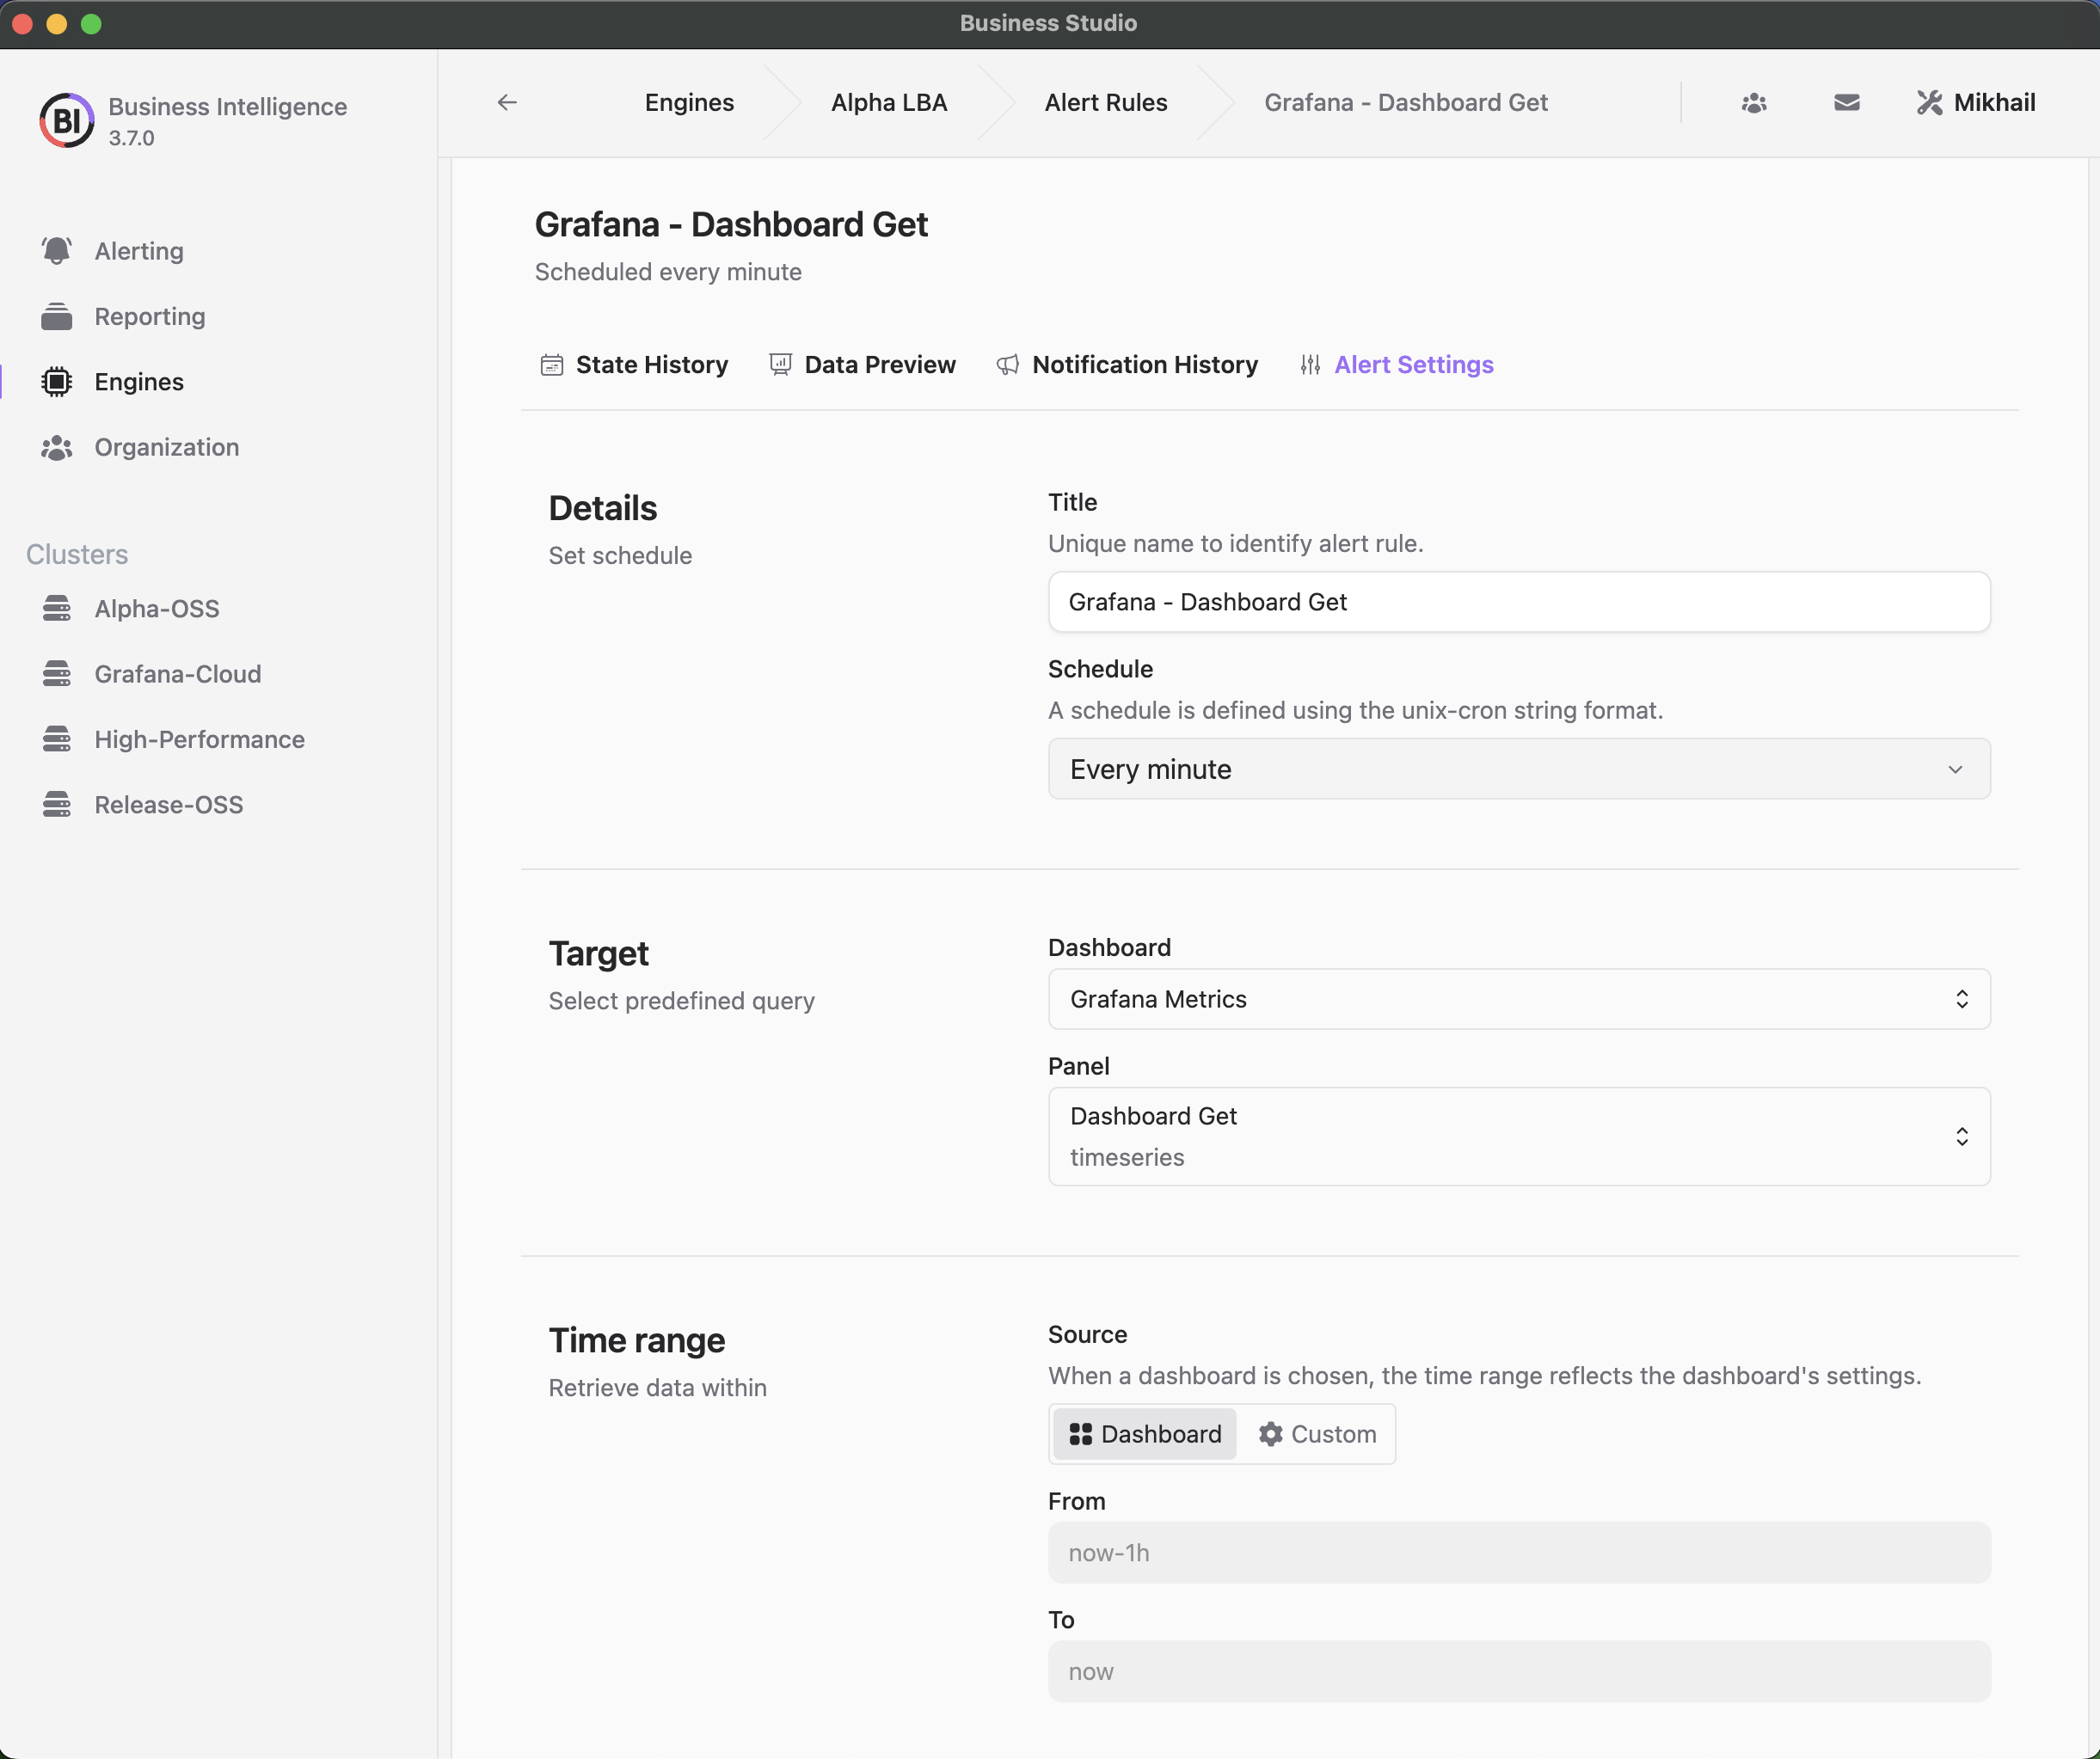
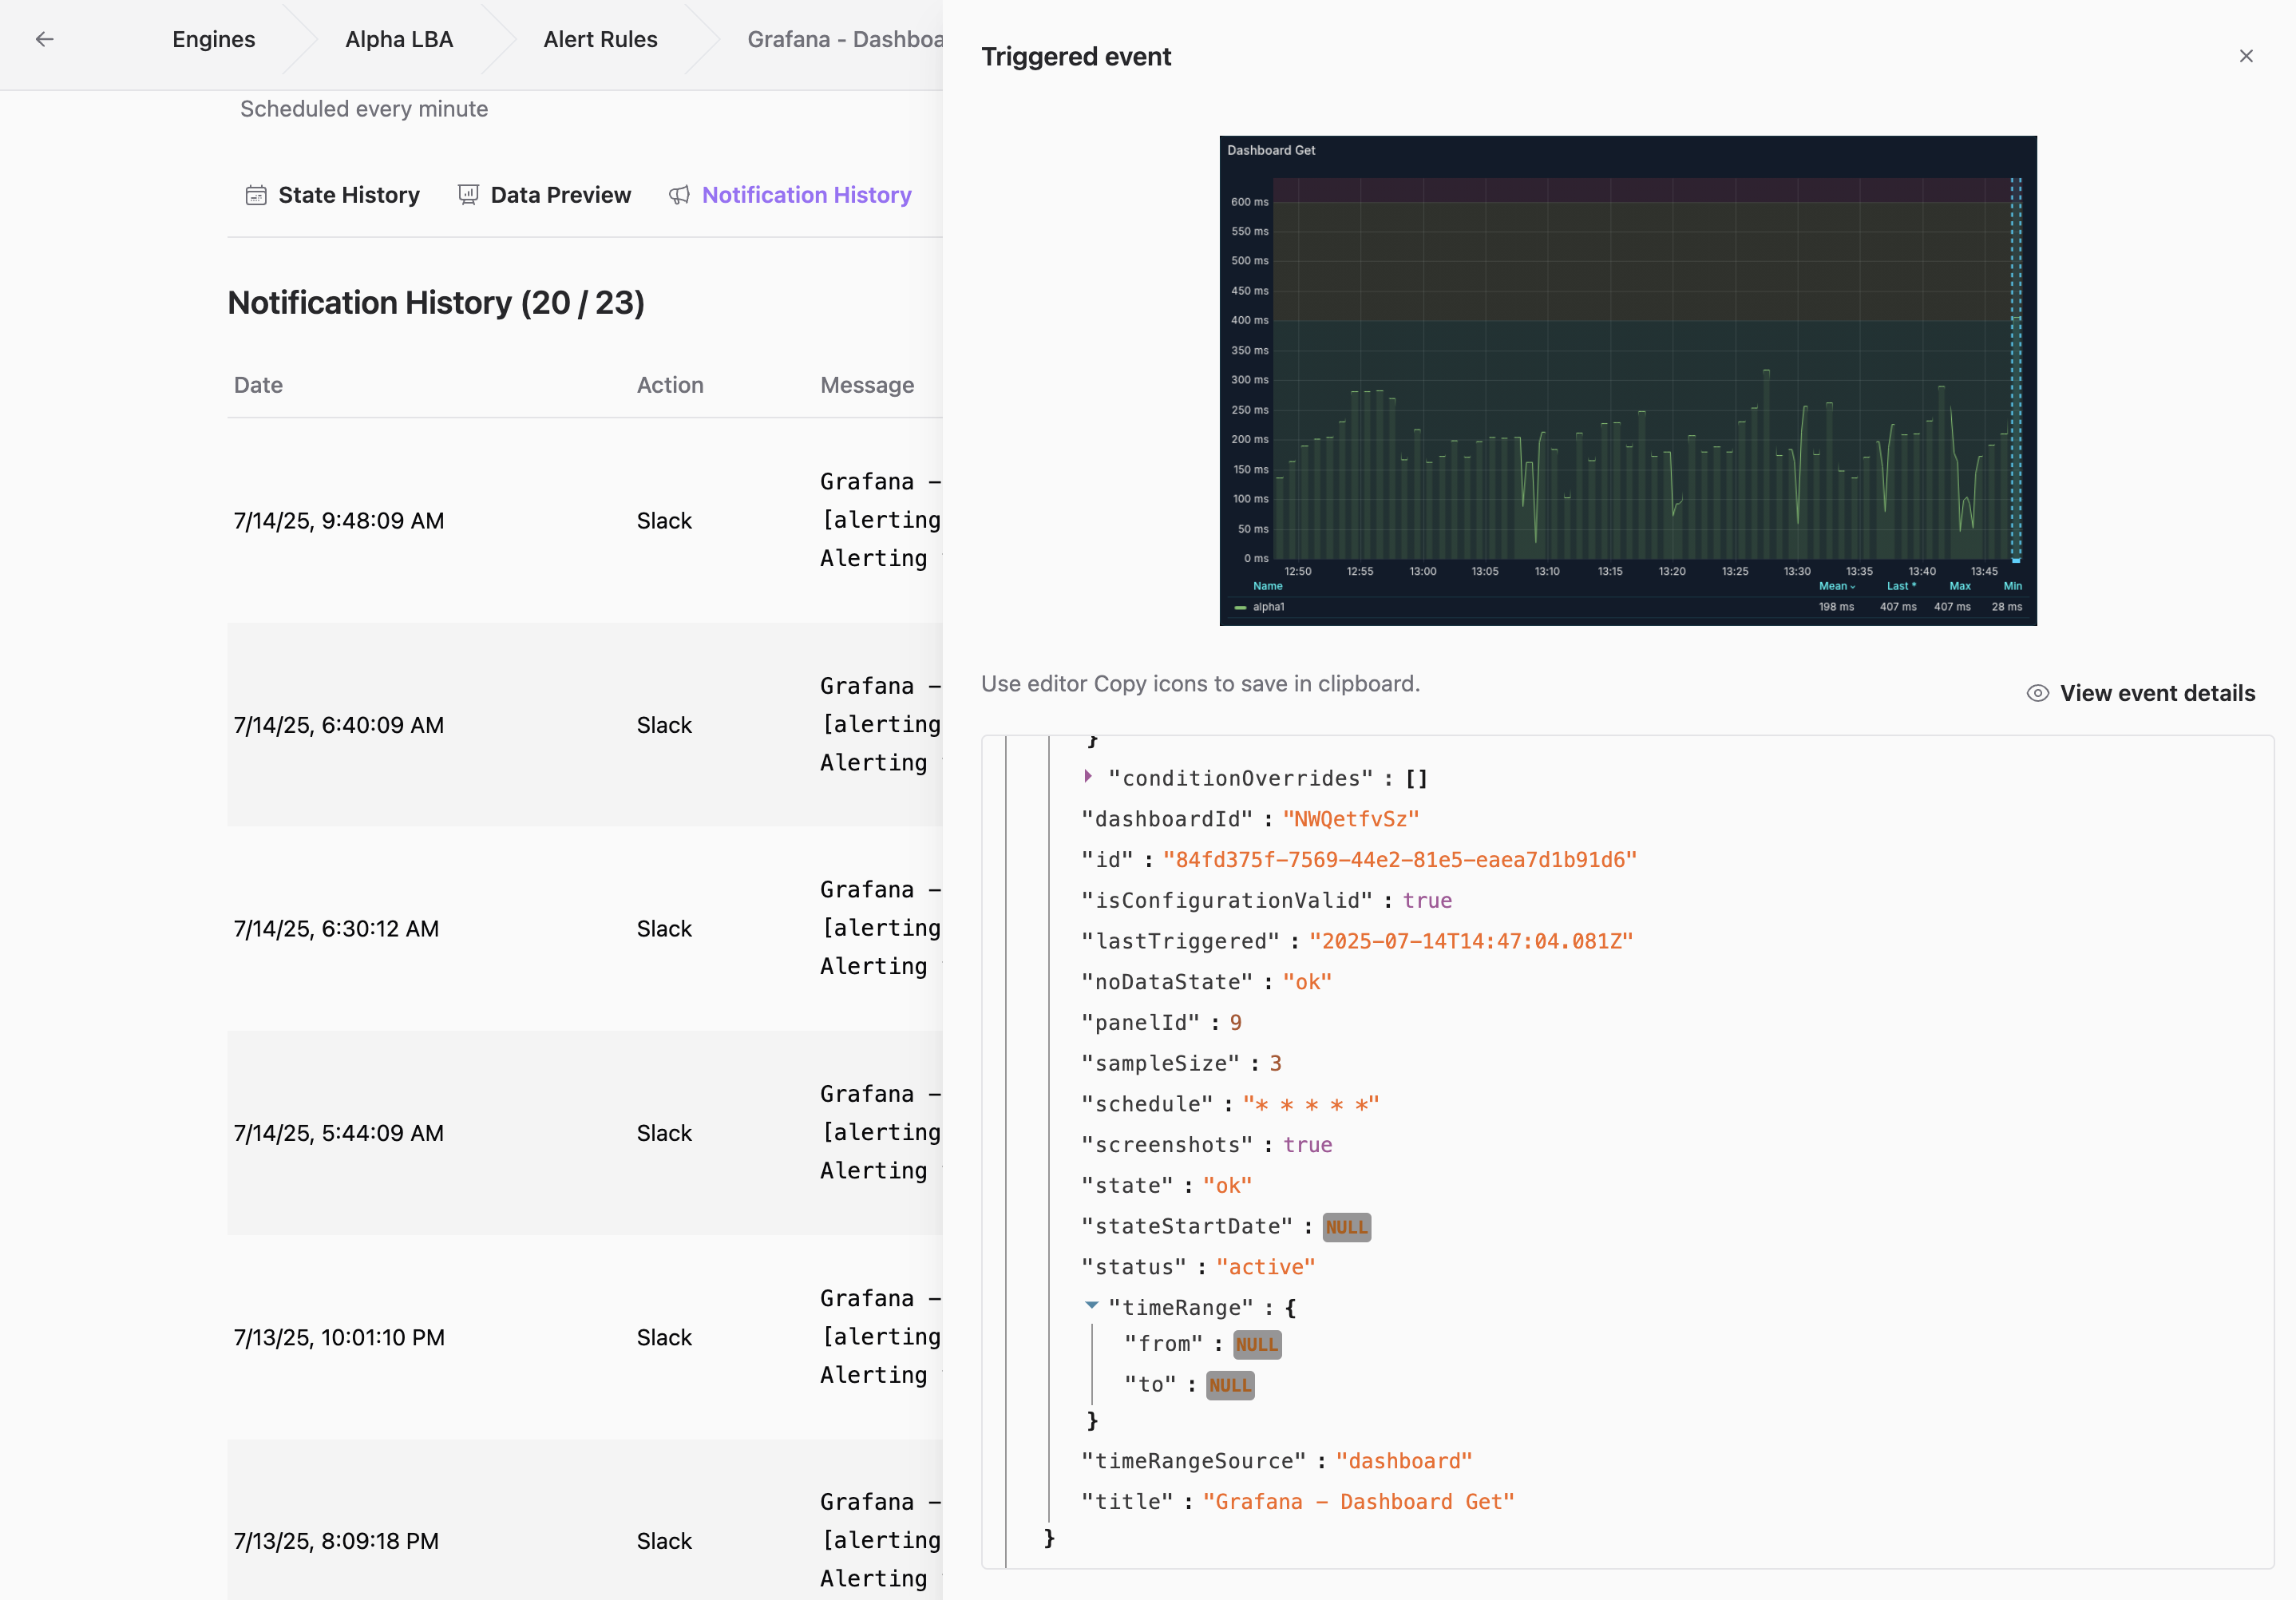
For instance, consider a performance alert for a Grafana dashboard metric like Grafana - Dashboard Get on an instance named alpha1. A typical alert might simply state, "Response time exceeds 400 ms on alpha1." While this indicates a problem, it offers no insight into the severity, potential impact, or next steps, forcing teams to dig deeper on their own.
The Solution: AI-Driven Observability for Contextual Alerts
With AI Observability, we’ve integrated advanced AI models like Grok 4 from xAI and Anthropic Claude to dynamically analyze alert data and generate detailed, actionable notifications. These go beyond simple alerts—they deliver context, assess implications, and provide tailored recommendations. This approach accelerates decision-making, reduces alert fatigue, and enhances system reliability.
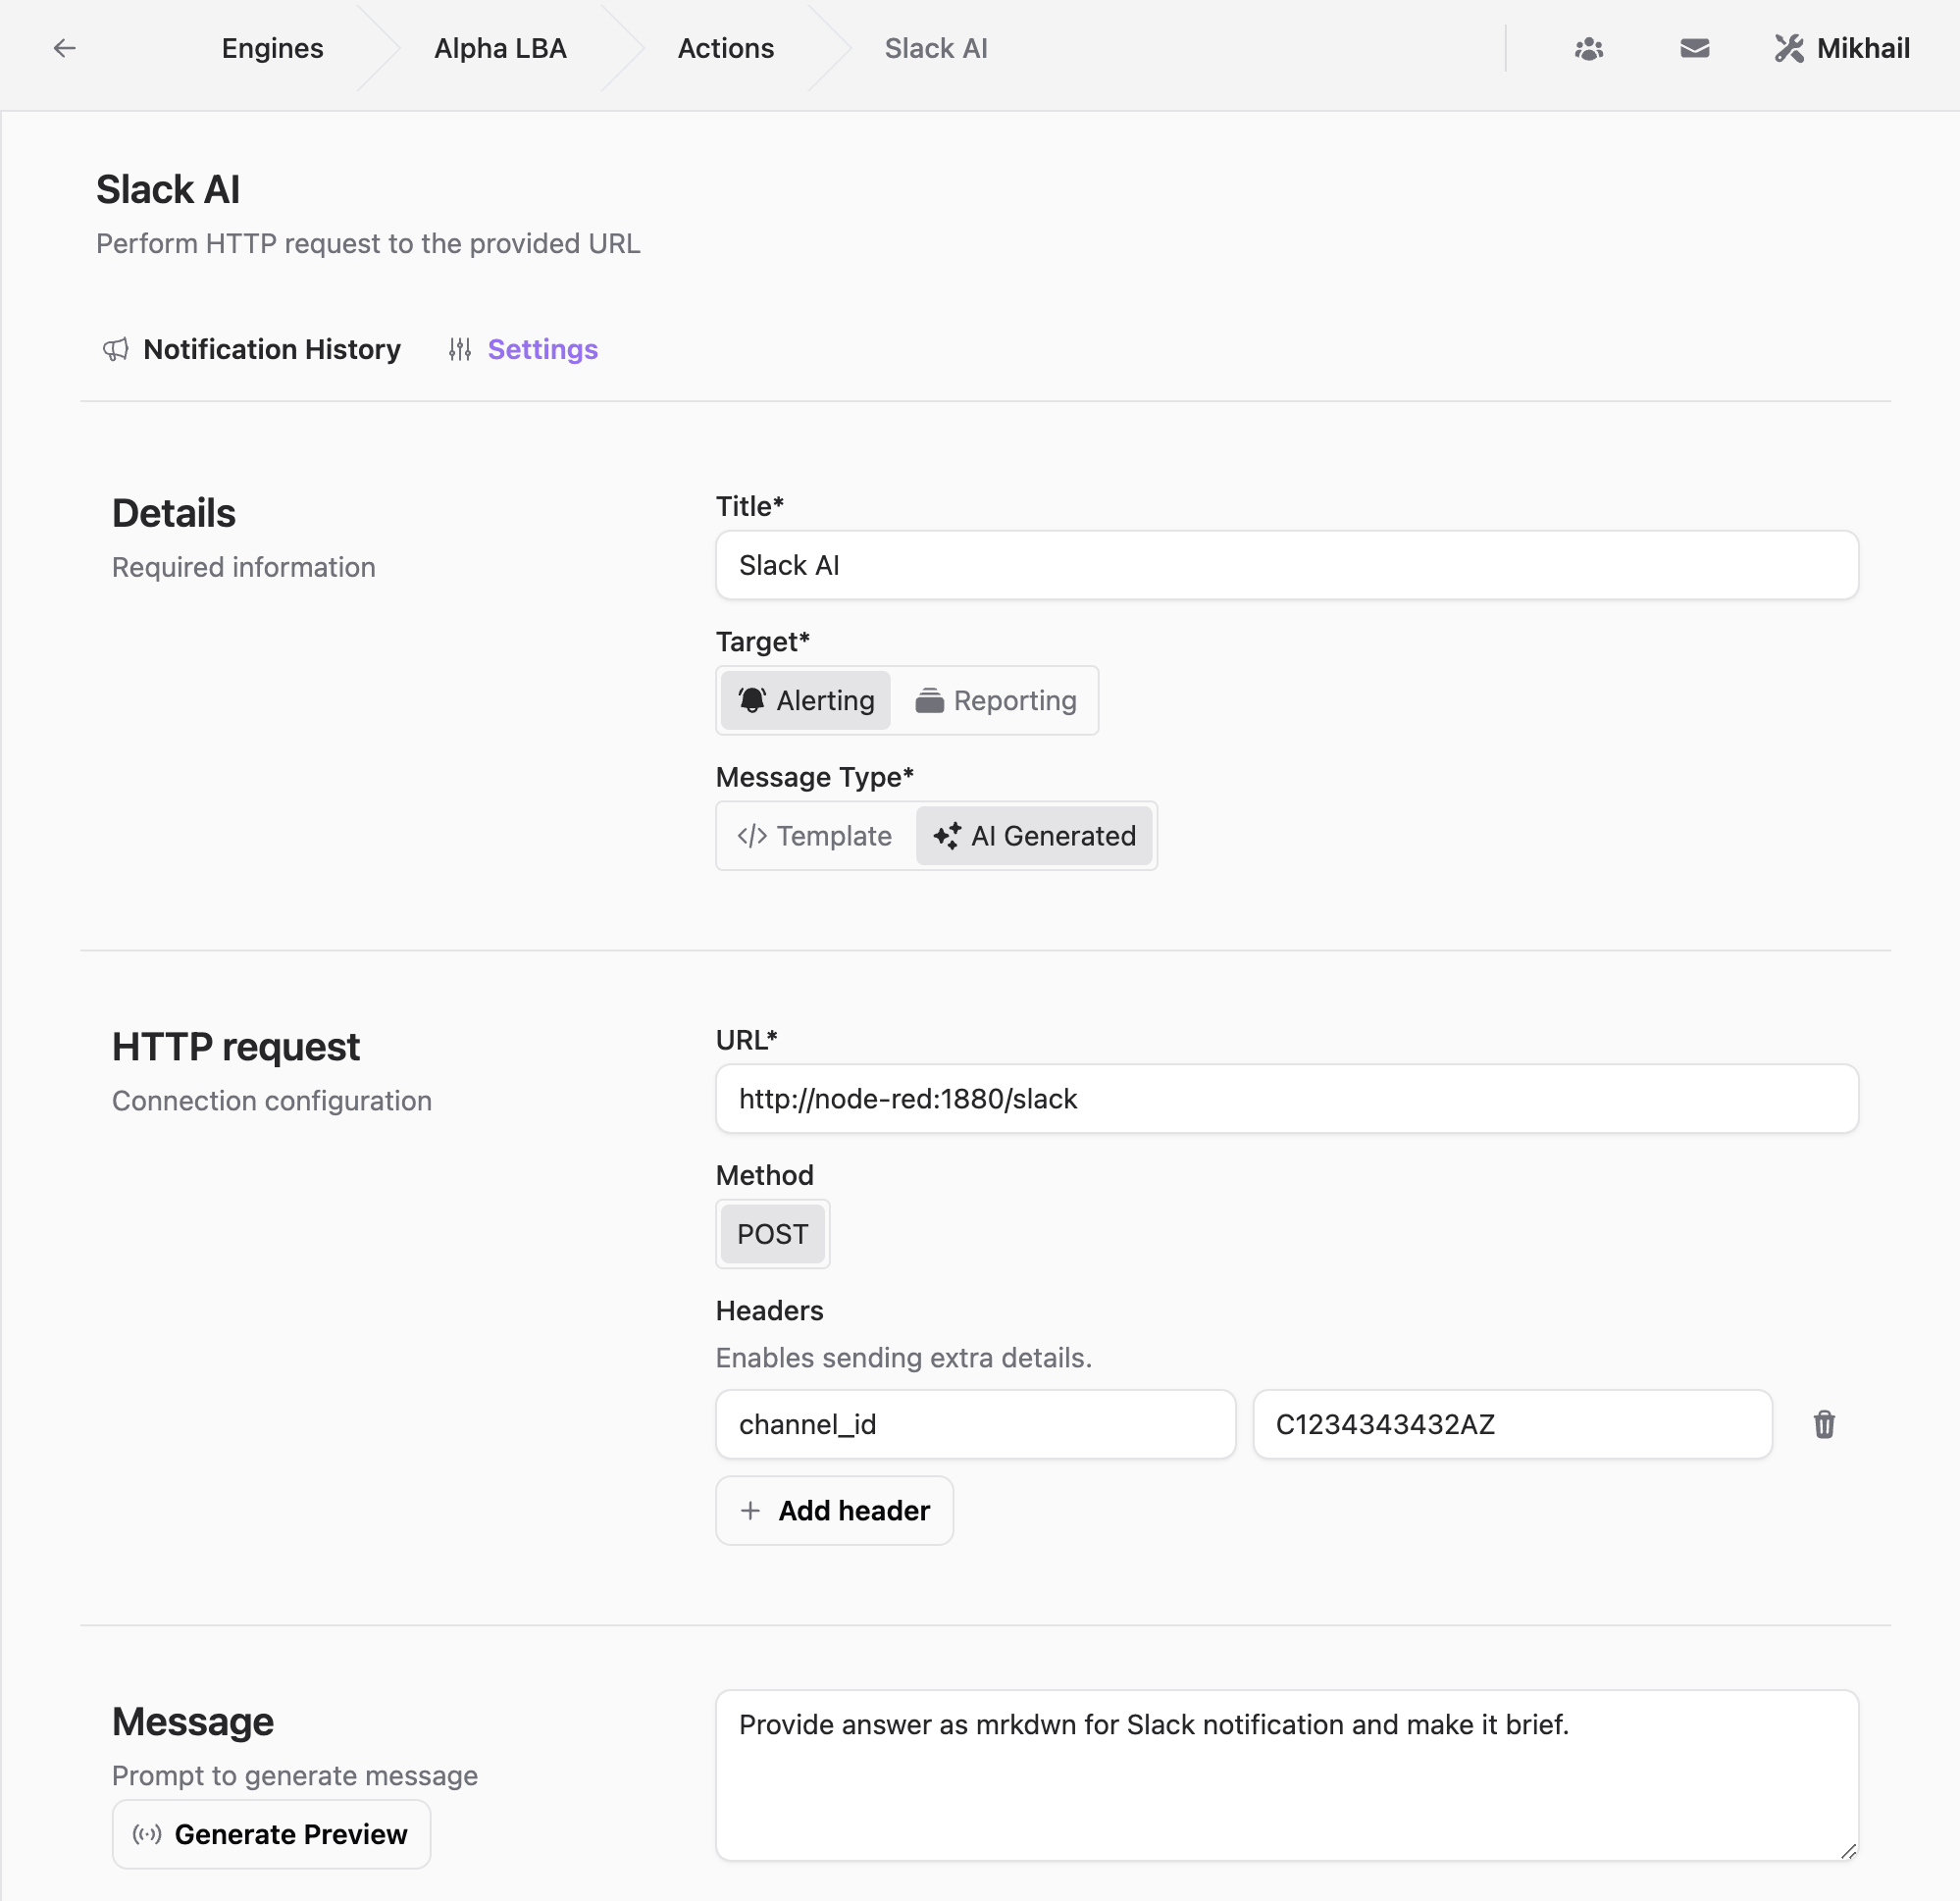
Our platform supports webhook-driven actions for both code and no-code workflows using tools like Node-RED and n8n. Let’s see this innovation in action with a real-world example.
Case Study: Grafana Dashboard Performance Alert
Imagine a performance metric for the "Grafana - Dashboard Get" API on the "alpha1" instance triggers an alert. The response time is 406.75 ms, exceeding the warning threshold of 400 ms. In a traditional system, the alert might be a brief, vague message. With AI Observability, it transforms into a comprehensive, AI-generated report tailored to the specific event.
Here’s an example of the enhanced notification:
Subject: [Alert] Grafana Dashboard Performance Issue on alpha1
Alert Title: Grafana - Dashboard Get
Instance: alpha1 (Job: alpha-grafana-1)
Current State: Alerting (Triggered on 2025-07-14T13:55:03.862Z)
Issue: The average response time for dashboard GET API calls on instance "alpha1" is 406.75 ms, exceeding the warning threshold of 400 ms.
Details:
- Metric: Rate of total latency divided by request count over a 1-minute interval.
- Thresholds: Green (< 400 ms), Warning (≥ 400 ms), Critical (≥ 600 ms).
- Sampled Data: Consistent response time of 406.75 ms across recent intervals.
Potential Implications:
- Performance Degradation: Minor latency increases may slow dashboard loading, affecting user experience.
- User Impact: Persistent delays could frustrate users relying on real-time data.
- System Health: This may indicate resource constraints or inefficient dashboard queries.
- Risk of Escalation: Continued rise in response times could trigger a critical alert (≥ 600 ms).
Recommendations:
- Investigate "alpha1" performance metrics and logs for root causes (e.g., resource usage, network issues).
- Monitor trends to determine if latency persists or worsens.
- Optimize dashboard queries or scale resources if load is a contributing factor.
- Review the 400 ms warning threshold to ensure alignment with performance goals.
Action: Address the "alpha1" instance promptly to prevent escalation and maintain an optimal user experience.
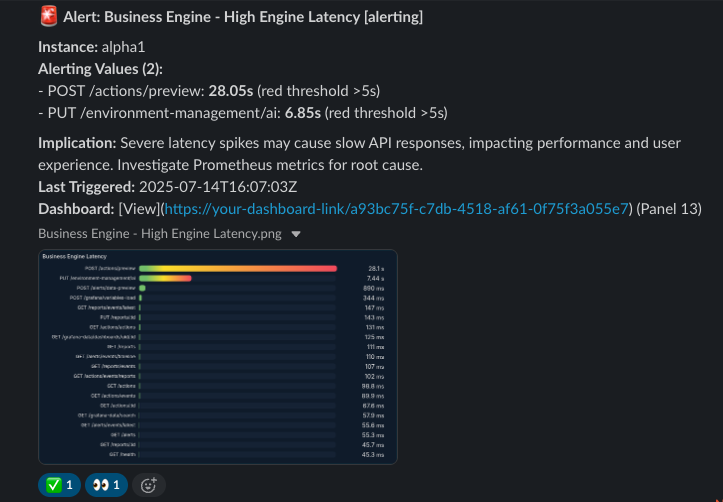
This AI-generated message can be delivered via email for detailed documentation, posted to a Slack channel for team collaboration, or integrated into a Grafana Incident workflow for structured resolution. The depth of insight and actionable guidance empower teams to respond with precision.
How AI Observability Enhances Our Platform
AI Observability within our Business Intelligence platform operates through a seamless, efficient process:
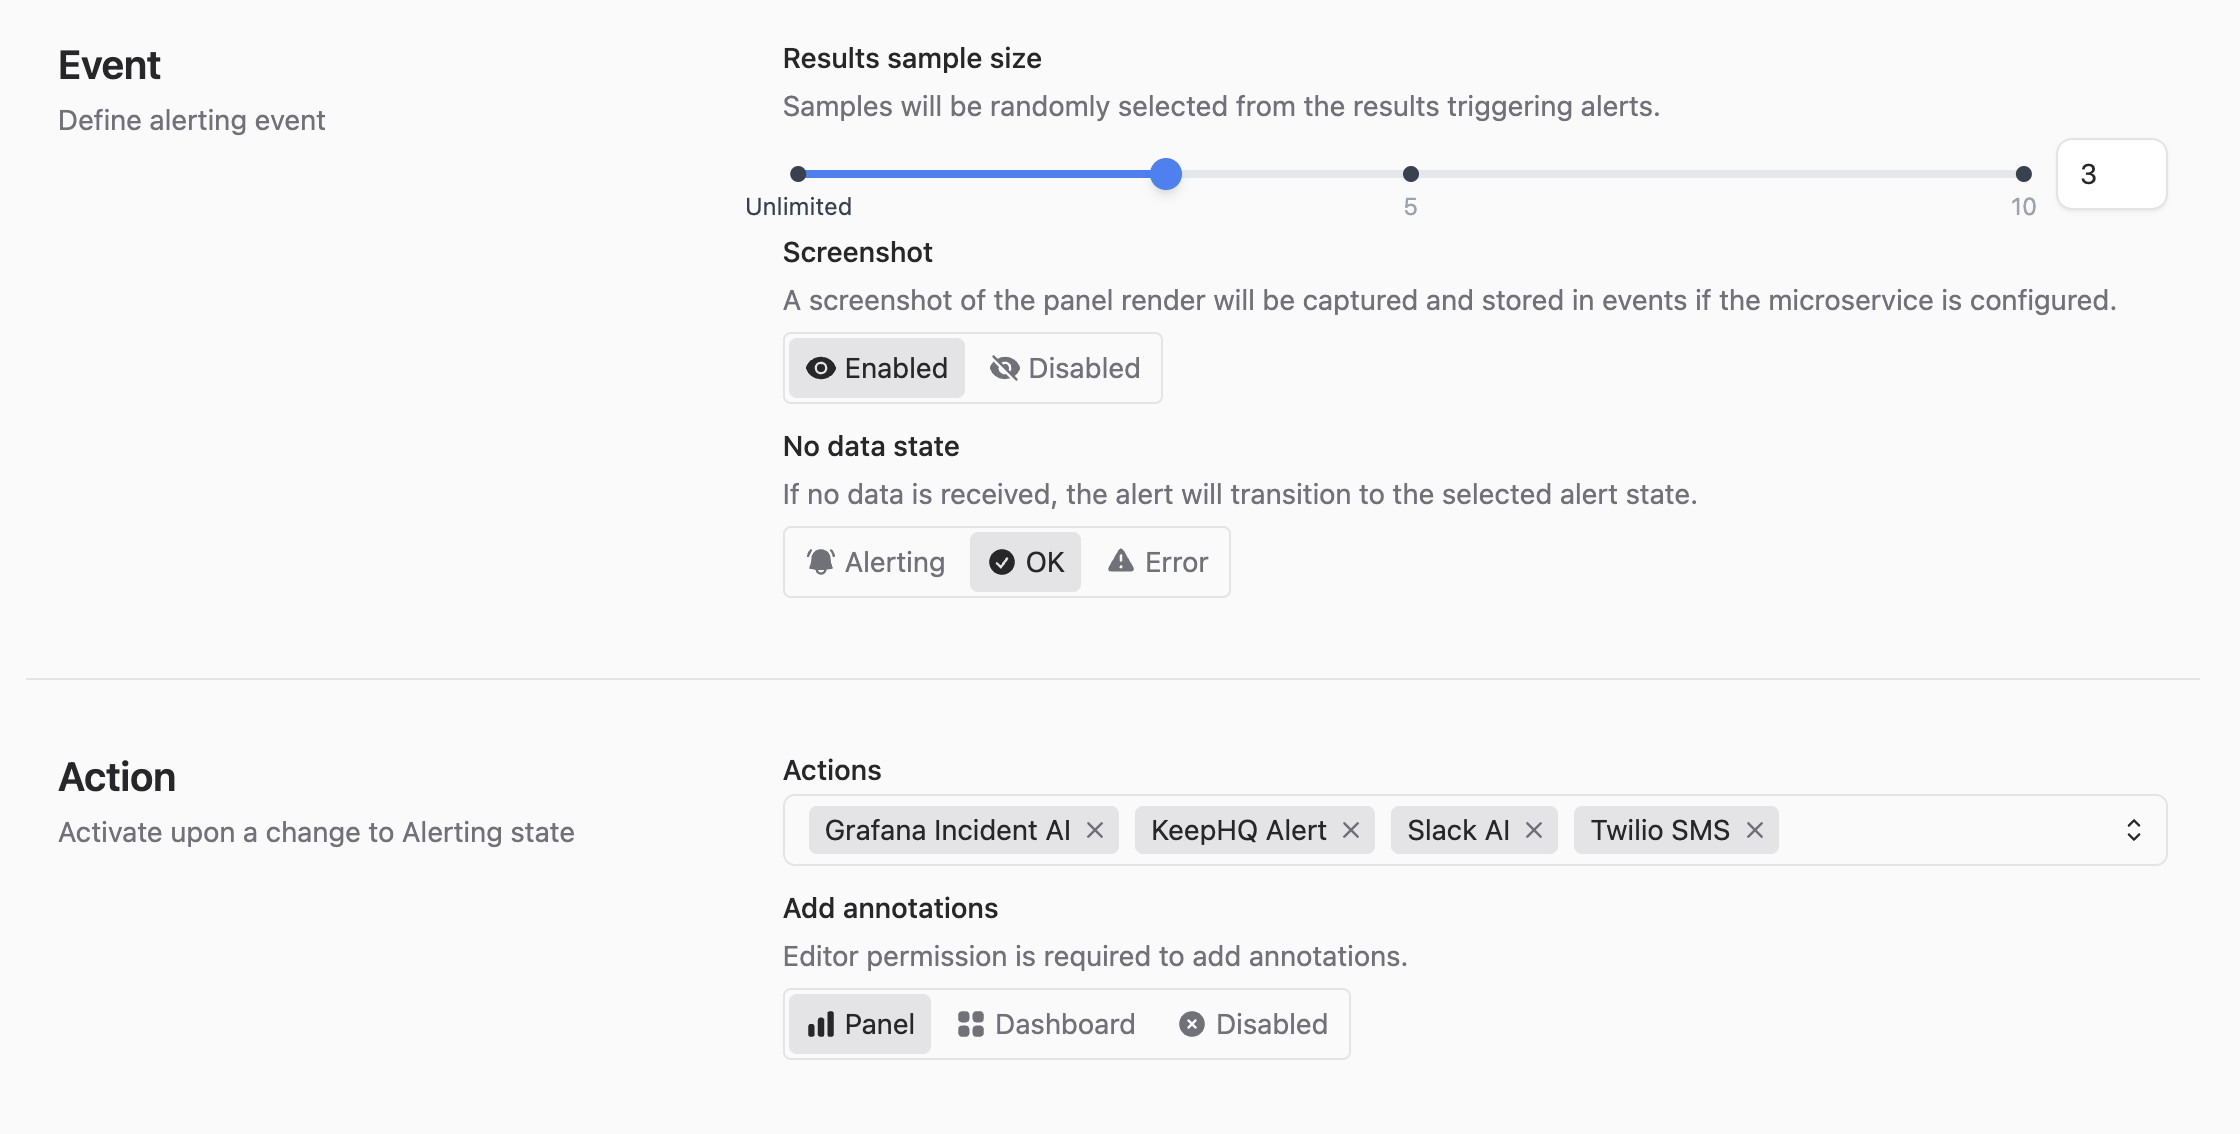
- Event Payload Capture: When an alert is triggered, the system gathers detailed data, including metrics, thresholds, timestamps, and dashboard variables.
- AI Analysis: Advanced models analyze the payload, identifying patterns, evaluating severity, and generating human-readable notifications with actionable insights.
- Dynamic Notification Creation: The AI crafts customized messages, adapting tone and format to the delivery channel while emphasizing critical details and recommendations.
- Multi-Channel Delivery: Notifications are distributed via email for formal updates, Slack for real-time collaboration, or Grafana Incident for incident management.
- Continuous Improvement: Teams can provide feedback on AI-generated messages, enabling ongoing refinement of the model’s accuracy and relevance.
Key Benefits of AI-Enhanced Alerting
Integrating AI Observability into our alerting system offers transformative benefits for businesses using the Business Intelligence platform:
- Contextual Depth: Alerts evolve from basic notifications into detailed reports, explaining the "why" and "what’s next" for every issue.
- Reduced Alert Fatigue: AI prioritizes actionable insights, filtering out noise so teams focus on critical issues without being overwhelmed.
- Faster Resolutions: Clear, actionable recommendations speed up decision-making, minimizing downtime and user impact.
- Seamless Integration: Notifications connect effortlessly across email, Slack, and Grafana Incident, aligning with existing team workflows.
- Scalable Performance: AI efficiently manages complex, high-volume alerting scenarios, supporting businesses of all sizes.
Looking Ahead: AI’s Growing Role in Business Intelligence
AI-powered alerting is just the beginning of a larger transformation in Business Intelligence at Volkov Labs. As AI technology evolves, we’re exploring predictive alerting to anticipate issues before they occur, automated remediation workflows, and personalized notifications tailored to user roles and preferences.
Our adoption of leading models like Grok 4 from xAI and Anthropic Claude underscores our dedication to delivering top-tier solutions. By combining AI-driven insights with Grafana’s robust visualization and monitoring capabilities, we’re enabling businesses to proactively address challenges and optimize performance.
Ready to revolutionize your alerting with AI? Get started with our Business Intelligence platform today using our Quick Start Guide.
Getting Started
Business Intelligence Platform is a powerful solution that harnesses Docker containers to deliver a modular, scalable, and user-friendly environment for alert-driven analytics. Whether you're just starting out or are an experienced user, our Quick Start Guide is designed to help you set up and deploy the platform effortlessly.
This guide provides a step-by-step walkthrough of the essential setup process, ensuring you can get up and running in no time. Key topics include:
- Configuring the Business Engine: Understand how to set up the core component that powers your analytics.
- Launching the Business Studio: Deploy and access the intuitive interface on your local machine for seamless management and visualization.
We’d Love to Hear From You!
Your feedback and ideas are invaluable to us! Here’s how you can get involved:
- Questions, Feature Requests, or Bugs: Submit a Zendesk ticket to receive a swift and personalized response from our dedicated support team.
- Join the Community: Subscribe to our YouTube Channel and share your thoughts or suggestions in the comments.
Your input is crucial in helping us grow and improve, so please don’t hesitate to reach out!