Mastering Business Alerting: Harnessing Dashboard Variables in Grafana for BI


In today’s fast-paced business environment, data isn’t just power—it’s the foundation of every critical decision. Real-time insights and rapid responses can define success or missed opportunities. While Grafana is widely recognized for observability and analytics, it’s also a powerful Business Intelligence (BI) tool—especially when you leverage its underutilized feature: dashboard variables.
When combined with Business Alerting from the Business Intelligence platform, dashboard variables transform static visualizations into dynamic, actionable tools. In this post, we’ll explore how to use dashboard variables for business alerting in Grafana and why this approach can revolutionize your BI strategy.
What Are Dashboard Variables?
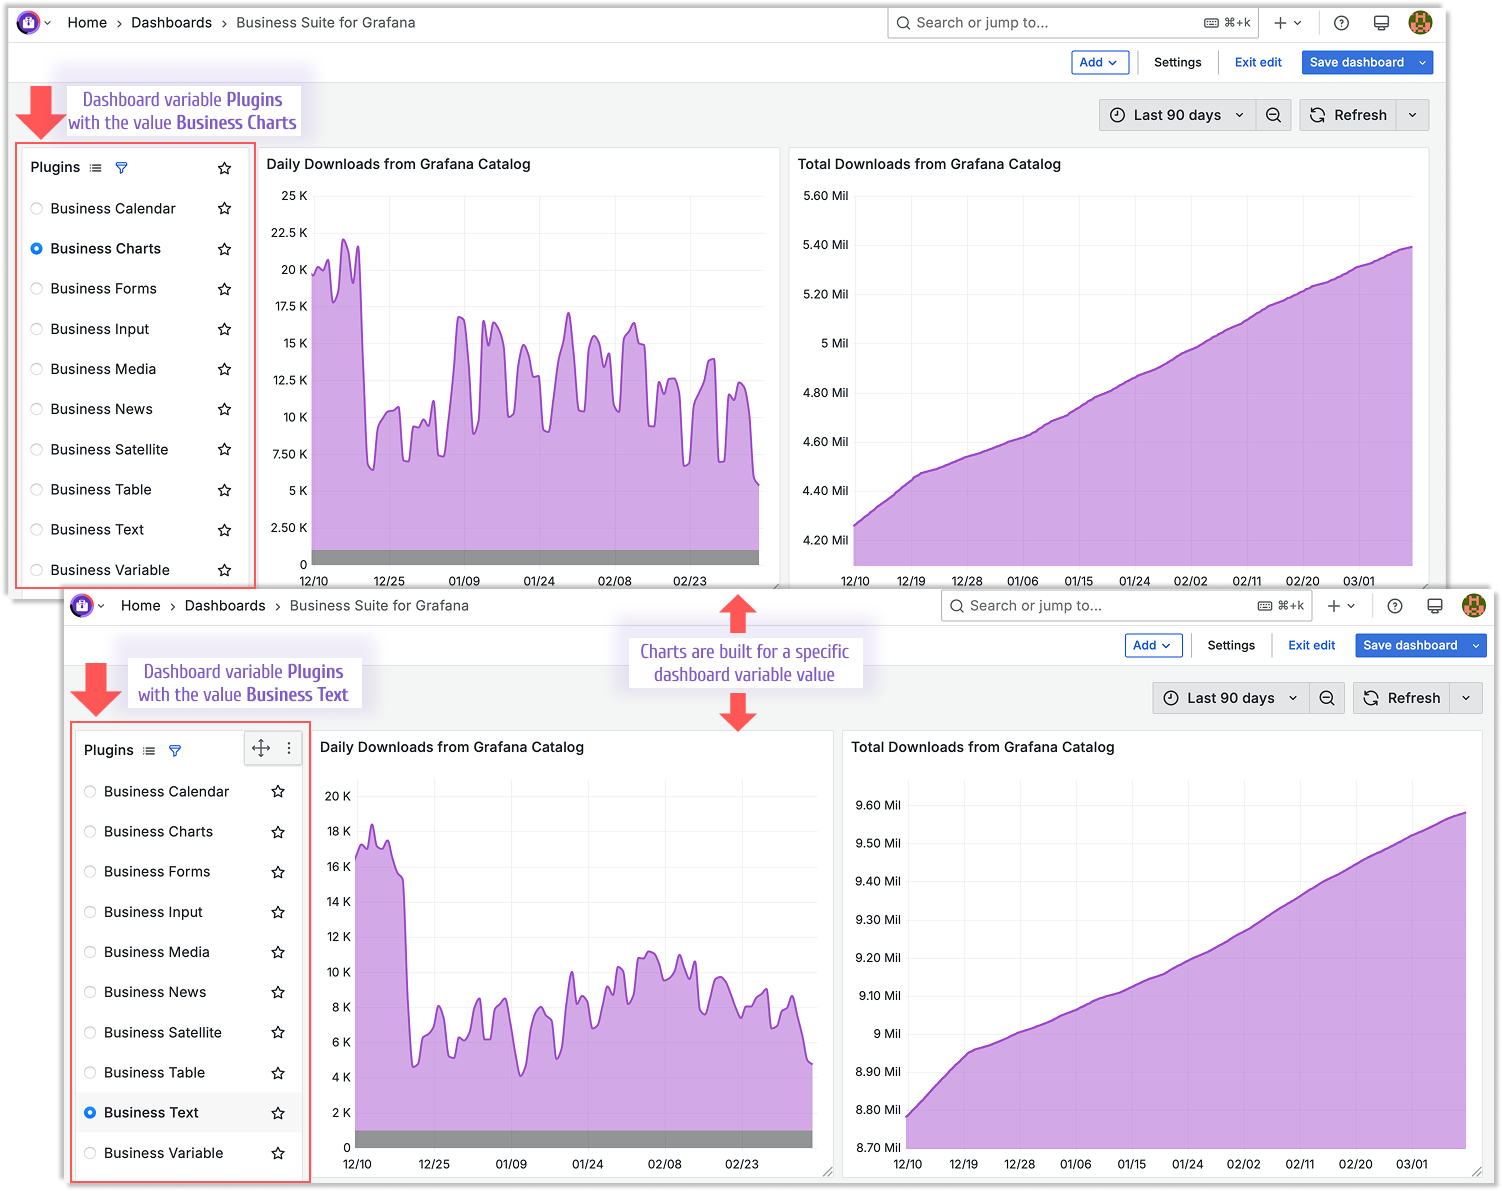
Dashboard variables in Grafana are dynamic placeholders that allow users to customize what a dashboard displays without hardcoding specific scenarios. Think of them as interactive filters or toggles—often presented as dropdown menus or query-driven inputs—that adjust the data scope, such as regions, timeframes, or product categories. With variables, a single dashboard can adapt to multiple use cases, updating in real time based on user selections.
For example, consider a retail chain monitoring sales performance. Instead of creating separate dashboards for each store, a variable like $location enables users to select “New York,” “London,” or “Tokyo” from a dropdown. The dashboard instantly updates to display location-specific metrics—such as revenue, foot traffic, or inventory levels.
Why Variables Supercharge Business Alerting
While dashboard variables enhance interactivity, their true potential shines when paired with Business Alerting. Alerts notify you when predefined conditions are met—such as a drop in website uptime or a spike in order delays. By integrating variables into alert rules, you unlock several key benefits:
- Scalability: Monitor hundreds of entities (e.g., stores, servers, or campaigns) with a single alert rule, eliminating repetitive setup.
- Precision: Focus alerts on critical contexts, such as high-priority regions or products, by leveraging variable-driven filters.
- Clarity: Deliver tailored notifications to the right teams, cutting through irrelevant noise and ensuring actionable insights.
This combination transforms Grafana from a mere visualization tool into a proactive BI engine, empowering your business to stay ahead of issues before they escalate.
How to Set Up Variables for Business Alerting
Let’s dive into a practical example: monitoring order fulfillment rates across multiple warehouses using variables and alerts in Grafana.
1. Create a Dashboard Variable
- Go to “Dashboard Settings” > “Variables” in your Grafana instance.
- Add a new variable named
$warehouse. Set its type to “Query” and connect it to your data source (e.g., MySQL, Prometheus). - Define a query like
SELECT DISTINCT warehouse_name FROM orders_table. Enable “Multi-value” and “Include All” options for maximum flexibility. - Save and verify that the variable appears as a dropdown on your dashboard.
2. Build a Dynamic Dashboard Panel
- Create a panel to visualize fulfillment rates using a query such as
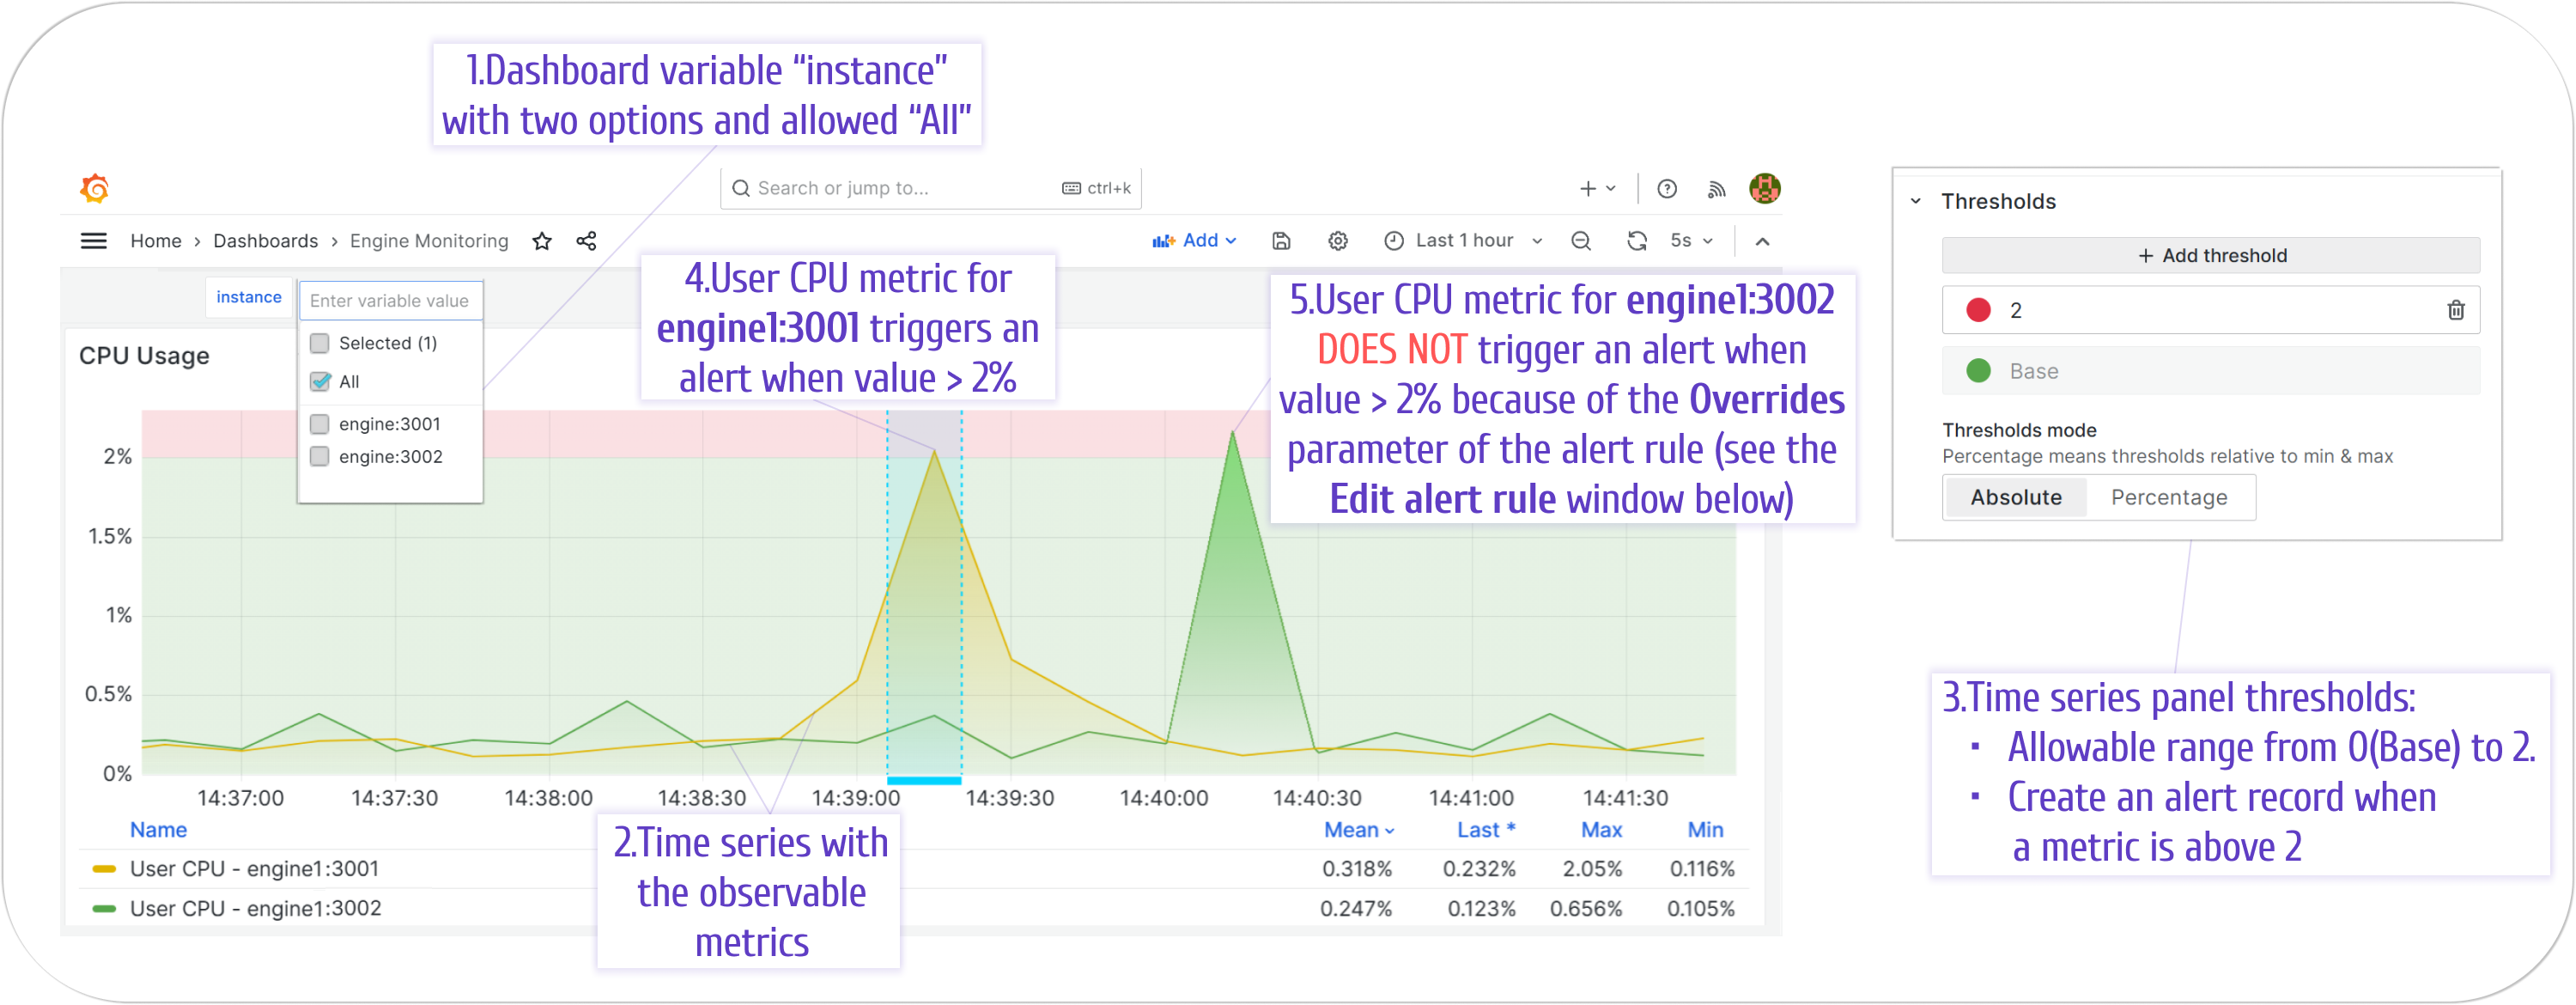
SELECT fulfillment_rate FROM orders WHERE warehouse = '$warehouse'. - Set visual thresholds (e.g., alert if the rate falls below 90%) to highlight potential issues.
- Test the setup by switching
$warehousevalues in the dropdown and confirming that the panel updates dynamically.
3. Configure a Business Alert
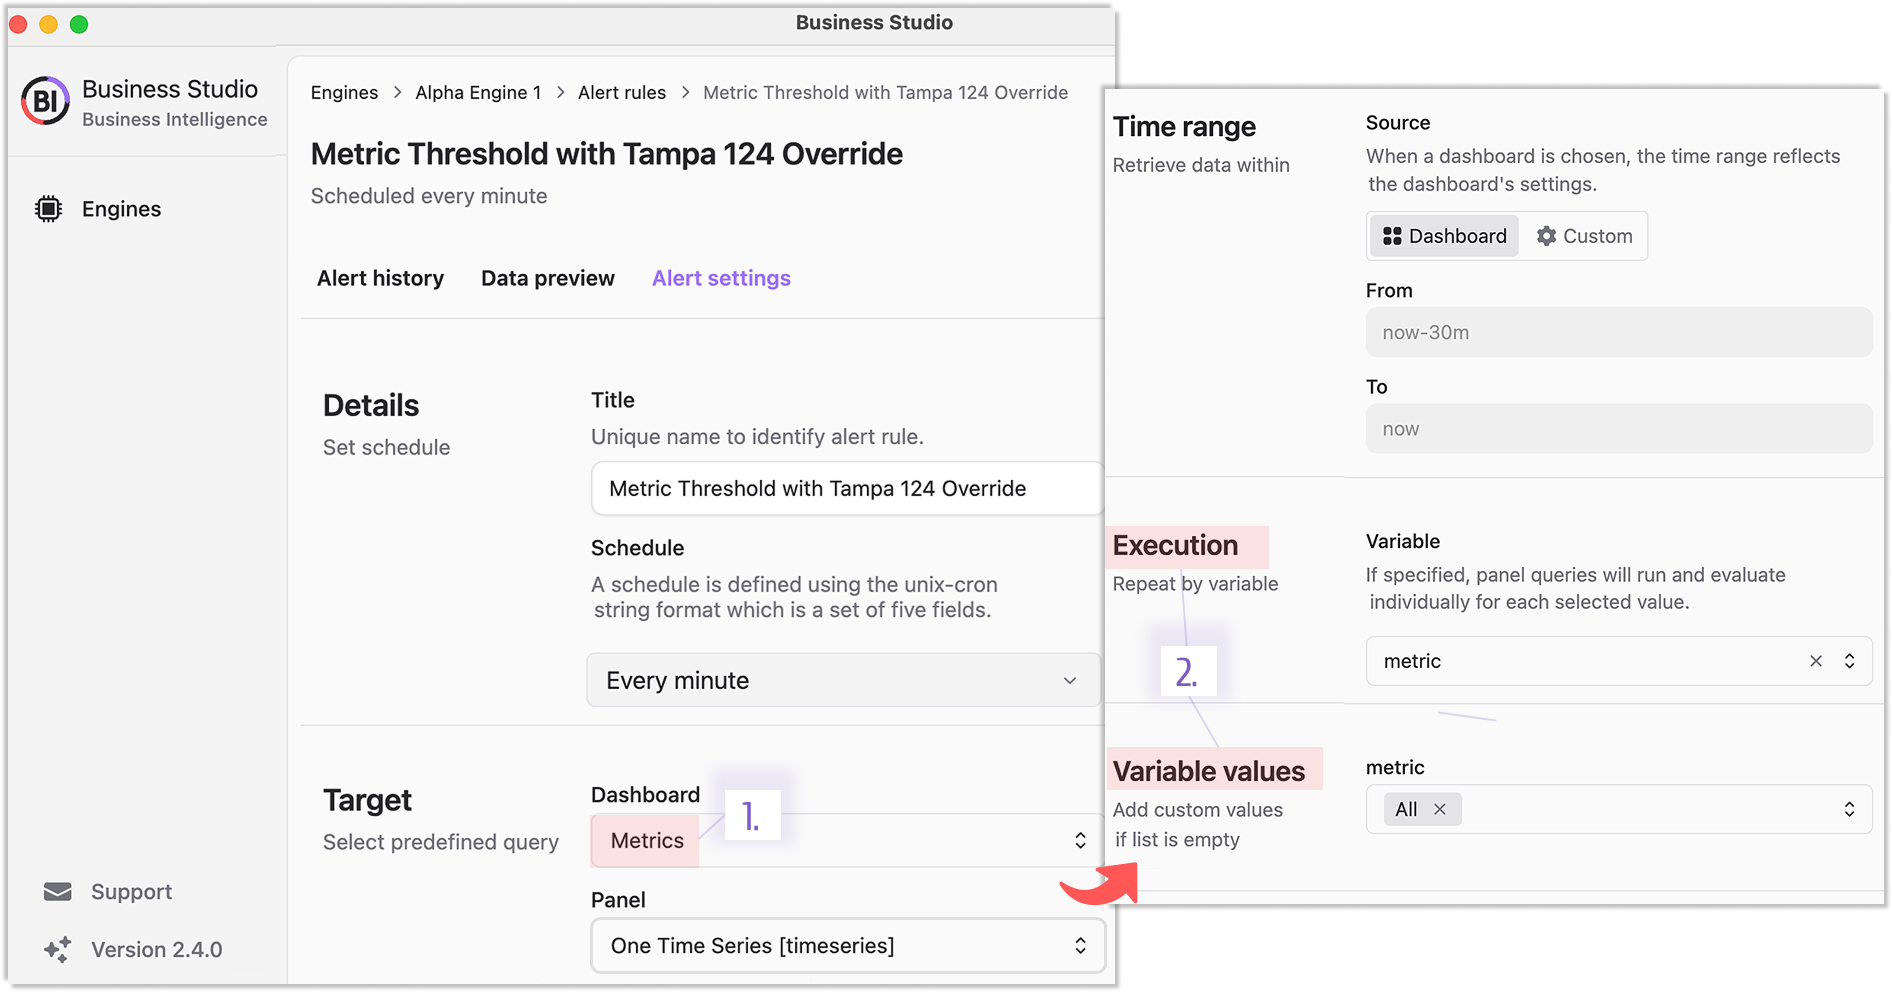
- Navigate to Business Studio in your BI platform.
- Select a Business Engine, go to “Alert Rules,” and click “Add Alert Rule.”
- Link the rule to your dashboard and panel, incorporating the
$warehousevariable and defining thresholds for triggering alerts. - Specify actions—such as sending notifications via Slack or email—when conditions are met.
4. Test and Optimize
- Simulate a fulfillment rate drop (or use historical data) to ensure the alert triggers as expected.
- Refine your setup by adding more variables (e.g.,
$timeframe) or adjusting thresholds to balance sensitivity and relevance.
Real-World Use Cases for BI Alerting with Variables
The flexibility of dashboard variables and alerting makes them applicable across diverse industries:
- E-commerce: Trigger alerts on order delays filtered by
$regionwhen processing times exceed acceptable limits. - IT Operations: Notify system admins if CPU usage for a specific
$clustersurpasses safe thresholds. - Marketing: Flag underperforming ad campaigns by
$campaign_idfor immediate optimization.
By tailoring dashboards and alerts with variables, you can address your organization’s unique challenges without building countless static tools.
Why Grafana Is a BI Powerhouse
Grafana isn’t just for DevOps or IT monitoring—it’s a versatile platform for Business Intelligence. Its scalability (available in both cloud and self-hosted options) and seamless integration with diverse data sources (SQL, Prometheus, and more) make it ideal for complex business operations. Dashboard variables amplify this capability, enabling you to ask critical questions and get answers without manual rework.
Transform Your BI Strategy Today
Mastering Business Alerting with dashboard variables isn’t just about staying informed—it’s about staying ahead. By combining dynamic dashboards with intelligent alerts, you shift from reactive reporting to proactive decision-making, giving your business a competitive edge.
Ready to elevate your BI game? Start experimenting with dashboard variables in Grafana today and watch your Business Intelligence strategy evolve into a powerful driver of success.
We’d Love to Hear From You!
Your feedback and ideas are invaluable to us! Here’s how you can get involved:
- Questions, Feature Requests, or Bugs: Submit a Zendesk ticket to receive a swift and personalized response from our dedicated support team.
- Join the Community: Subscribe to our YouTube Channel and share your thoughts or suggestions in the comments.
Your input is crucial in helping us grow and improve, so please don’t hesitate to reach out!