Mastering Business Alerting: Leveraging Dashboard Variables in Grafana for BI


In today’s fast-paced business landscape, data is more than power—it’s the heartbeat of decision-making. Real-time insights and swift action can make or break opportunities. Grafana, renowned for observability and analytics, doubles as a potent Business Intelligence (BI) tool—especially when you tap into its often-underutilized feature: dashboard variables.
Paired with Business Alerting from the Business Intelligence platform, these variables turn static dashboards into dynamic, actionable tools. This post shows you how to harness dashboard variables for business alerting in Grafana—and why it’s a game-changer for your BI strategy.
What Are Dashboard Variables?
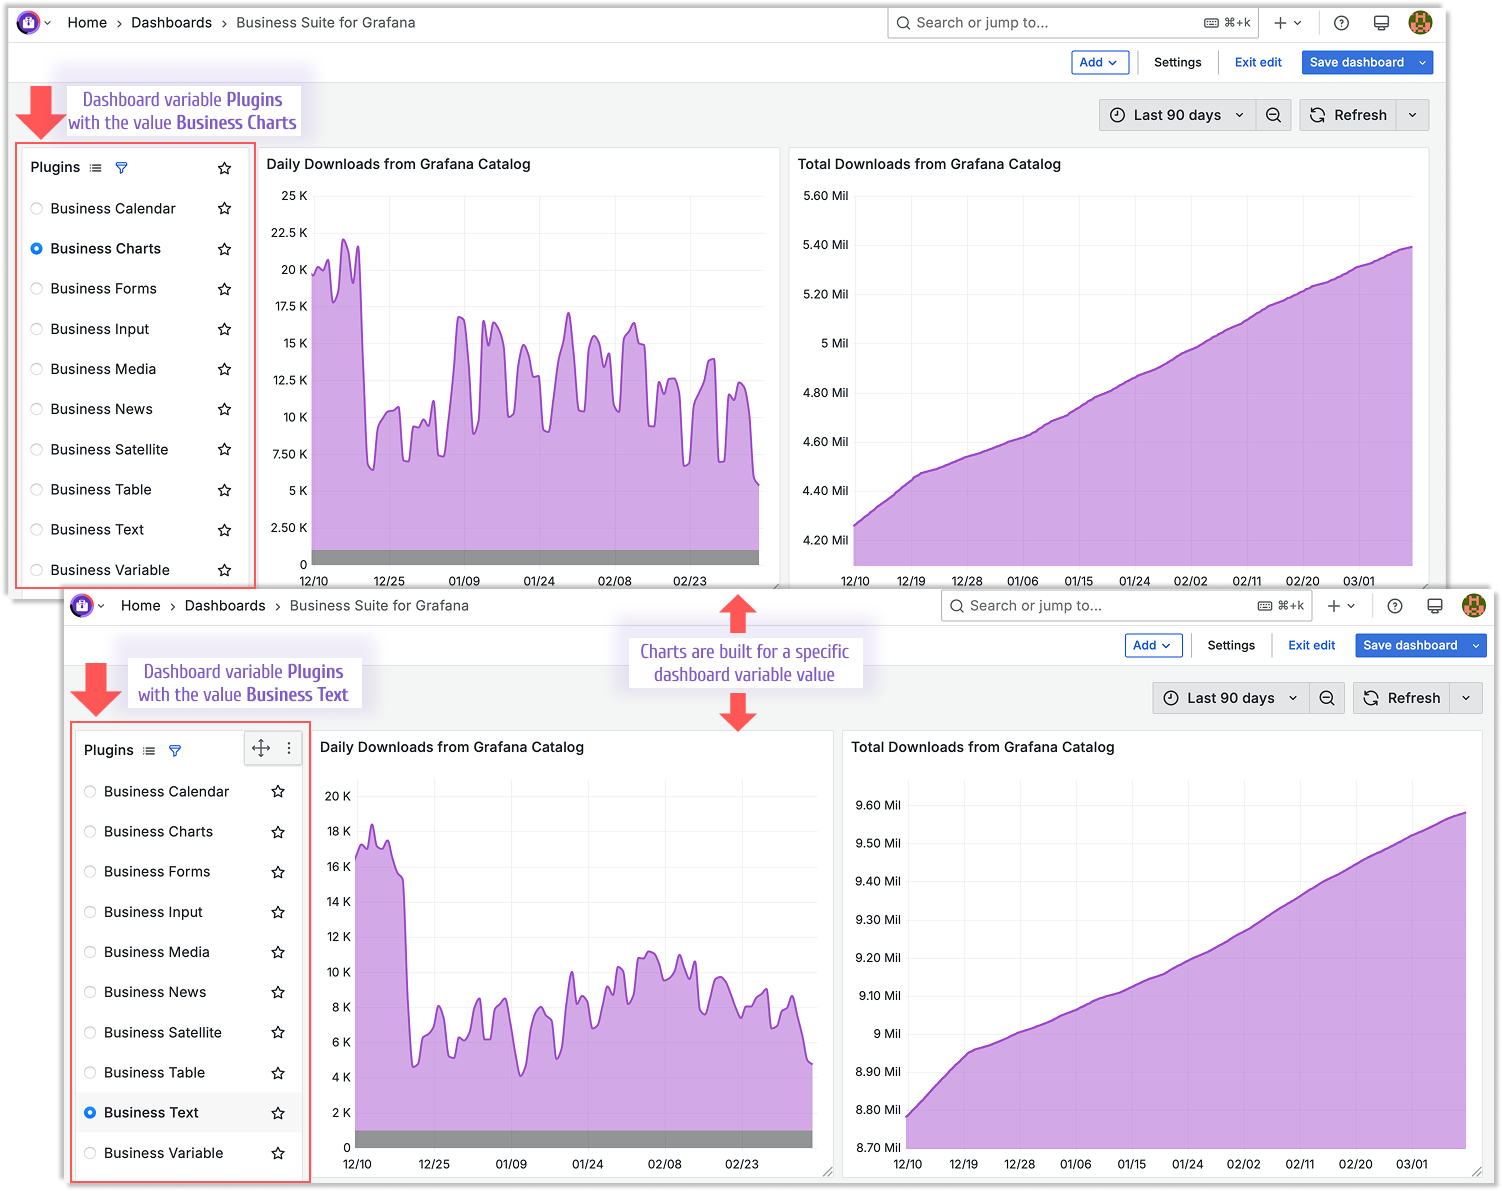
Dashboard variables are dynamic placeholders in Grafana that let you tweak what dashboards display without hardcoding every scenario. Think of them as filters or switches—controlled via dropdowns or queries—that adjust data scope, such as regions, timeframes, or product lines. One dashboard can thus serve multiple needs, updating instantly based on your selection.
Imagine a retail chain tracking sales. Instead of separate dashboards per store, a $location variable lets users pick “New York,” “London,” or “Tokyo” from a dropdown. The dashboard then shows location-specific metrics—revenue, foot traffic, inventory—in real time.
The Power of Variables in Business Alerting
Variables enhance dashboard interactivity, but their real strength emerges with Business Alerting. Alerts trigger when conditions are met—say, website uptime drops or order delays spike. By embedding variables into alerts, you gain:
- Scalability: One alert rule monitors hundreds of entities (e.g., stores, servers) without duplicating effort.
- Precision: Alerts focus on what’s critical, adapting to variable-driven contexts like priority regions.
- Clarity: Tailored notifications reach the right teams, reducing irrelevant noise.
This elevates Grafana from a visualization platform to a proactive BI engine, keeping your business ahead of the curve.
Setting Up Variables for Alerting
Let’s walk through a practical example: monitoring order fulfillment rates across warehouses using variables and alerts in Grafana.
-
Create a Variable
- Navigate to “Dashboard Settings” > “Variables” in Grafana.
- Add a variable named
$warehouse, set its type to “Query,” and link it to your data source (e.g., MySQL, Prometheus). - Use a query like
SELECT DISTINCT warehouse_name FROM orders_table. Enable “Multi-value” and “Include All” for flexibility.
-
Build Your Dashboard
- Add a panel to visualize fulfillment rates with a query like
SELECT fulfillment_rate FROM orders WHERE warehouse = '$warehouse'. - Set thresholds (e.g., < 90% triggers an alert).
- Test it: Switch
$warehousevalues and confirm the panel updates dynamically.
- Add a panel to visualize fulfillment rates with a query like
-
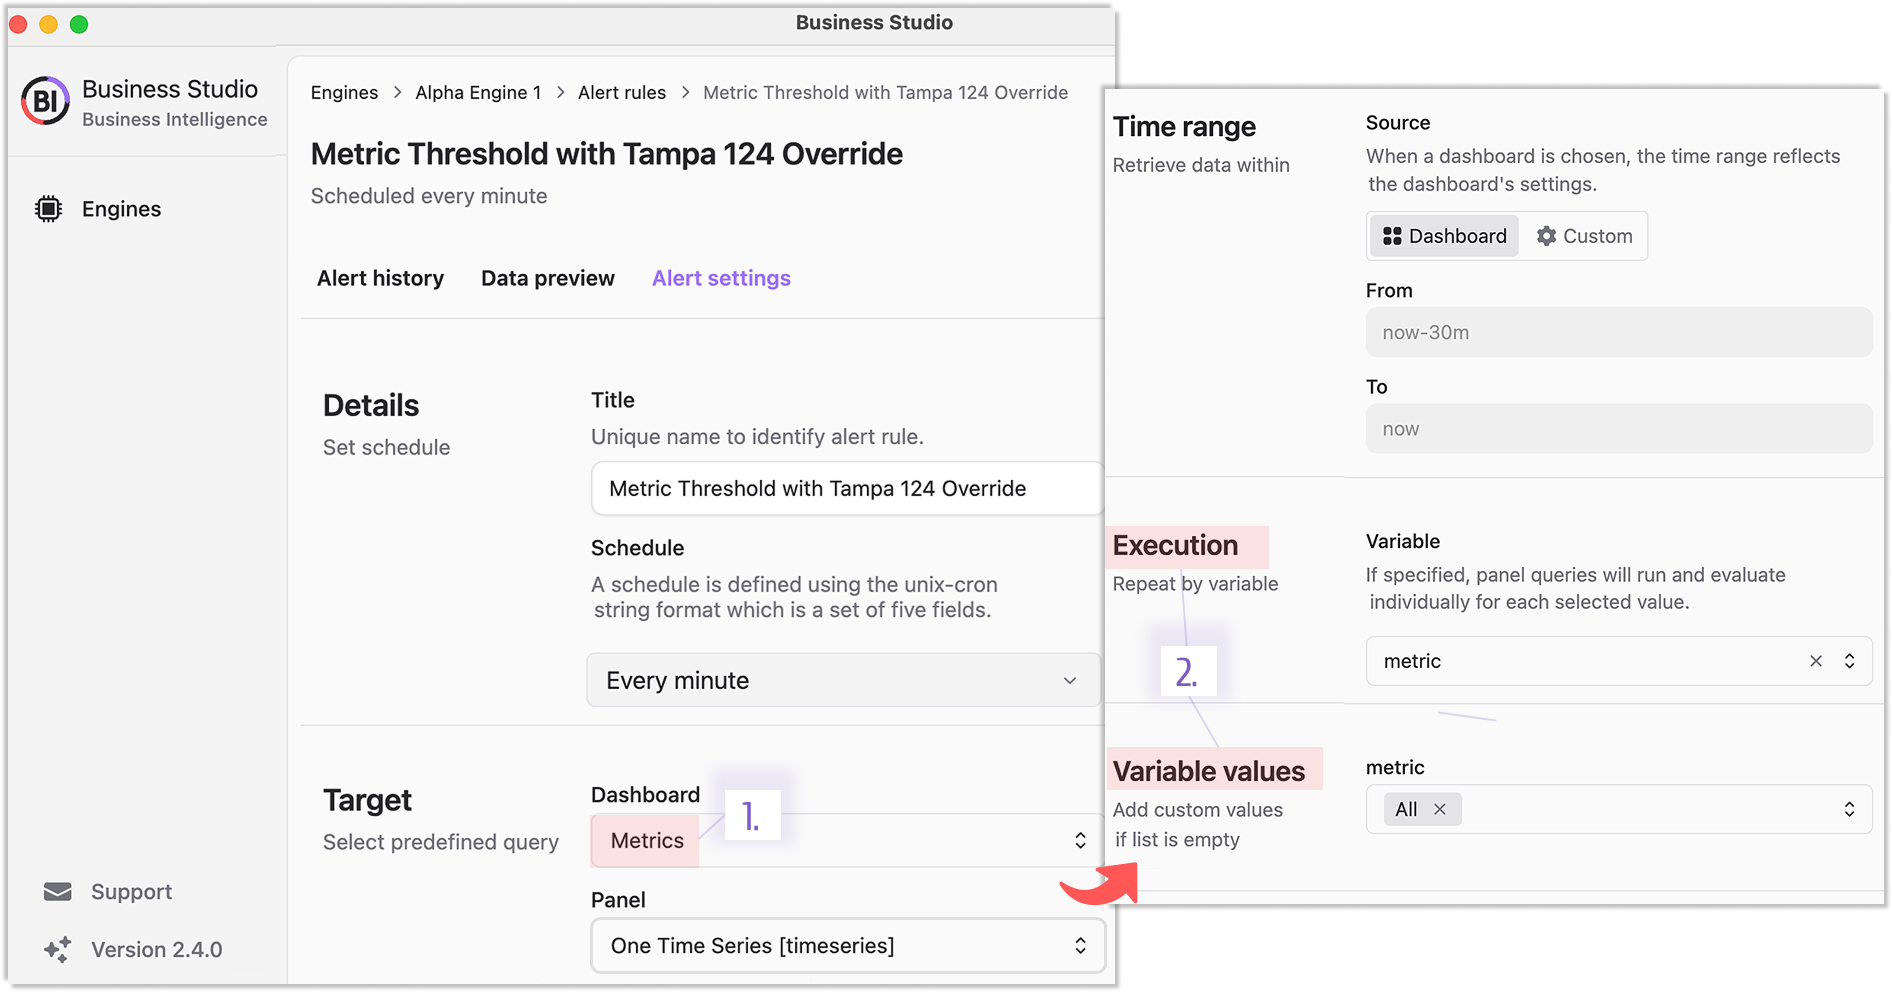
Configure an Alert
- Open Business Studio.
- Select a Business Engine, go to “Alert rules,” and click “Add Alert Rule.”
- Specify the dashboard, panel, and execution settings, leveraging the
$warehousevariable and thresholds. - Choose actions—like Slack or email—for when thresholds are breached.
- Test and Refine
- Simulate a fulfillment drop (or use historical data) to verify alert triggers.
- Fine-tune with additional variables (e.g.,
$timeframe) or adjust thresholds for precision.
Real-World Applications
This approach is versatile across industries:
- E-commerce: Alert on order delays by
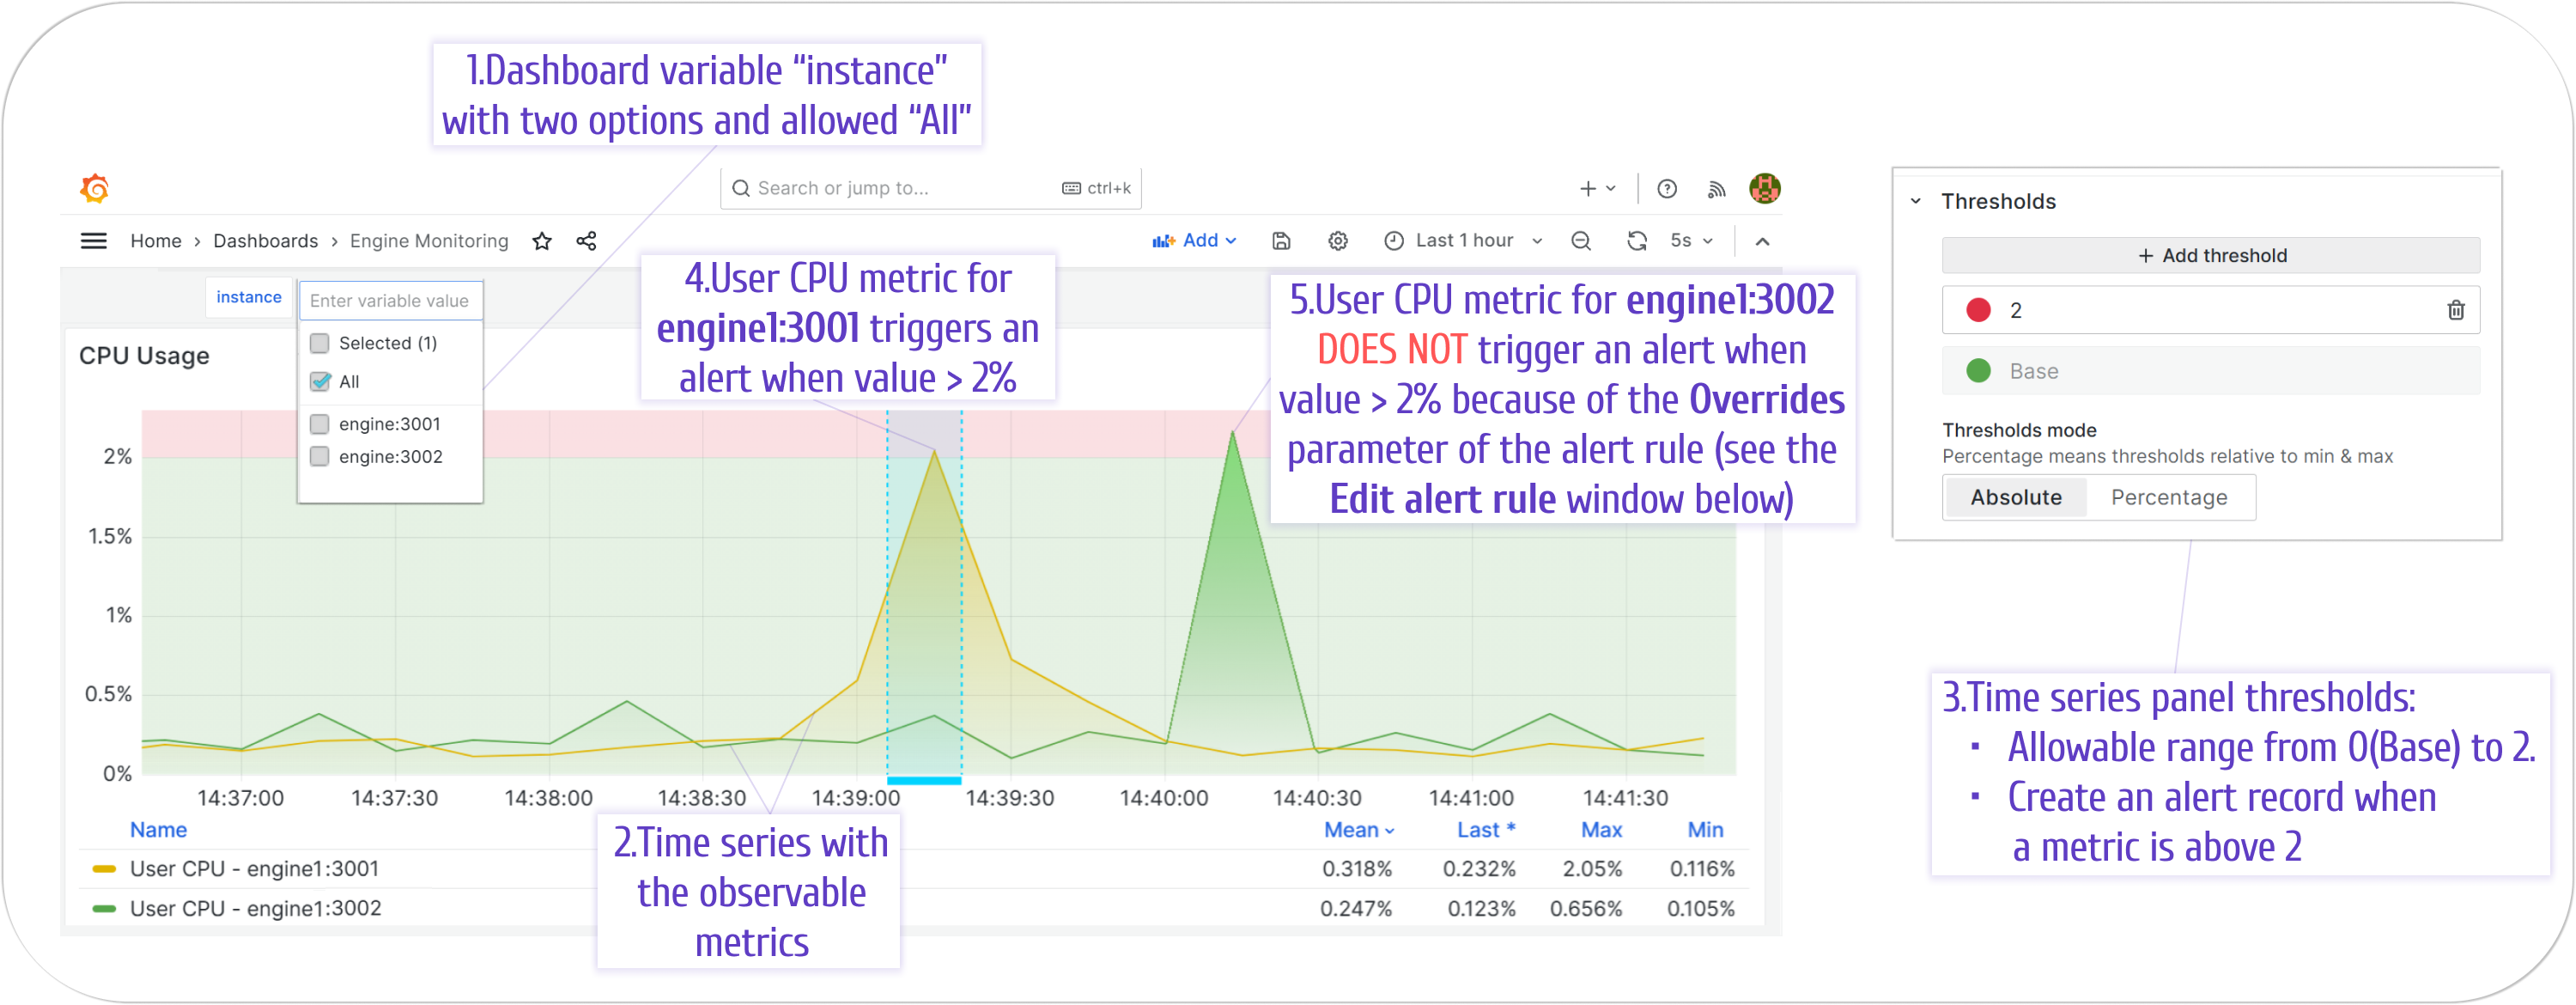
$regionwhen processing times exceed targets. - IT Operations: Notify admins if
$clusterCPU usage spikes beyond safe levels. - Marketing: Flag underperforming
$campaign_idads for quick optimization.
Variables make dashboards and alerts adapt to your business’s unique needs.
Why Grafana Excels for BI
Grafana isn’t just for DevOps—it’s a BI powerhouse. Its cloud and self-hosted scalability, plus integrations with diverse data sources (SQL, Prometheus, etc.), suit complex operations. Dashboard variables amplify this, letting you ask—and answer—critical questions without endless manual adjustments.
Take Control of Your Data
Mastering Business Alerting with dashboard variables isn’t just about staying informed—it’s about staying agile. Dynamic dashboards and smart alerts shift your BI from reactive reporting to proactive decision-making.
Ready to revolutionize your BI? Start experimenting with variables in Grafana today and see your Business Intelligence strategy evolve into a competitive edge.
We’d Love to Hear From You!
Have feedback or ideas? Get involved:
- Questions, Features, or Bugs: Open a Zendesk ticket for a prompt and dedicated response from our team.
- Join the Conversation: Subscribe to our YouTube Channel and share your thoughts in the comments.
Your input helps us improve, so don’t hesitate to get in touch!