Business Intelligence 1.2.0: Enhanced Alerting Panel, Regex Support, and Webhook Improvements


We’re excited to announce the release of Business Intelligence 1.2.0, a proof-of-concept (POC) update from Volkov Labs that paves the way for significant advancements in our Business Intelligence platform. This release introduces key enhancements, including:
- A redesigned Alerting Panel for intuitive and centralized control.
- Support for Regex Pattern evaluation in alerts.
- Improved Webhook functionality with connectivity testing and a "Use by Default" option.
Take a closer look at what’s new:
Proof-of-Concept Vision
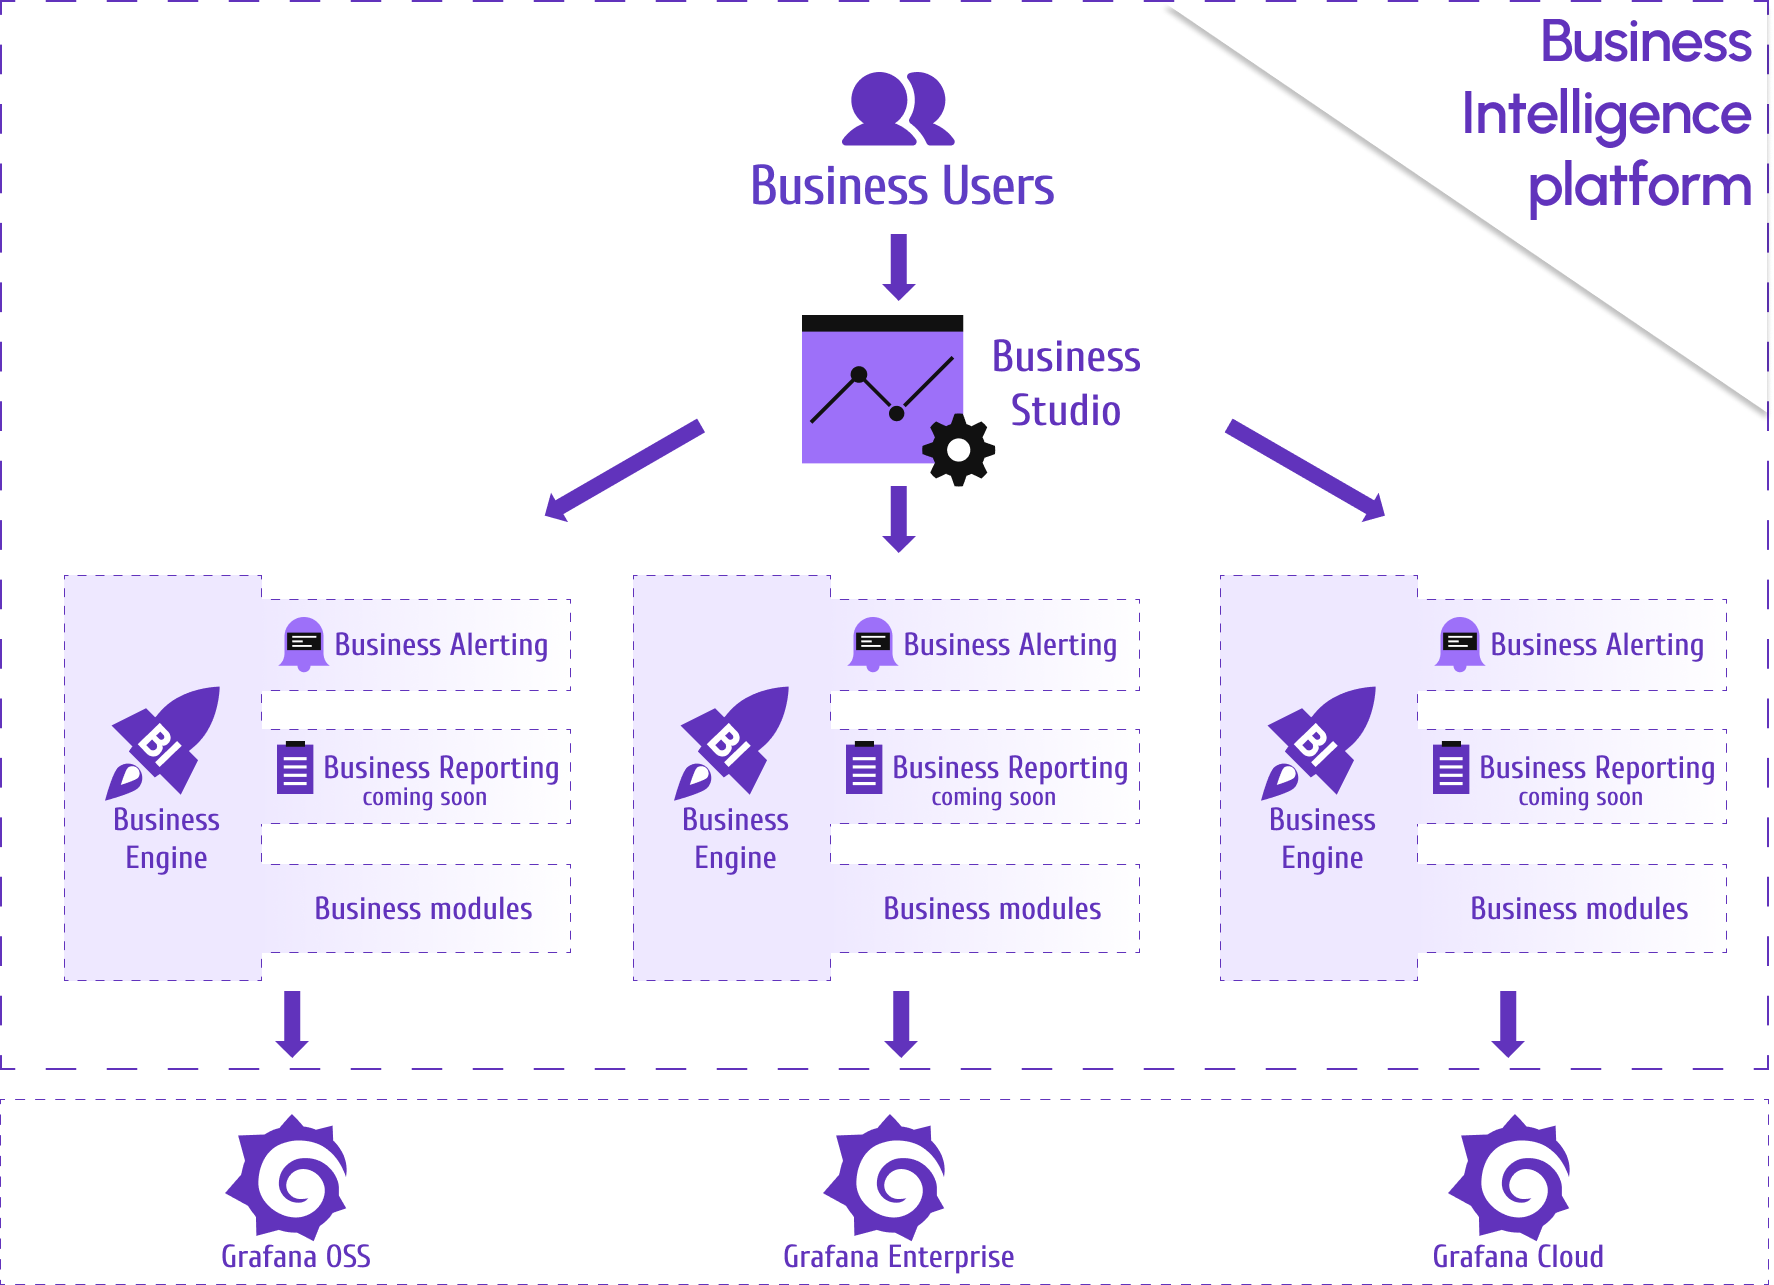
Business Intelligence remains a POC, with a full launch targeted for 2024-2025. Our roadmap includes transformative features such as:
- Advanced Business Alerting
- High-Performance Business Engine
- Business Studio
- Comprehensive Business Reporting
- Streamlined Dashboard Management
Redesigned Alerting Panel
The updated Alerting Panel offers a centralized and user-friendly interface for managing alerts, aligning seamlessly with Grafana’s alerting basics.
Alert Card Design
Each alert is represented by a modern, compact card that includes:
- The alert title and associated panel name.
- Scheduling information.
- Clear status indicators and actionable buttons.
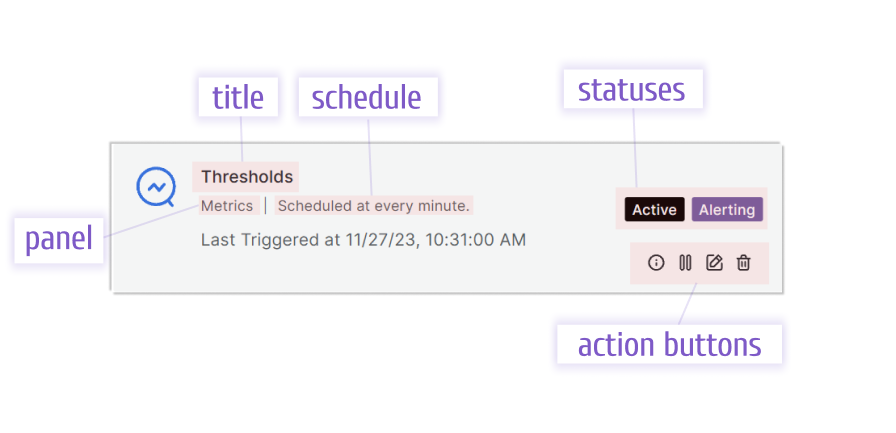
Alert Statuses
Alerts are tracked using two distinct status types:
- Active/Paused: Indicates whether the alert is running or temporarily disabled.
- Run State:
- Scheduled: The alert is queued and has not yet executed.
- OK: No breaches or patterns detected during evaluation.
- Alerting: Thresholds have been breached or a pattern has been matched.
- Error: An issue occurred with the query, annotation, or webhook.
By default, new alerts are set to Active and Scheduled. Pausing or editing an alert resets its state to Scheduled.
Action Buttons
The Alerting Panel provides four intuitive action buttons for full control:
- Info: Displays detailed information about the alert.
- Pause/Activate: Toggles the alert between active and paused states.
- Edit: Opens the edit drawer for modifications (resets to Scheduled upon saving).
- Delete: Removes the alert after a confirmation prompt.
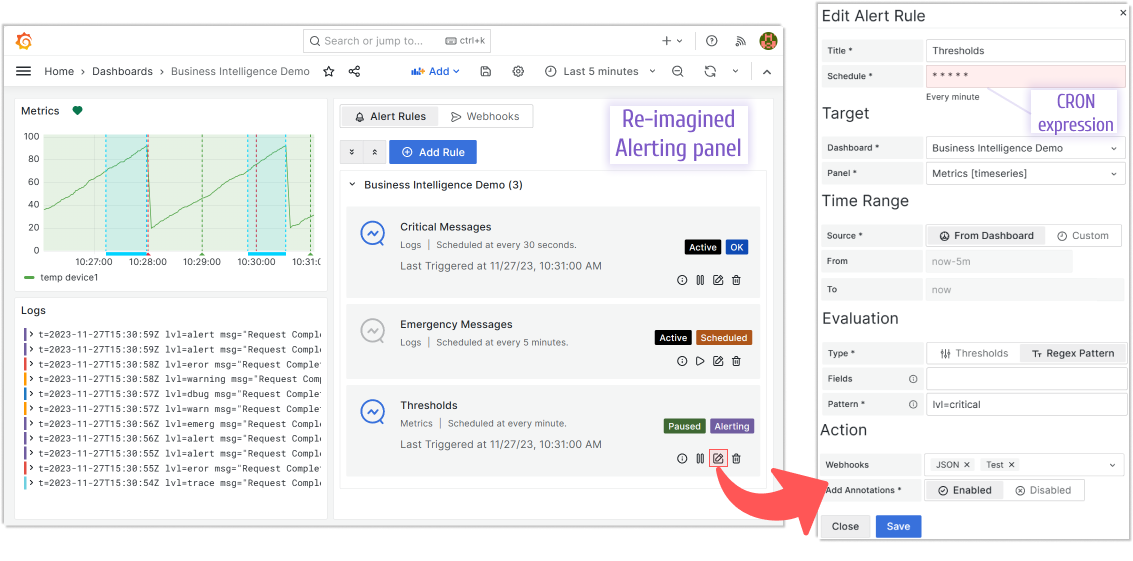
Regex Pattern Evaluation
In addition to Thresholds, alerts now support a powerful new Regex Pattern evaluation option:
- Thresholds: Evaluates data against predefined limits set in the panel.
- Regex Pattern: Searches for specific patterns within designated fields (optional).
This feature is accessible in the Evaluation category of the alert settings.
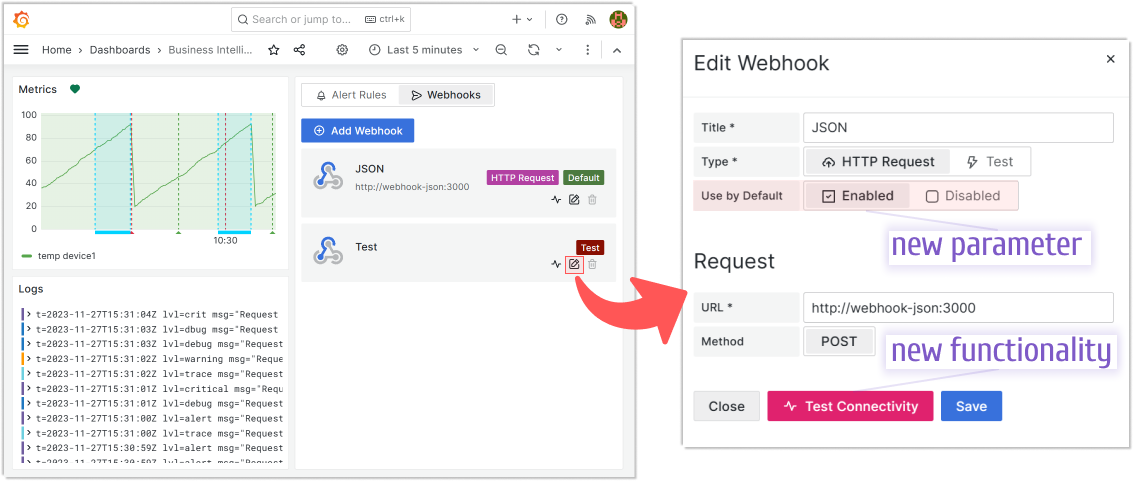
Webhook Enhancements
Test Connectivity
A new Test Connectivity button in the Edit Webhook drawer allows you to verify the functionality of webhook endpoints before deployment.
Use by Default Option
You can now designate a webhook as the default. When no specific webhook is selected for an alert, the default webhook is automatically applied, ensuring seamless integration.
Getting Started
Business Intelligence Platform is a powerful solution that harnesses Docker containers to deliver a modular, scalable, and user-friendly environment for alert-driven analytics. Whether you're just starting out or are an experienced user, our Quick Start Guide is designed to help you set up and deploy the platform effortlessly.
This guide provides a step-by-step walkthrough of the essential setup process, ensuring you can get up and running in no time. Key topics include:
- Configuring the Business Engine: Understand how to set up the core component that powers your analytics.
- Launching the Business Studio: Deploy and access the intuitive interface on your local machine for seamless management and visualization.
We’d Love to Hear From You!
Your feedback and ideas are invaluable to us! Here’s how you can get involved:
- Questions, Feature Requests, or Bugs: Submit a Zendesk ticket to receive a swift and personalized response from our dedicated support team.
- Join the Community: Subscribe to our YouTube Channel and share your thoughts or suggestions in the comments.
Your input is crucial in helping us grow and improve, so please don’t hesitate to reach out!