Business Intelligence 1.2.0: Alerting Panel, Regex, and Webhooks Enhanced


We’re thrilled to unveil Business Intelligence 1.2.0, a proof-of-concept release from Volkov Labs setting the stage for expansive growth in the Business Intelligence platform. This update delivers:
- A revamped Alerting panel for streamlined control.
- Regex pattern evaluation for alerts.
- Webhook upgrades: Test connectivity and a Use by Default option.
Check it out:
Proof of Concept Vision
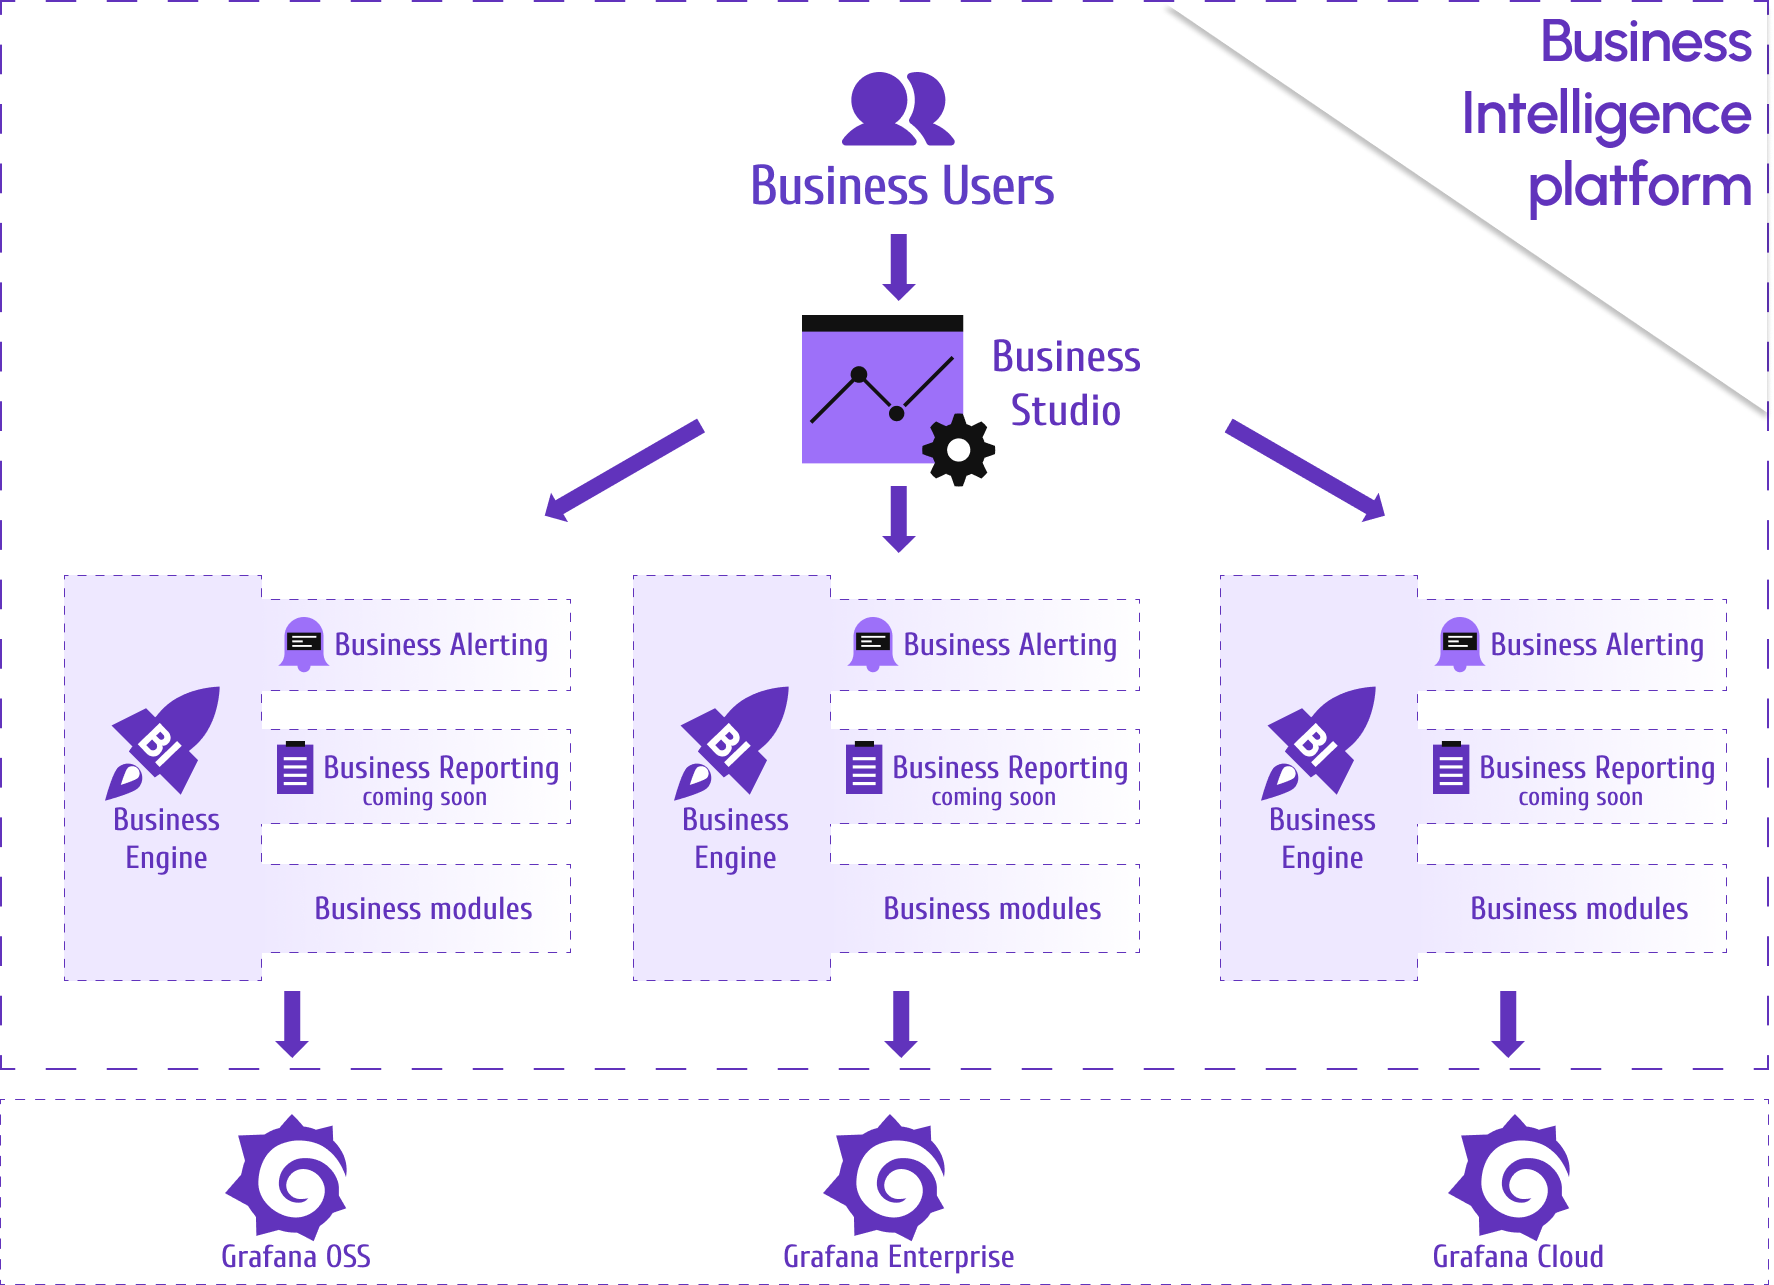
Business Intelligence is a POC with a full launch planned for 2024-2025, featuring:
- Business Alerting
- High-performance Business Engine
- Business Studio
- Business Reporting
- Dashboard Management
Revamped Alerting Panel
The updated Alerting panel centralizes alert management with an intuitive layout, aligned with Grafana’s alerting basics.
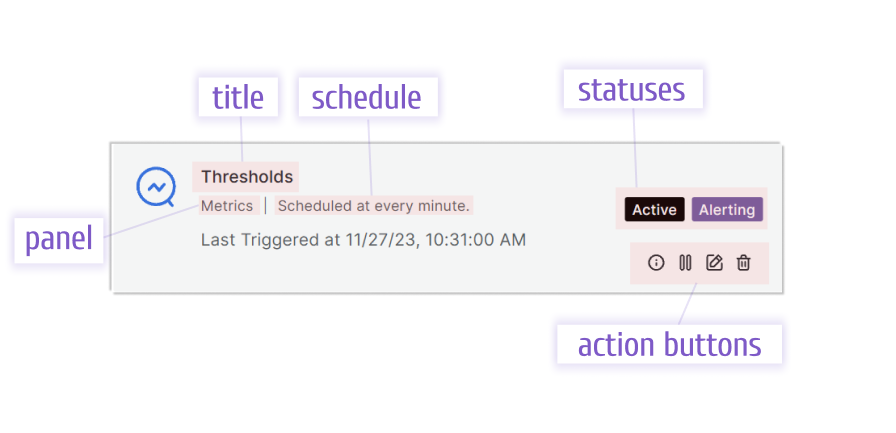
Alert Card
Each alert gets a sleek card displaying:
- Title and evaluated panel name.
- Schedule details.
- Status indicators and action buttons.
Statuses
Two statuses track each alert:
- Active/Paused: Is it running or on hold?
- Run State:
- Scheduled: Queued but not yet run.
- OK: No breaches or patterns detected.
- Alerting: Thresholds breached or pattern found.
- Error: Issue with query, annotation, or webhook.
New alerts start as Active and Scheduled. Pausing or editing resets them to Scheduled.
Action Buttons
Four options enabling control:
- Info: View alert details.
- Pause/Active: Toggle the alert’s state.
- Edit: Open the edit drawer (resets to Scheduled on save).
- Delete: Remove the alert with confirmation.
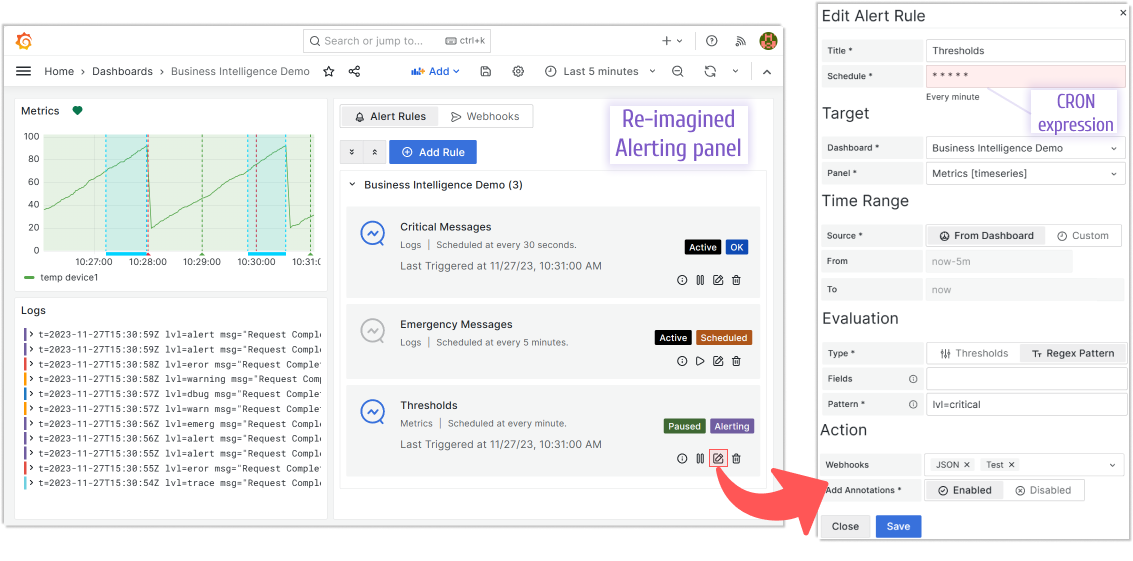
Regex Pattern Evaluation
A new Regex Pattern option joins Thresholds in alert evaluations:
- Thresholds: Checks data against panel-defined limits.
- Regex Pattern: Scans specified fields (optional) for a defined pattern.
See it in the Evaluation category above.
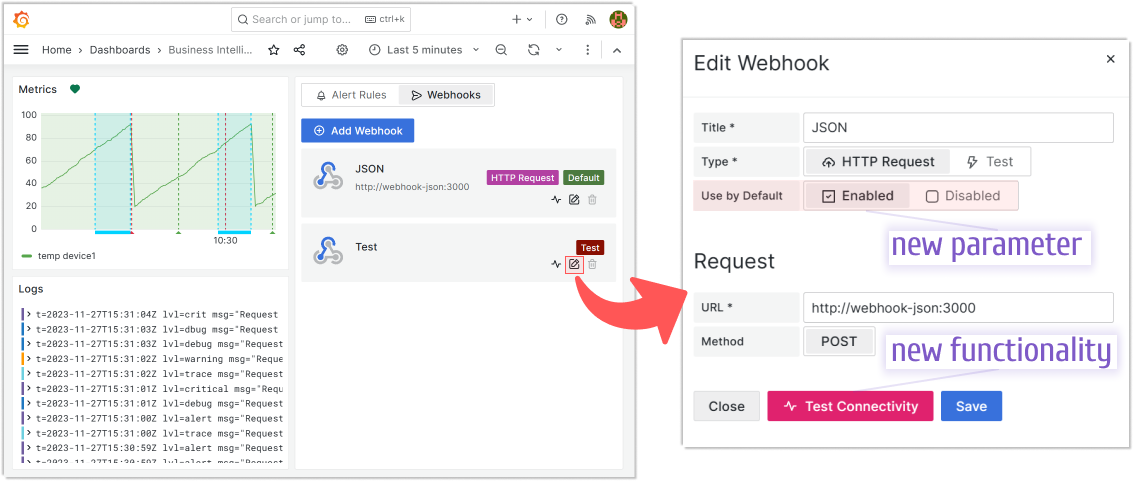
Webhook Enhancements
Test Connectivity
Verify webhook endpoints with a Test Connectivity button in the Edit Webhook drawer.
Use by Default
Set a webhook as the default—automatically used when none is specified—for seamless alerting.
Getting Started
The Business Intelligence platform uses Docker containers to deliver a modular, scalable solution. Our Quick Start guide provides a simplest setup to get started.
We’d Love to Hear From You!
Have feedback or ideas? Get involved:
- Questions, Features, or Bugs: Open a Zendesk ticket for a prompt and dedicated response from our team.
- Join the Conversation: Subscribe to our YouTube Channel and share your thoughts in the comments.
Your input helps us improve, so don’t hesitate to get in touch!