Business Intelligence 1.3.0: Transformations, Thresholds, and Health Checks


We are thrilled to announce the release of Business Intelligence 1.3.0, a proof-of-concept update from Volkov Labs that sets the stage for significant advancements in our Business Intelligence platform. This release introduces powerful new features and enhancements, including:
- User role support in the Alerting panel for tailored access control.
- Threshold color integration to visually define alert ranges.
- Beta support for transformations and multi-frame data sets.
- Improved Grafana health checks with configurable retry and timeout options.
Watch the highlights of this release in action:
User Role Support in the Alerting Panel
The Alerting panel now aligns with Grafana's user roles, ensuring that access to specific actions is appropriately restricted based on a user's permissions. This enhances security and usability across different user types.
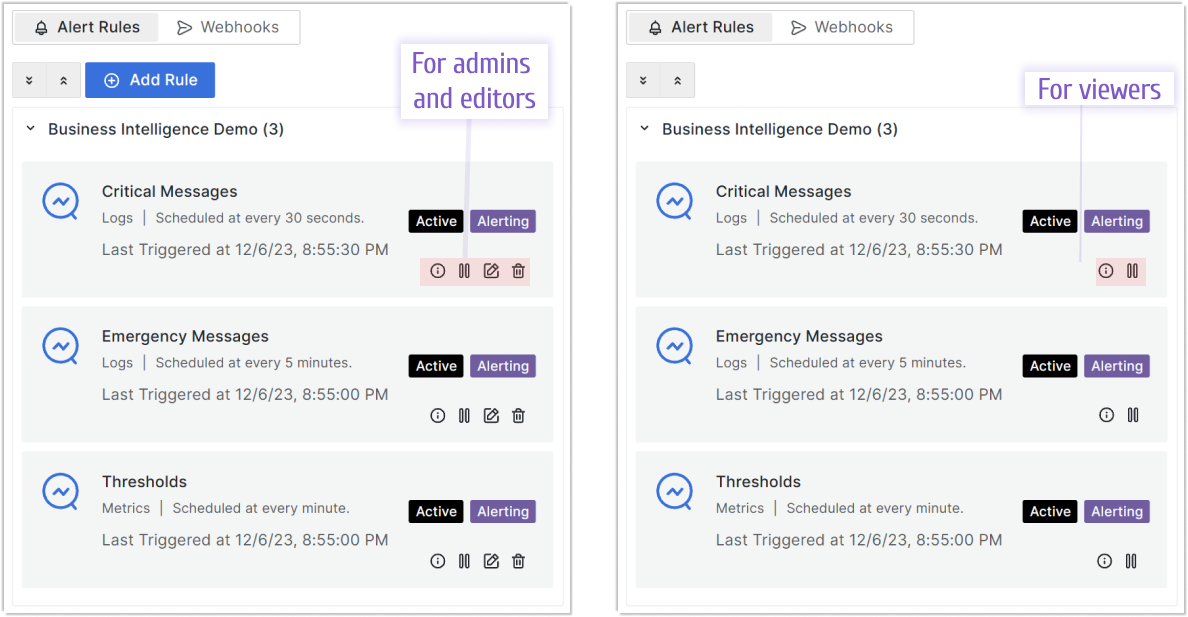
Alert Rules Page Permissions
- Admins/Editors: Full control with access to Info, Pause/Resume, Edit, and Delete actions.
- Viewers: Restricted access, limited to Info and Pause/Resume actions.
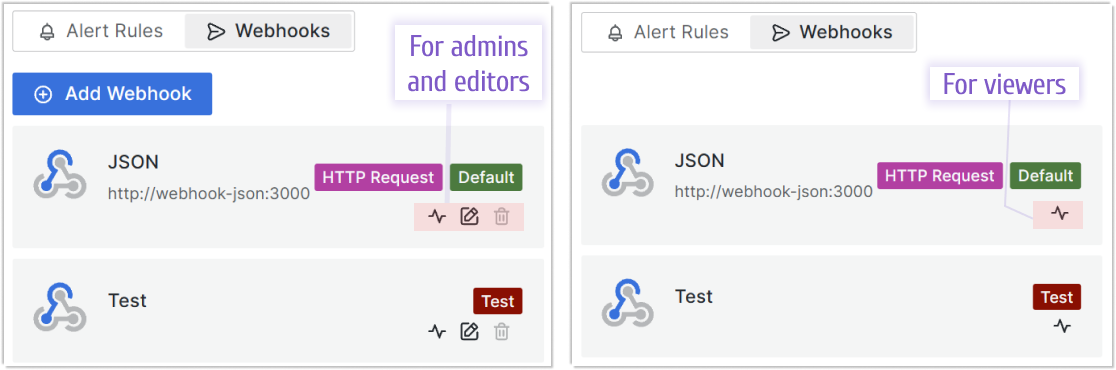
Webhooks Page Permissions
- Admins/Editors: Complete access to Test, Edit, and Delete actions.
- Viewers: Limited to the Test action only.
A greyed-out Delete button indicates that the webhook is associated with an active alert rule and cannot be deleted until the association is removed.
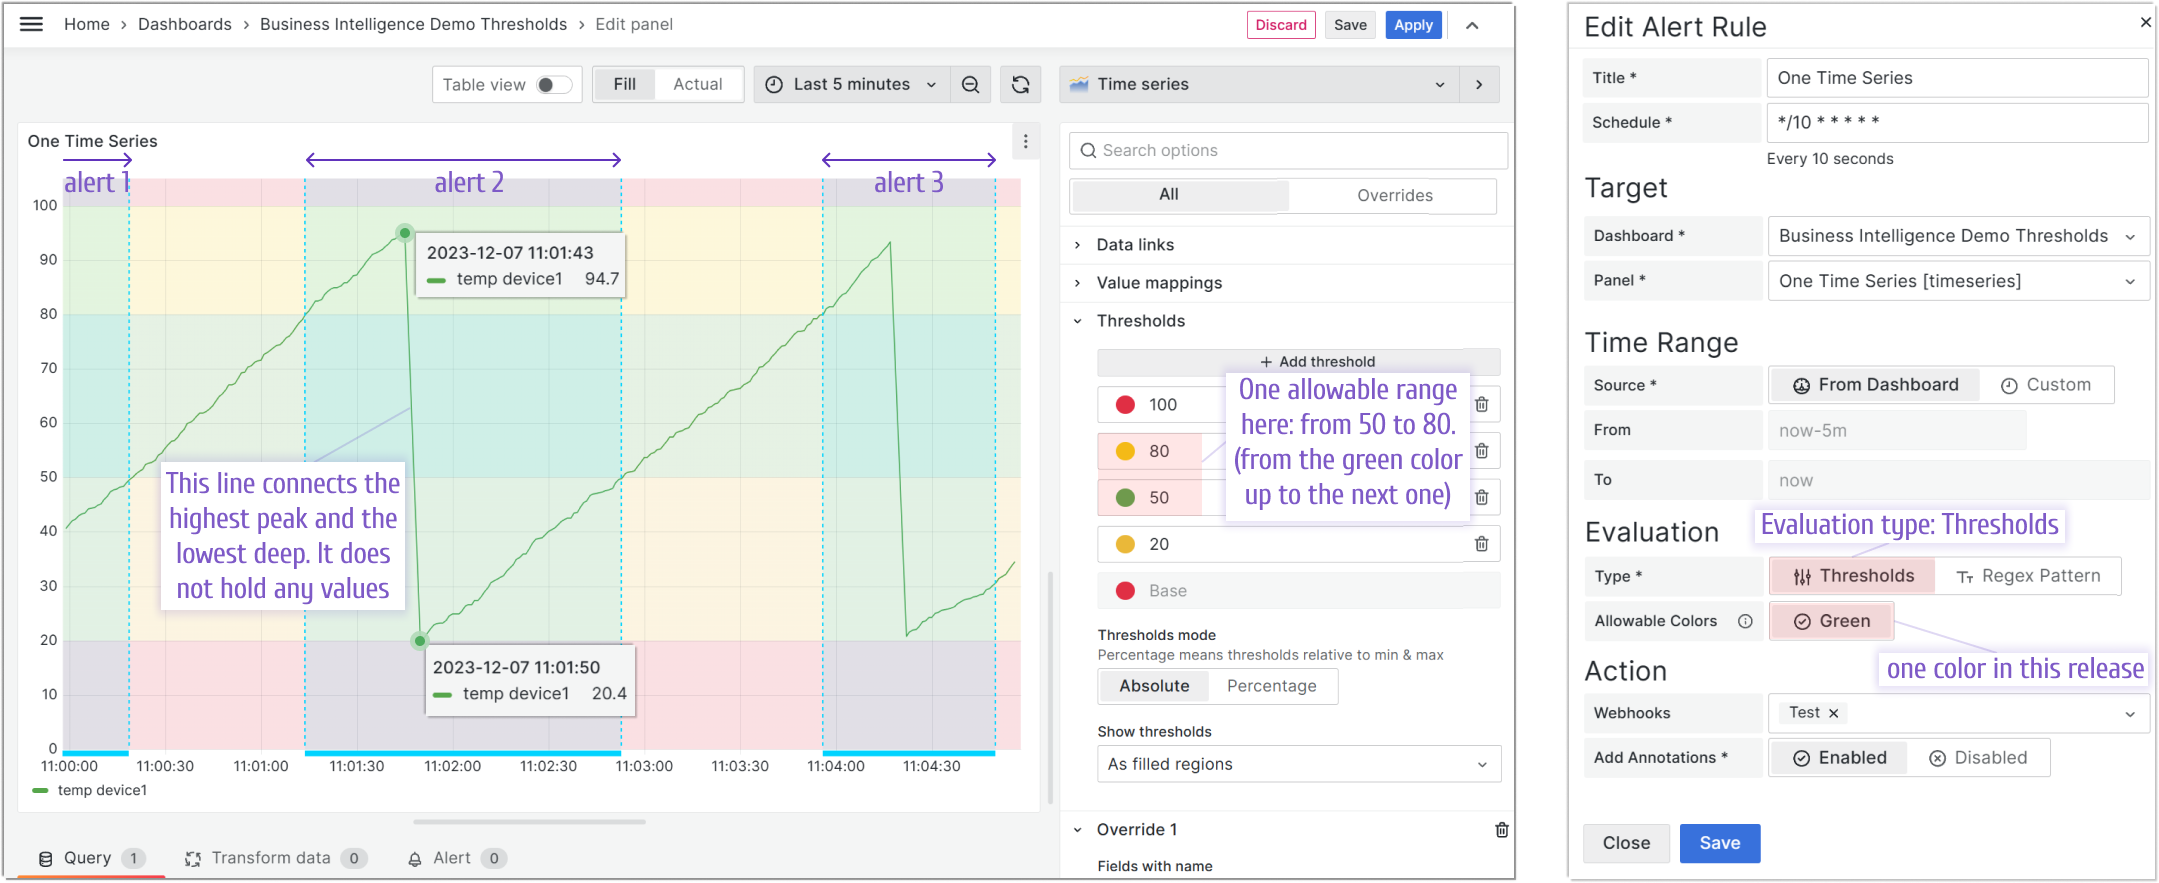
Threshold Colors for Alert Triggers
With Business Intelligence 1.3.0, the BI Engine leverages Threshold Colors to define acceptable data ranges visually. Alerts are triggered when values fall outside these ranges, allowing teams to focus on critical deviations while ignoring normal fluctuations.
Example Scenario (Allowable Range: 50-80):
- Alert 1: Triggered when the temperature drops below 40.
- Alert 2: Triggered with a spike to 94.7, followed by a drop to 20.4.
- Alert 3: Triggered at a high of 93.4, then a low of 21.1.
Annotations (highlighted in light blue) visually mark these events on the dashboard. Gaps in annotations represent sudden data shifts, while continuous breaches extend the annotation duration as alerts are evaluated periodically.
Beta Support for Transformations and Multi-Frame Data Sets
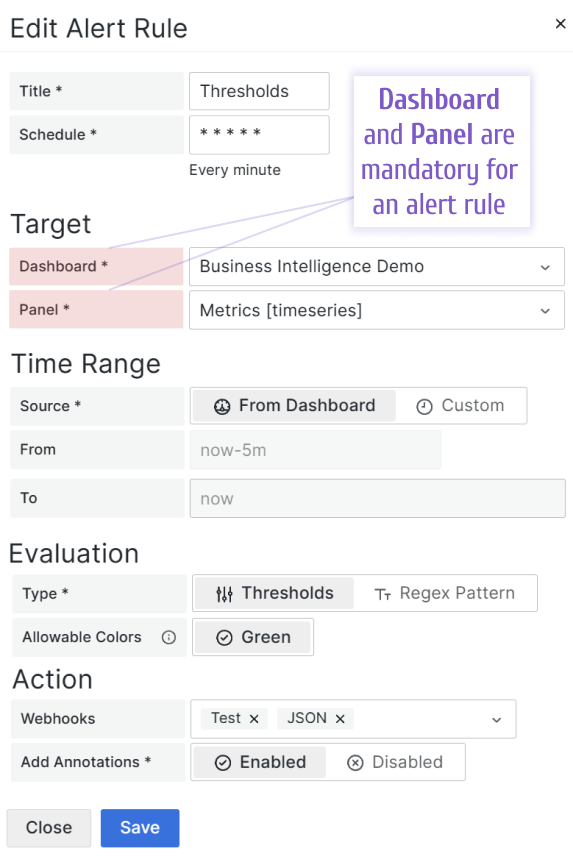
This release introduces beta support for advanced data handling, enabling more flexible and powerful alert configurations tied to specific dashboards and panels.
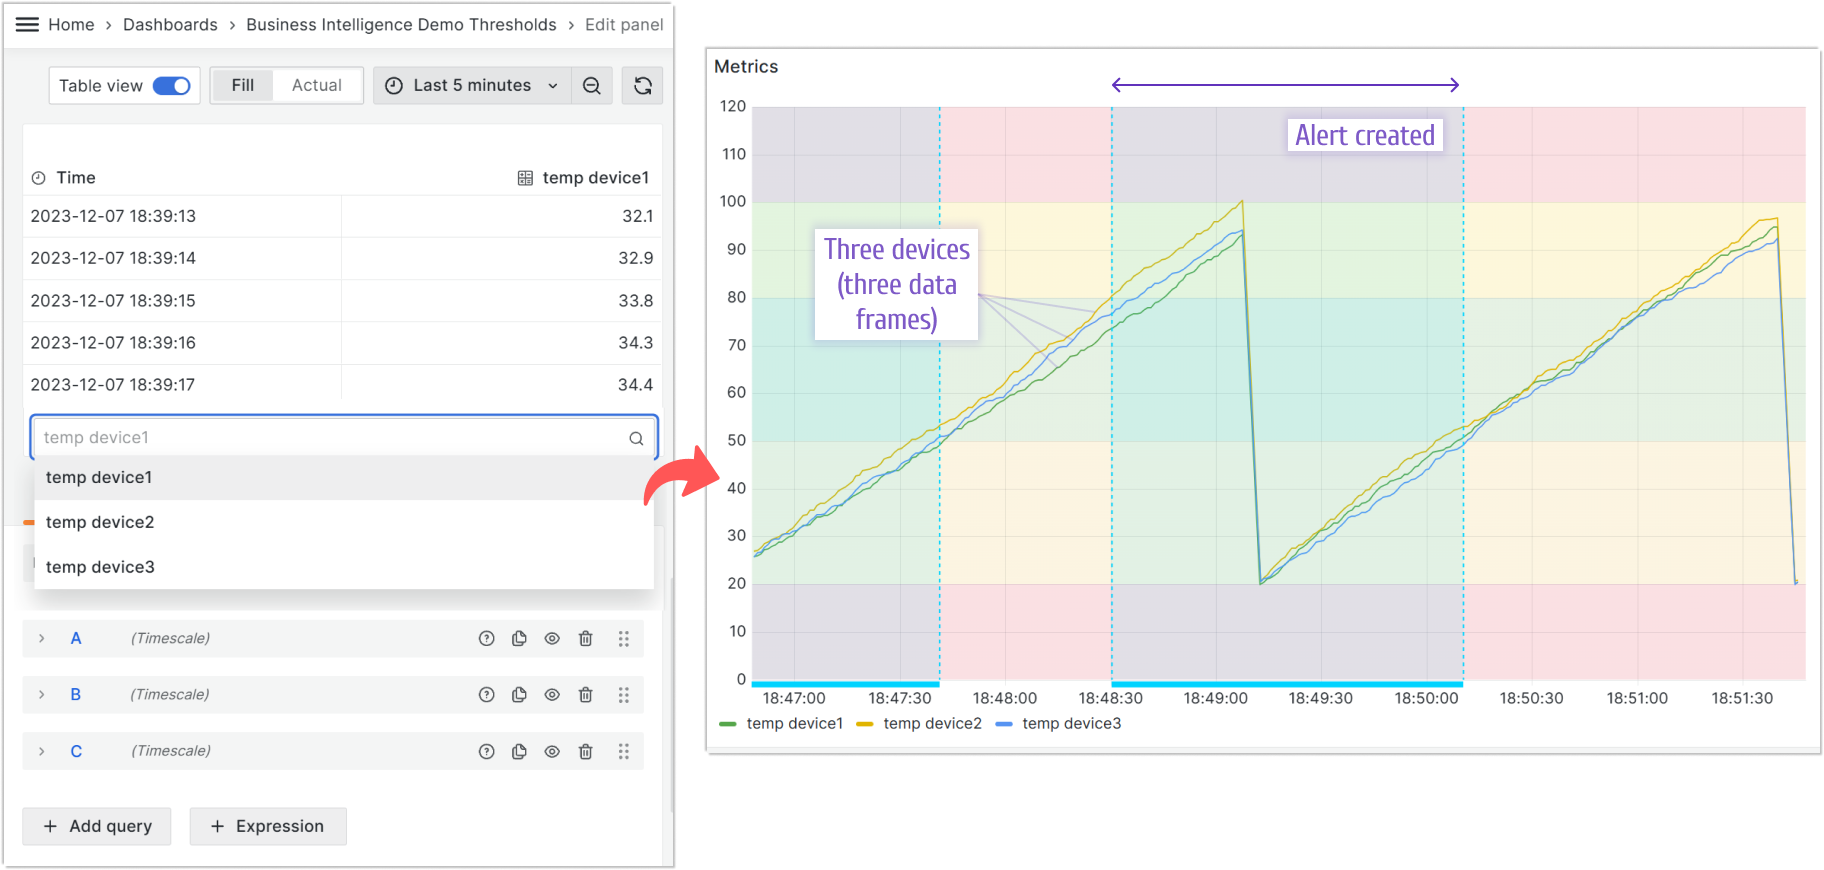
Multi-Frame Data Support
Business Intelligence 1.3.0 now supports multi-frame data sets, allowing alerts to monitor multiple data frames from a single source. For instance, when monitoring three devices:
- An alert is triggered if any device (e.g., Device 2) exceeds the defined range.
- The alert resolves only when the last device (e.g., Device 3) returns to the normal range.
Transformations (Beta)
Grafana transformations are now supported in beta. While most transformations should function as expected, the wide variety of options in Grafana means some may require additional refinement. We are actively working on full compatibility and will provide updates in future releases.
Transformation support is still evolving due to the extensive range of Grafana transformation options. We appreciate your feedback during this beta phase.
Enhanced Grafana Health Check Options
The BI Engine depends on Grafana for its operations, but differences in startup timing can sometimes cause health check failures, leading to unexpected shutdowns. To address this, Business Intelligence 1.3.0 introduces configurable retry and timeout parameters for Grafana health checks. By default, the system waits up to 5 seconds, but these settings can be customized to suit your environment.
Below is an example configuration for health check parameters:
##
## Service Account
## - Viewer permission is required to access dashboards.
## - Editor permission is required to access dashboards and add annotations.
##
GRAFANA_TOKEN=SERVICE-ACCOUNT-TOKEN

##
## Grafana HTTP API
##
GRAFANA_URL=http://grafana:3000

##
## Grafana Health Check Timeout (in milliseconds)
## Total wait time for Grafana availability is calculated as (Timeout * Number of Retries / 1000) seconds.
##
GRAFANA_HEALTH_CHECK_TIMEOUT=1000

##
## Grafana Health Check Number of Retries
##
GRAFANA_HEALTH_CHECK_RETRY=5
Getting Started
Business Intelligence Platform is a powerful solution that harnesses Docker containers to deliver a modular, scalable, and user-friendly environment for alert-driven analytics. Whether you're just starting out or are an experienced user, our Quick Start Guide is designed to help you set up and deploy the platform effortlessly.
This guide provides a step-by-step walkthrough of the essential setup process, ensuring you can get up and running in no time. Key topics include:
- Configuring the Business Engine: Understand how to set up the core component that powers your analytics.
- Launching the Business Studio: Deploy and access the intuitive interface on your local machine for seamless management and visualization.
We’d Love to Hear From You!
Your feedback and ideas are invaluable to us! Here’s how you can get involved:
- Questions, Feature Requests, or Bugs: Submit a Zendesk ticket to receive a swift and personalized response from our dedicated support team.
- Join the Community: Subscribe to our YouTube Channel and share your thoughts or suggestions in the comments.
Your input is crucial in helping us grow and improve, so please don’t hesitate to reach out!