Business Intelligence 1.3.0: Transformations, Thresholds, and Health Checks


We’re excited to introduce Business Intelligence 1.3.0, a proof-of-concept release from Volkov Labs laying the groundwork for expansive future growth in the Business Intelligence platform. This update brings:
- User role support in the Alerting panel.
- Threshold color integration for alert ranges.
- Beta support for transformations and multi-frames.
- Enhanced Grafana health check with retry and timeout options.
See it in action:
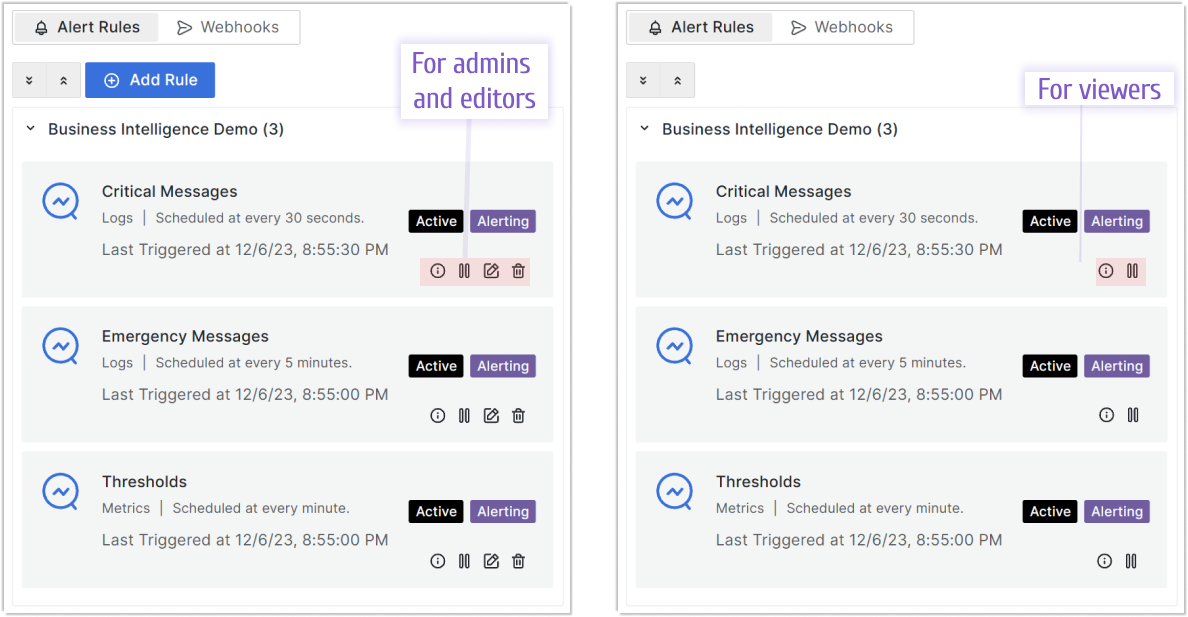
User Roles in the Alerting Panel
The Alerting panel now respects Grafana user roles, tailoring access to actions:
Alert Rules Page
- Admins/Editors: Full access—Info, Pause/Resume, Edit, Delete.
- Viewers: Limited to Info and Pause/Resume.
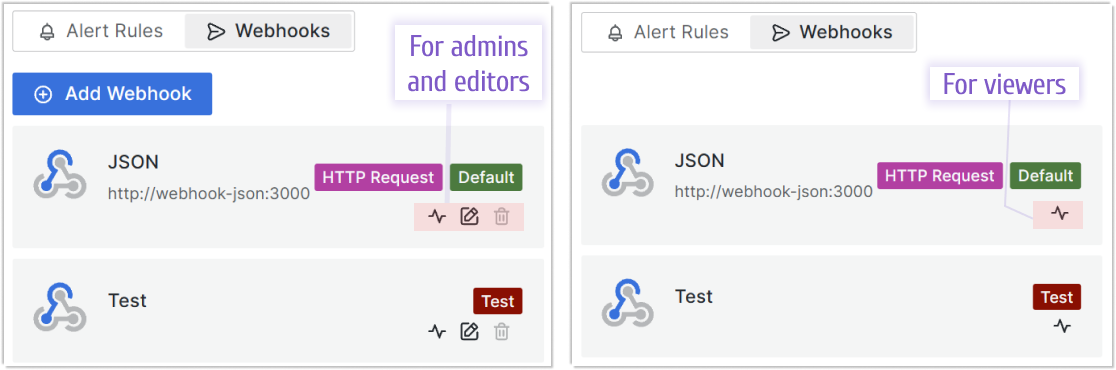
Webhooks Page
- Admins/Editors: All options—Test, Edit, Delete.
- Viewers: Only Test available.
A greyed-out Delete button means the webhook is tied to an active alert rule and can’t be removed.
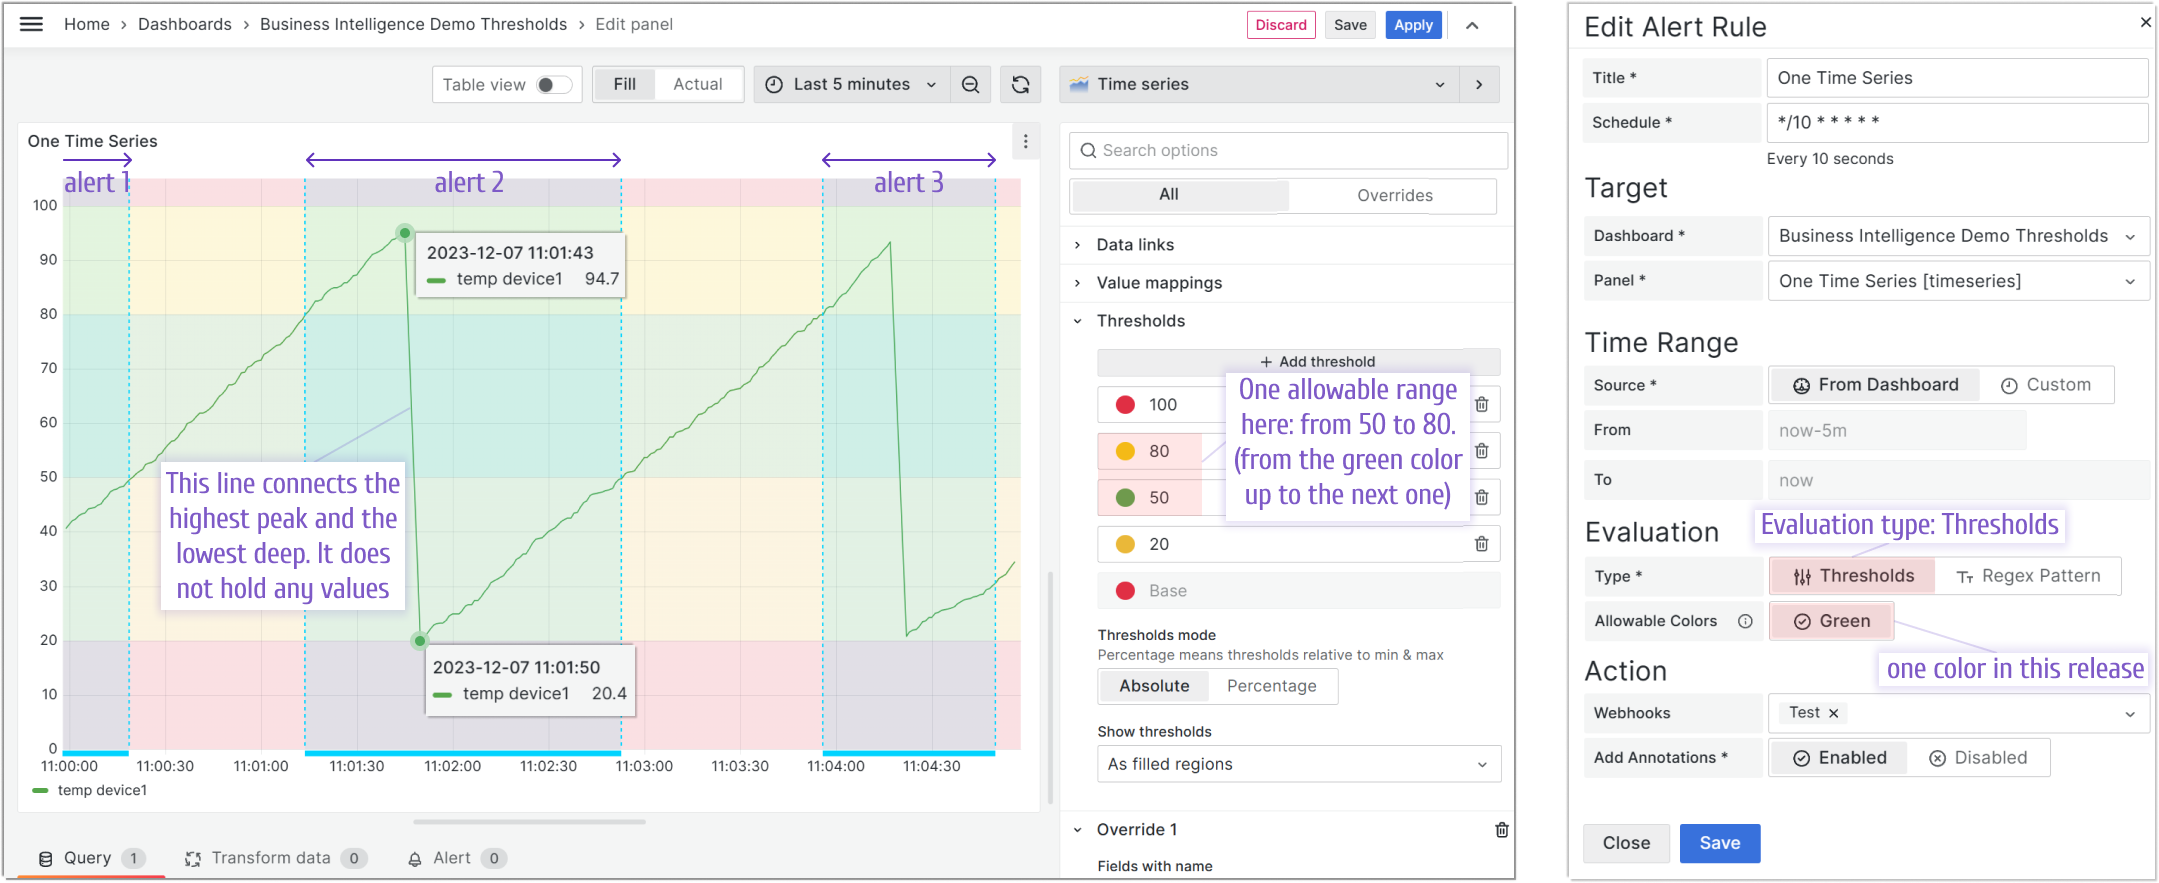
Threshold Colors for Alerts
The BI Engine now uses Thresholds colors to define allowable data ranges, triggering alerts when values stray outside. Normal ranges require no action, keeping your focus where it matters.
In this example (allowable range: 50-80), three alert records highlight breaches:
- Alert 1: Temperature drops below 40.
- Alert 2: Spikes to 94.7, then dips to 20.4.
- Alert 3: Hits 93.4, then falls to 21.1.
Annotations (light blue areas) mark these events, with gaps reflecting abrupt data shifts. Alerts run periodically, so ongoing breaches extend annotations over time.
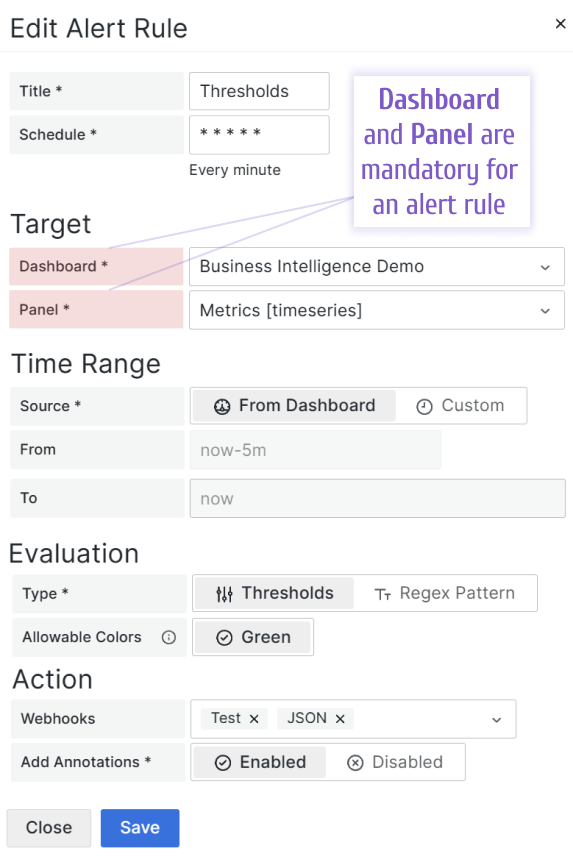
Transformations and Multi-Frames (Beta)
Alert rules tie to specific dashboards and panels:
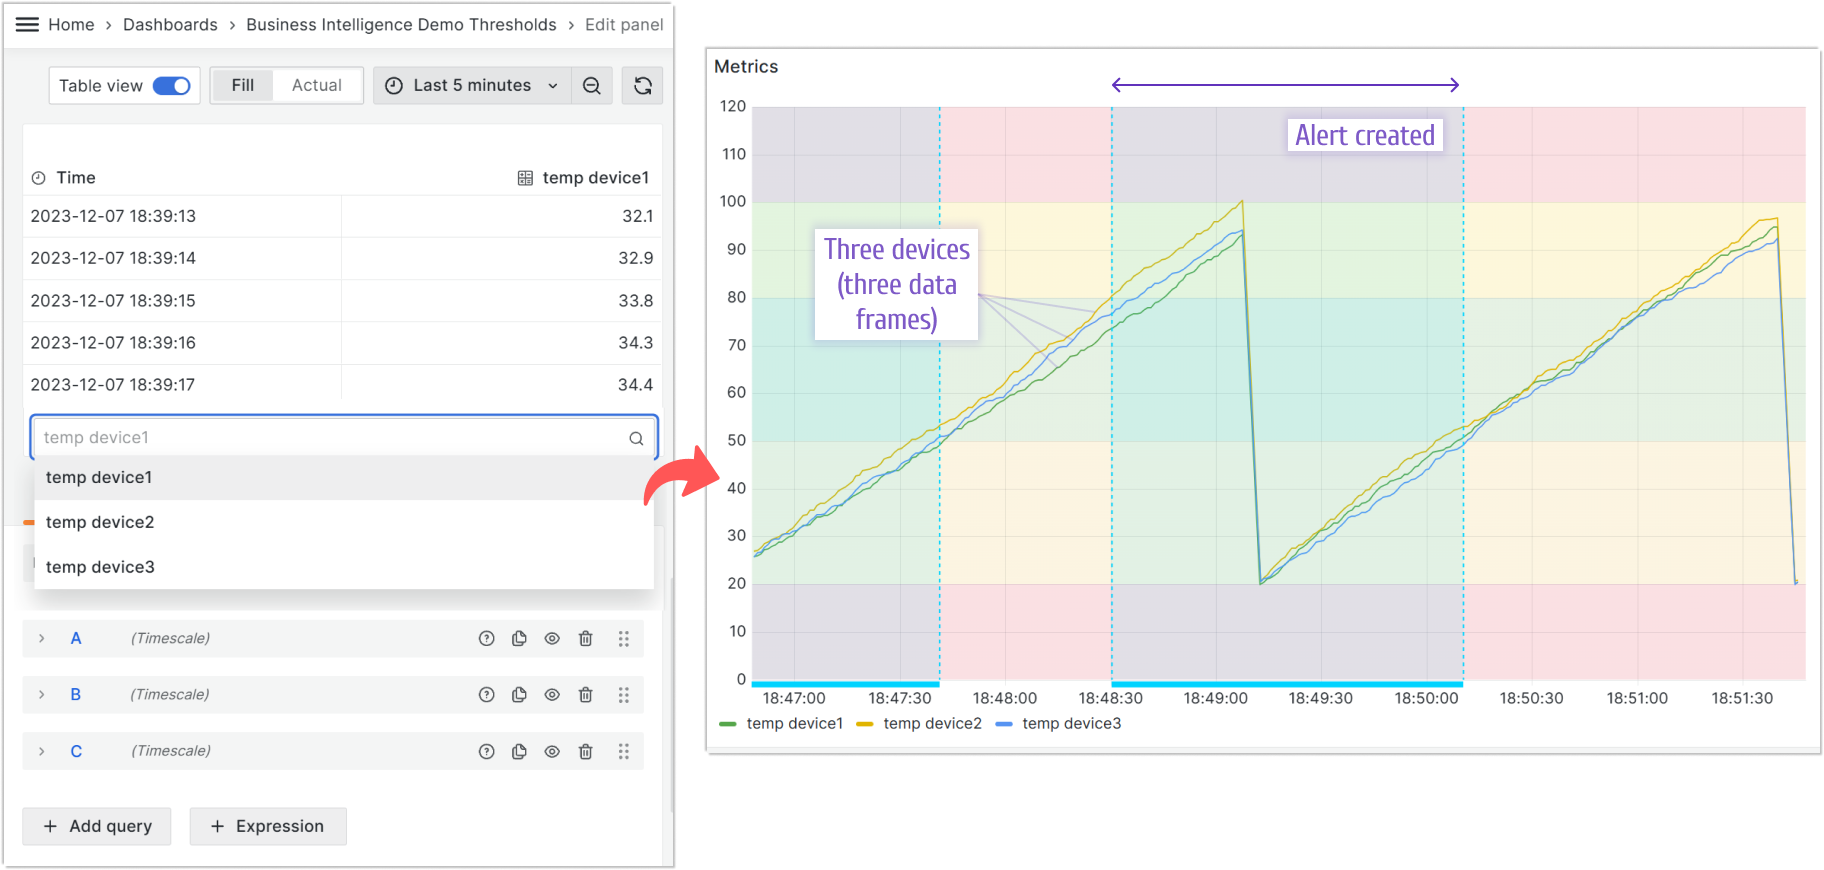
Multi-Frames
Now, BI supports multi-frame data sets—alerts apply across all frames from a data source. For example, monitoring three devices:
- Alert triggers when any device (e.g., Device 2) exceeds the range.
- Alert resolves when the last device (e.g., Device 3) returns to normal.
Transformations
Grafana transformations are now in beta. While most should work, the variety means some may need further tuning—stay tuned for updates.
Transformation support is evolving due to Grafana’s extensive options.
Grafana Health Check Enhancements
The BI Engine relies on Grafana, but startup timing can vary. If Grafana lags, the BI Engine might fail its health check and shut down. New retry and timeout parameters prevent this, with a default wait of 5 seconds—customizable as needed.
##
## Service Account
## - Viewer permission is required to access dashboards
## - Editor permission is required to access dashboards and add Annotations
##
GRAFANA_TOKEN=SERVICE-ACCOUNT-TOKEN

##
## Grafana HTTP API
##
GRAFANA_URL=http://grafana:3000

##
## Grafana Health-Check timeout, ms
## Waiting for Grafana availability for (Timeout * Number of Retries / 1000 ) seconds
##
GRAFANA_HEALTH_CHECK_TIMEOUT=1000

##
## Grafana Health-Check number of retries
##
GRAFANA_HEALTH_CHECK_RETRY=5
Getting Started
The Business Intelligence platform uses Docker containers to deliver a modular, scalable solution. Our Quick Start guide provides a simplest setup to get started.
We’d Love to Hear From You!
Have feedback or ideas? Get involved:
- Questions, Features, or Bugs: Open a Zendesk ticket for a prompt and dedicated response from our team.
- Join the Conversation: Subscribe to our YouTube Channel and share your thoughts in the comments.
Your input helps us improve, so don’t hesitate to get in touch!