Business Intelligence 1.6.0: Variables, Prometheus, and Alert History


We’re excited to unveil Business Intelligence 1.6.0, a significant release from Volkov Labs that marks a major step forward for the Business Intelligence platform. Transitioning from a proof-of-concept to a robust development milestone, this update introduces powerful features and enhancements, including:
- Dashboard variables for streamlined alerting.
- Prometheus data source integration.
- Built-in Prometheus monitoring for system health.
- Enhanced UI functionality for better user experience.
- New Alert History visualization for deeper insights.
Take a quick look at what’s new:
Dashboard Variables for Flexible Alerting
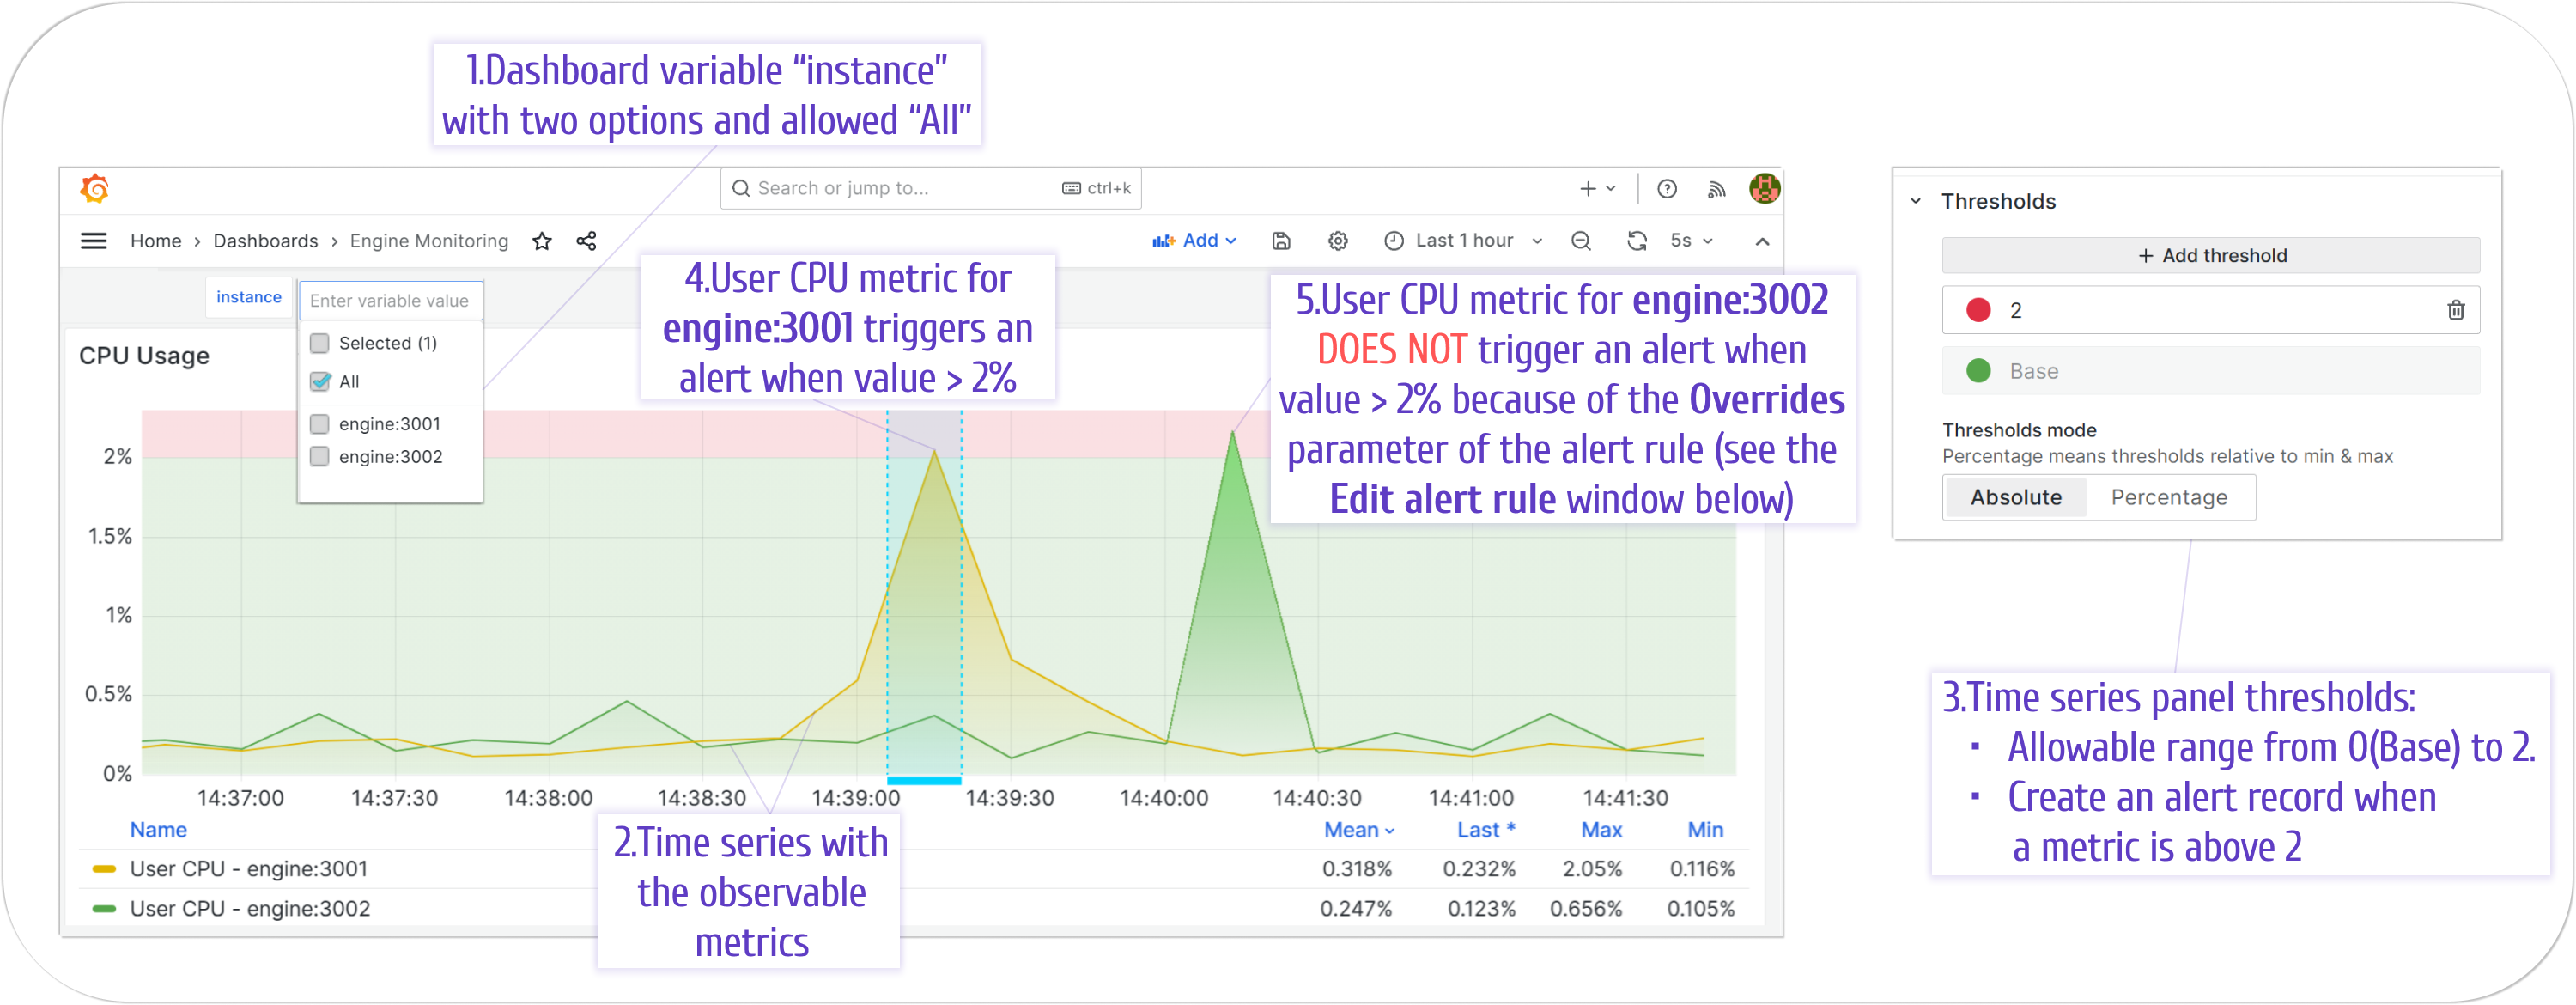
Dashboard variables revolutionize alert configuration by enabling dynamic and scalable setups. Consider a scenario where you’re monitoring multiple devices with varying CPU thresholds (e.g., 0-2% for some, over 2% for others). Without variables, you’d need separate alert rules for each device—a manageable task for a few, but a daunting challenge for hundreds.
With Business Intelligence 1.6.0, a single alert rule combined with variable-driven Overrides can handle diverse thresholds effortlessly. See it in action in a Time Series panel:
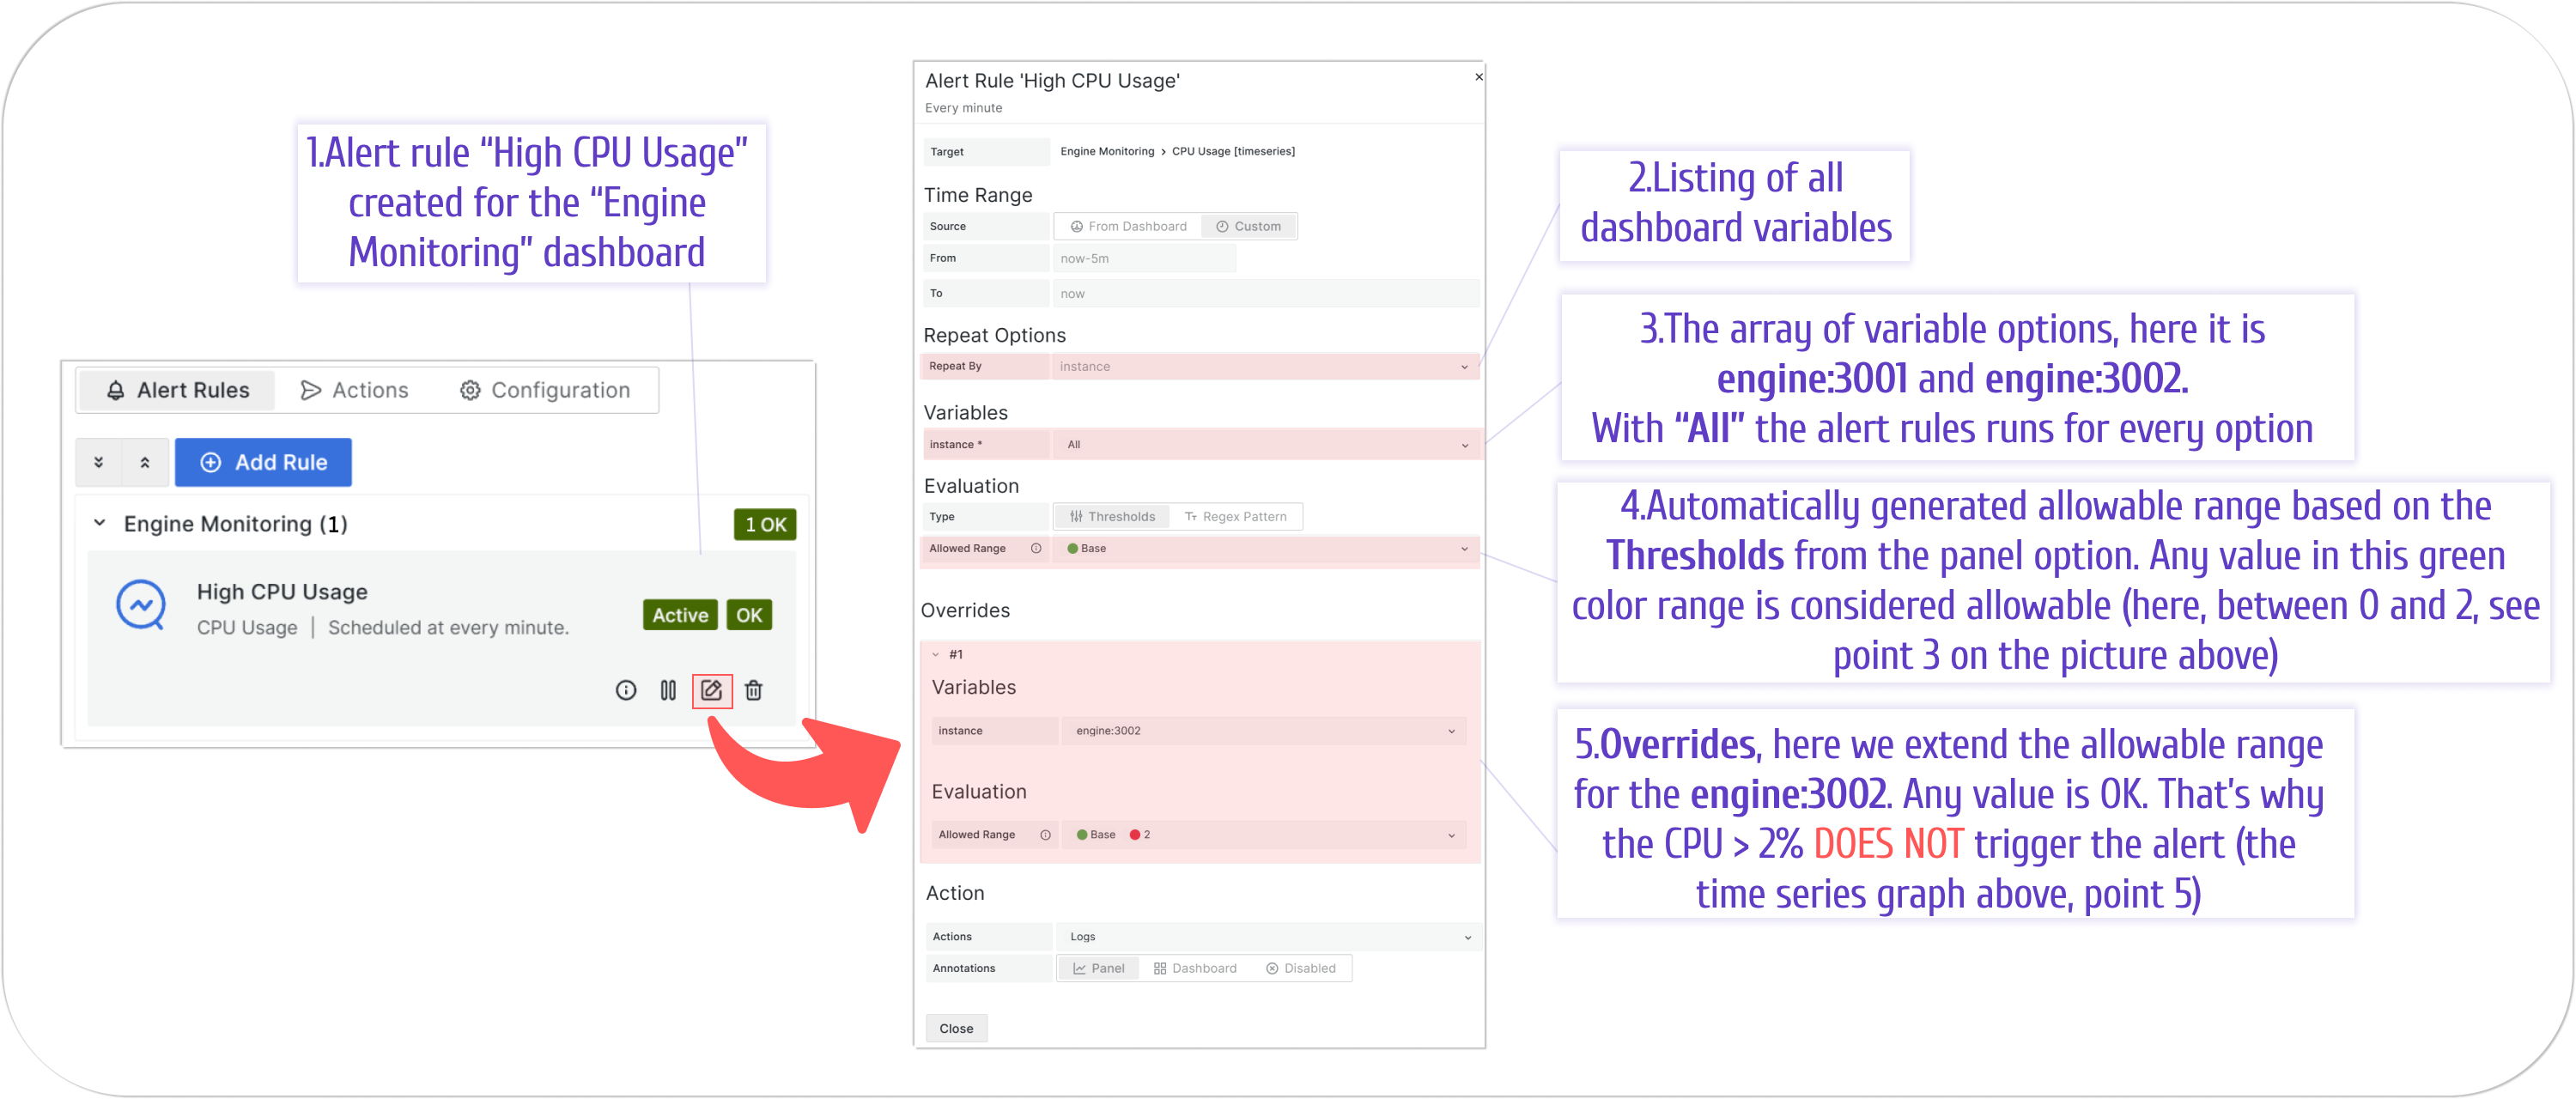
Here’s how the rule setup looks with variables:
Prometheus Data Source Support
This release brings full variable support for the Prometheus data source, ensuring seamless integration. We’re actively working to extend this capability to other popular data sources in future updates.
Built-In Prometheus Monitoring
Keep a close eye on the BI Engine itself with our new Prometheus middleware and a dedicated monitoring container. This built-in solution collects critical system health metrics, which you can visualize using a pre-built dashboard. It’s an ideal way to monitor the system that powers your observability.
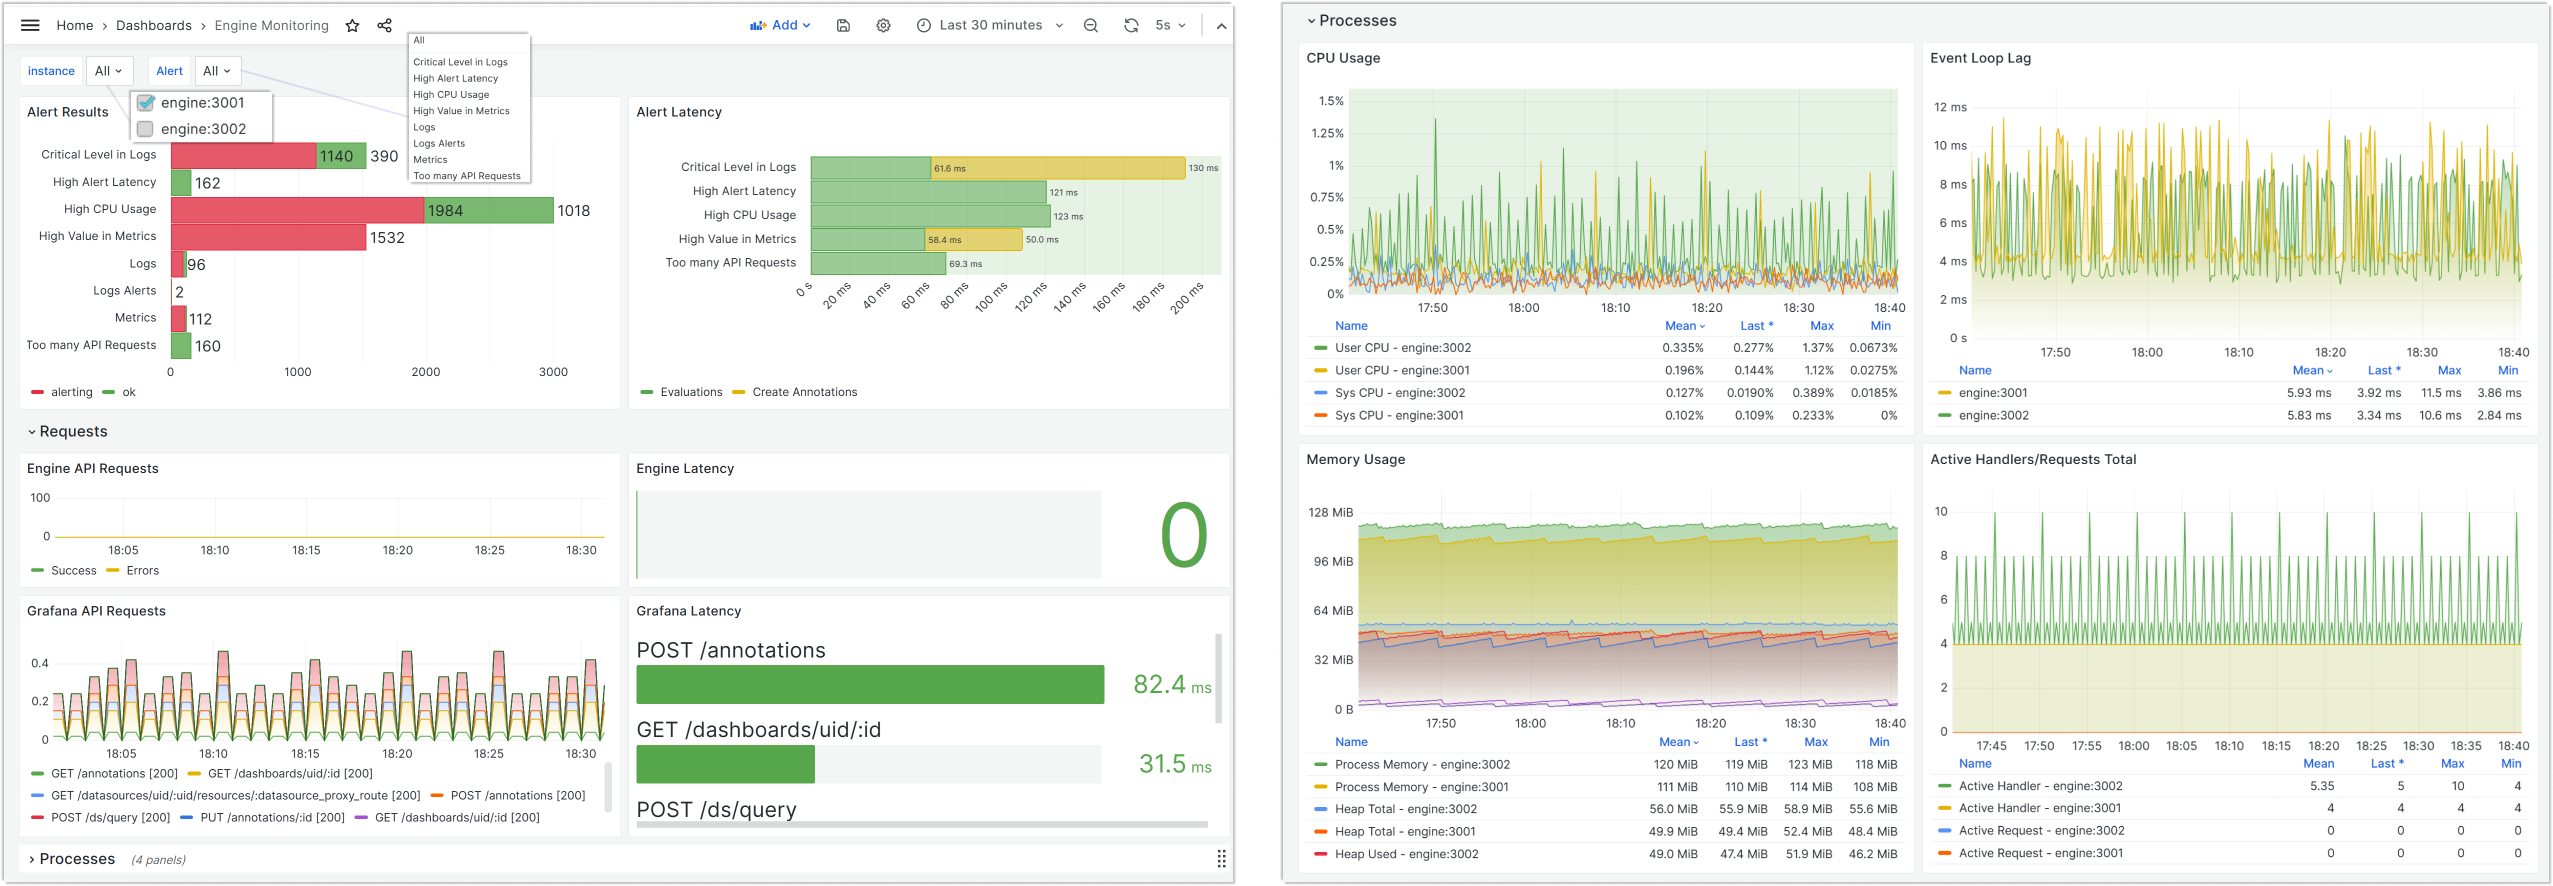
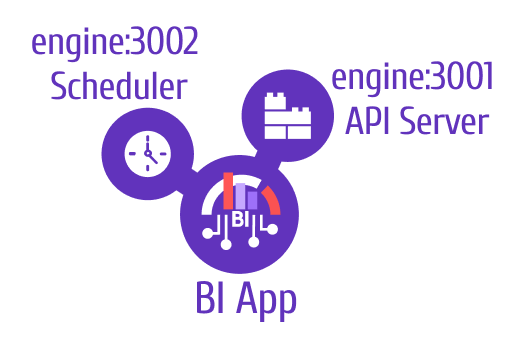
The BI Engine comprises two key components, each exposing metrics for monitoring:
- API Server: Accessible at
engine:3001 - Scheduler: Accessible at
engine:3002
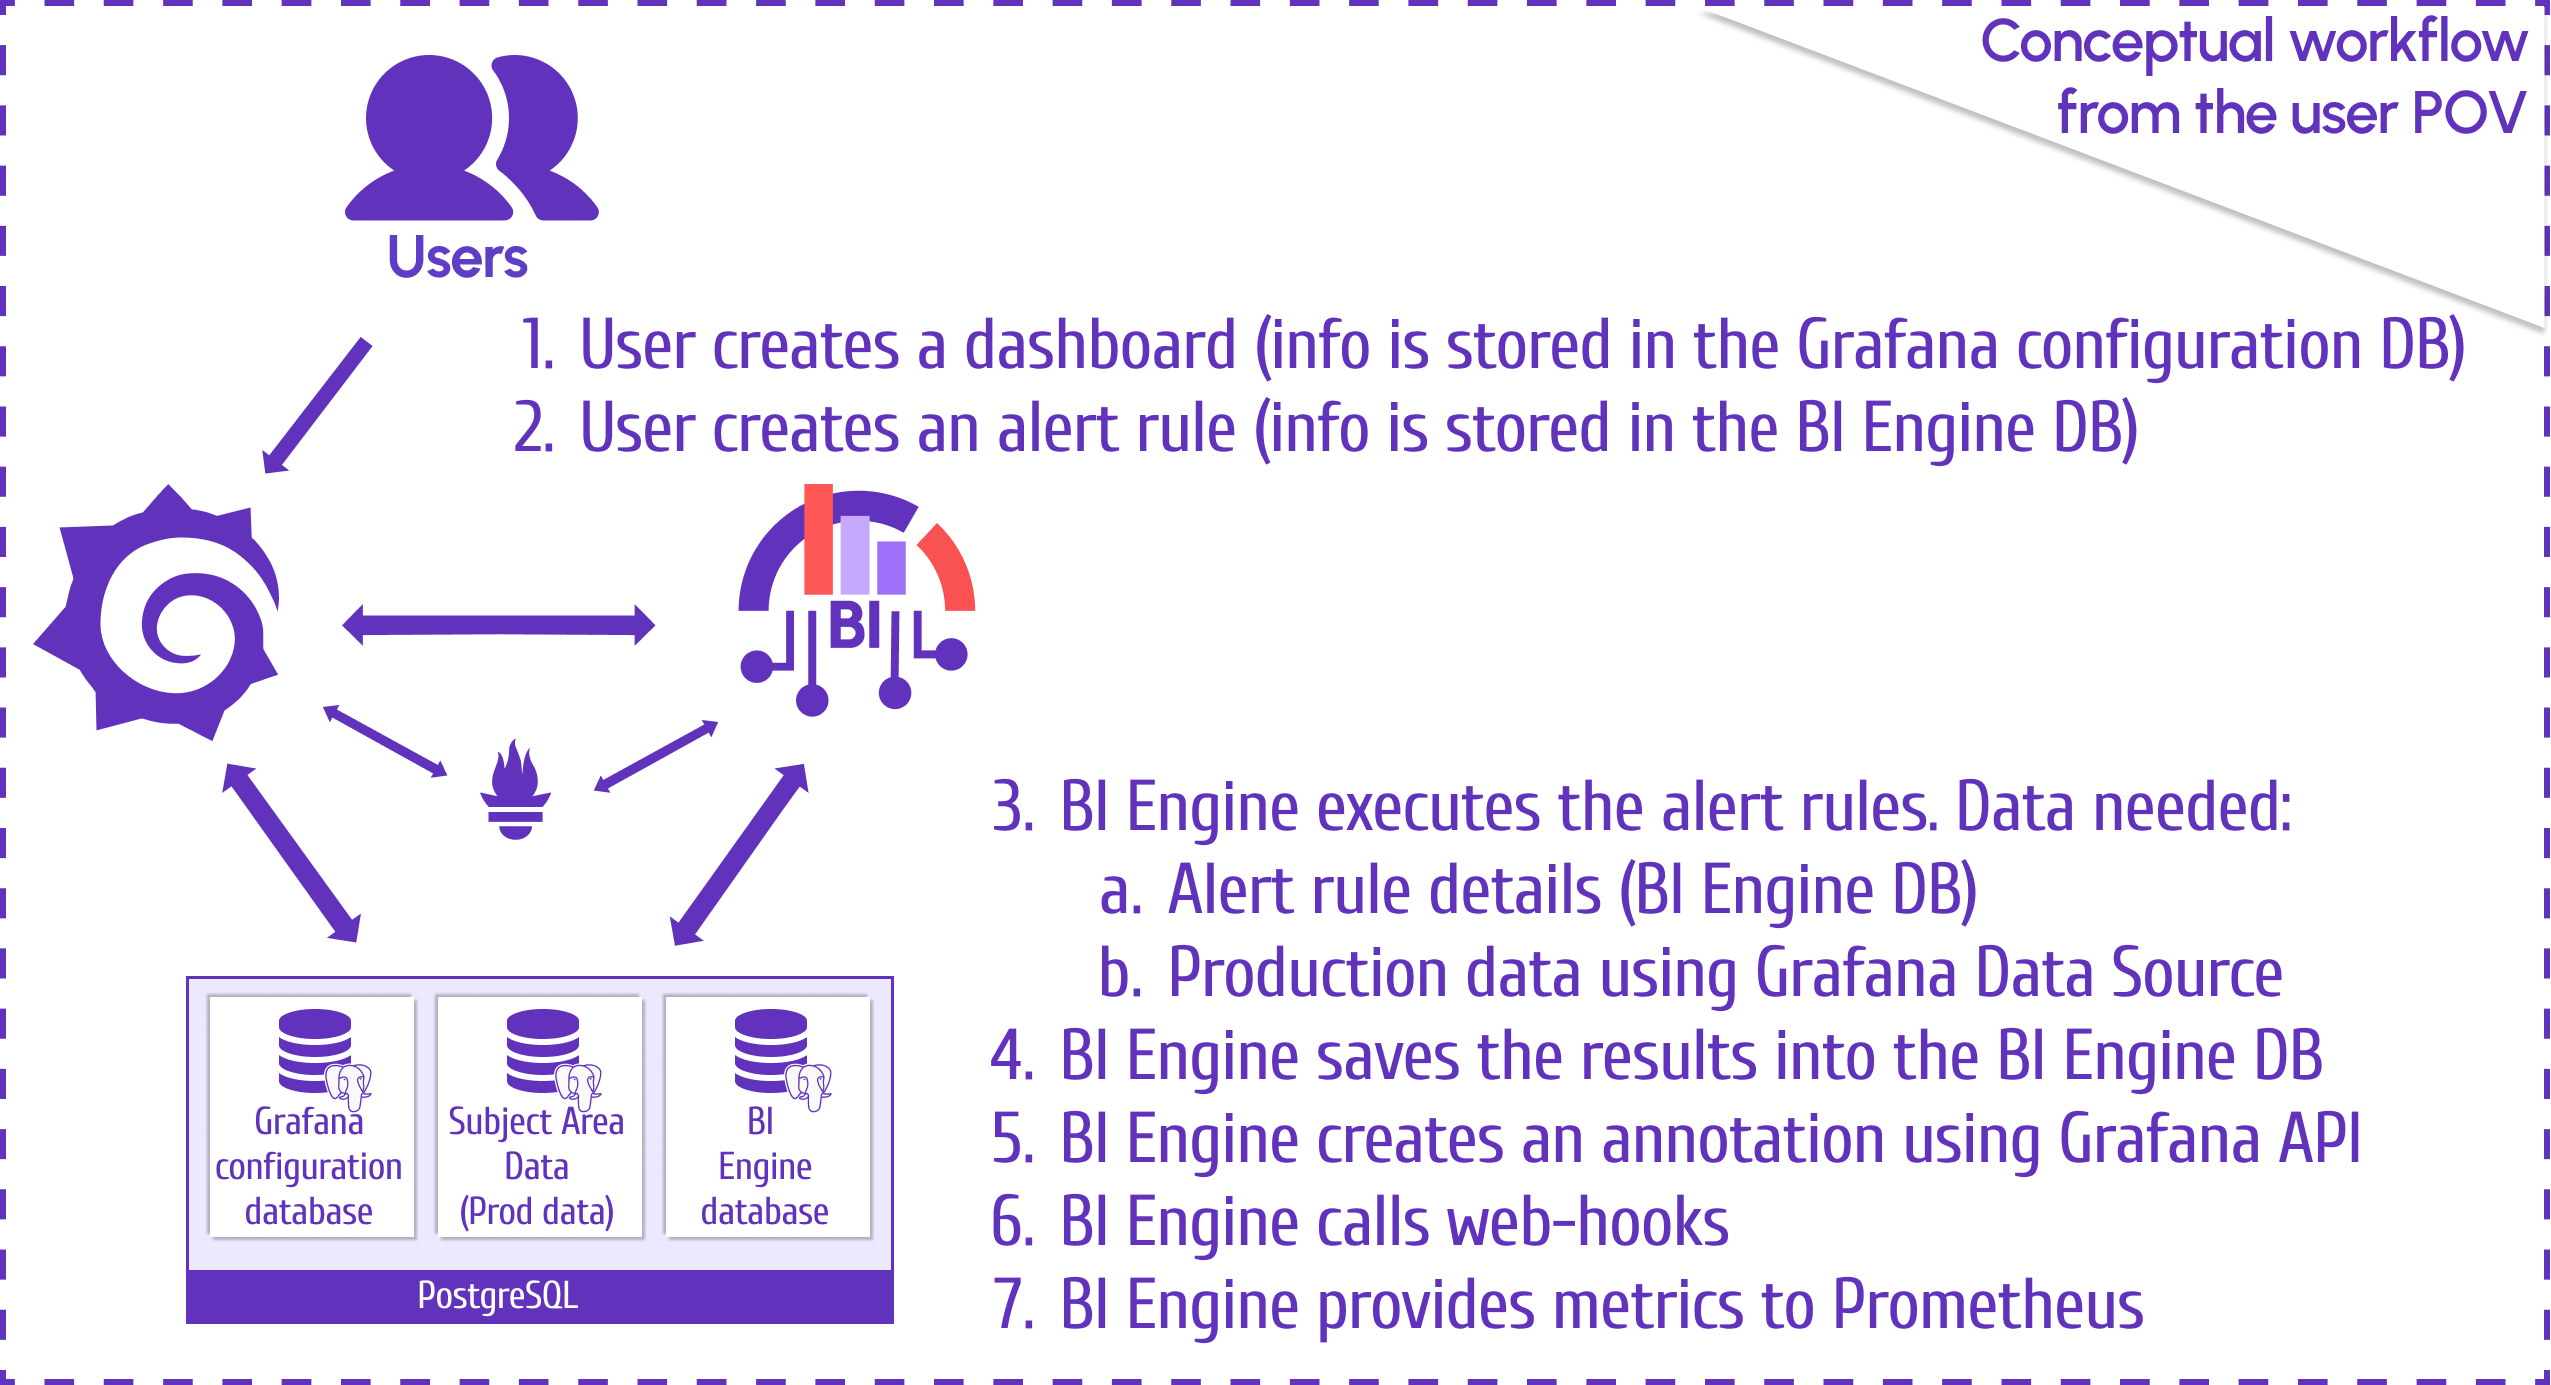
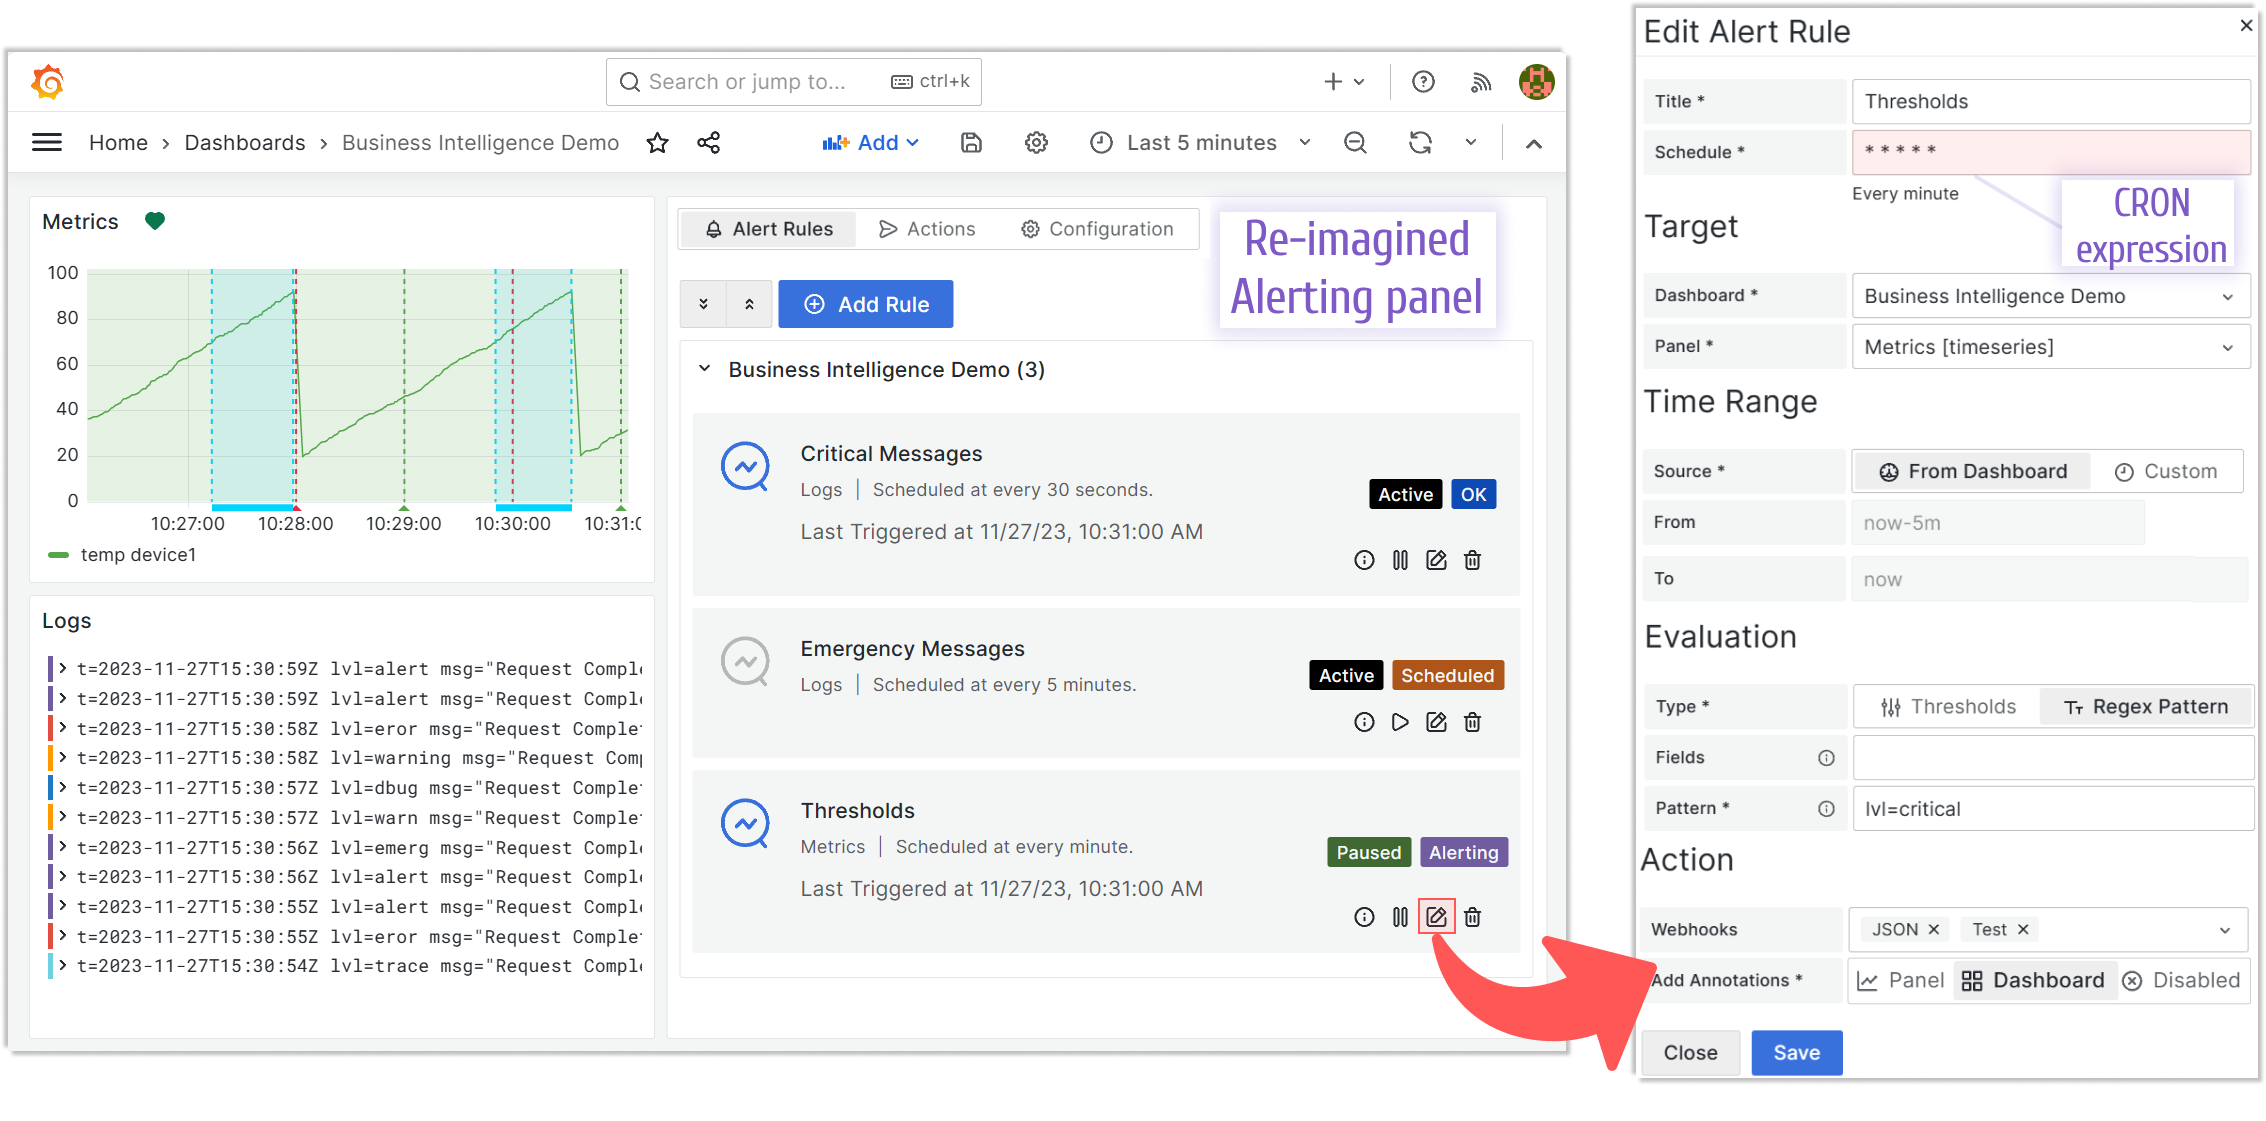
Streamlined Alert Rules Workflow
The user-facing alert workflow is now more intuitive, with Prometheus enabling detailed troubleshooting and system reporting behind the scenes:
Enhanced User Interface Features
Actions Page
We’ve renamed the Webhooks section to Actions to better reflect standard alerting terminology (Alert rule → Alert record → Alert action).
Annotations Support
In Edit mode under the Action category, the new Add Annotations option allows you to attach annotations to a specific panel or the entire dashboard, providing greater flexibility in alert documentation.
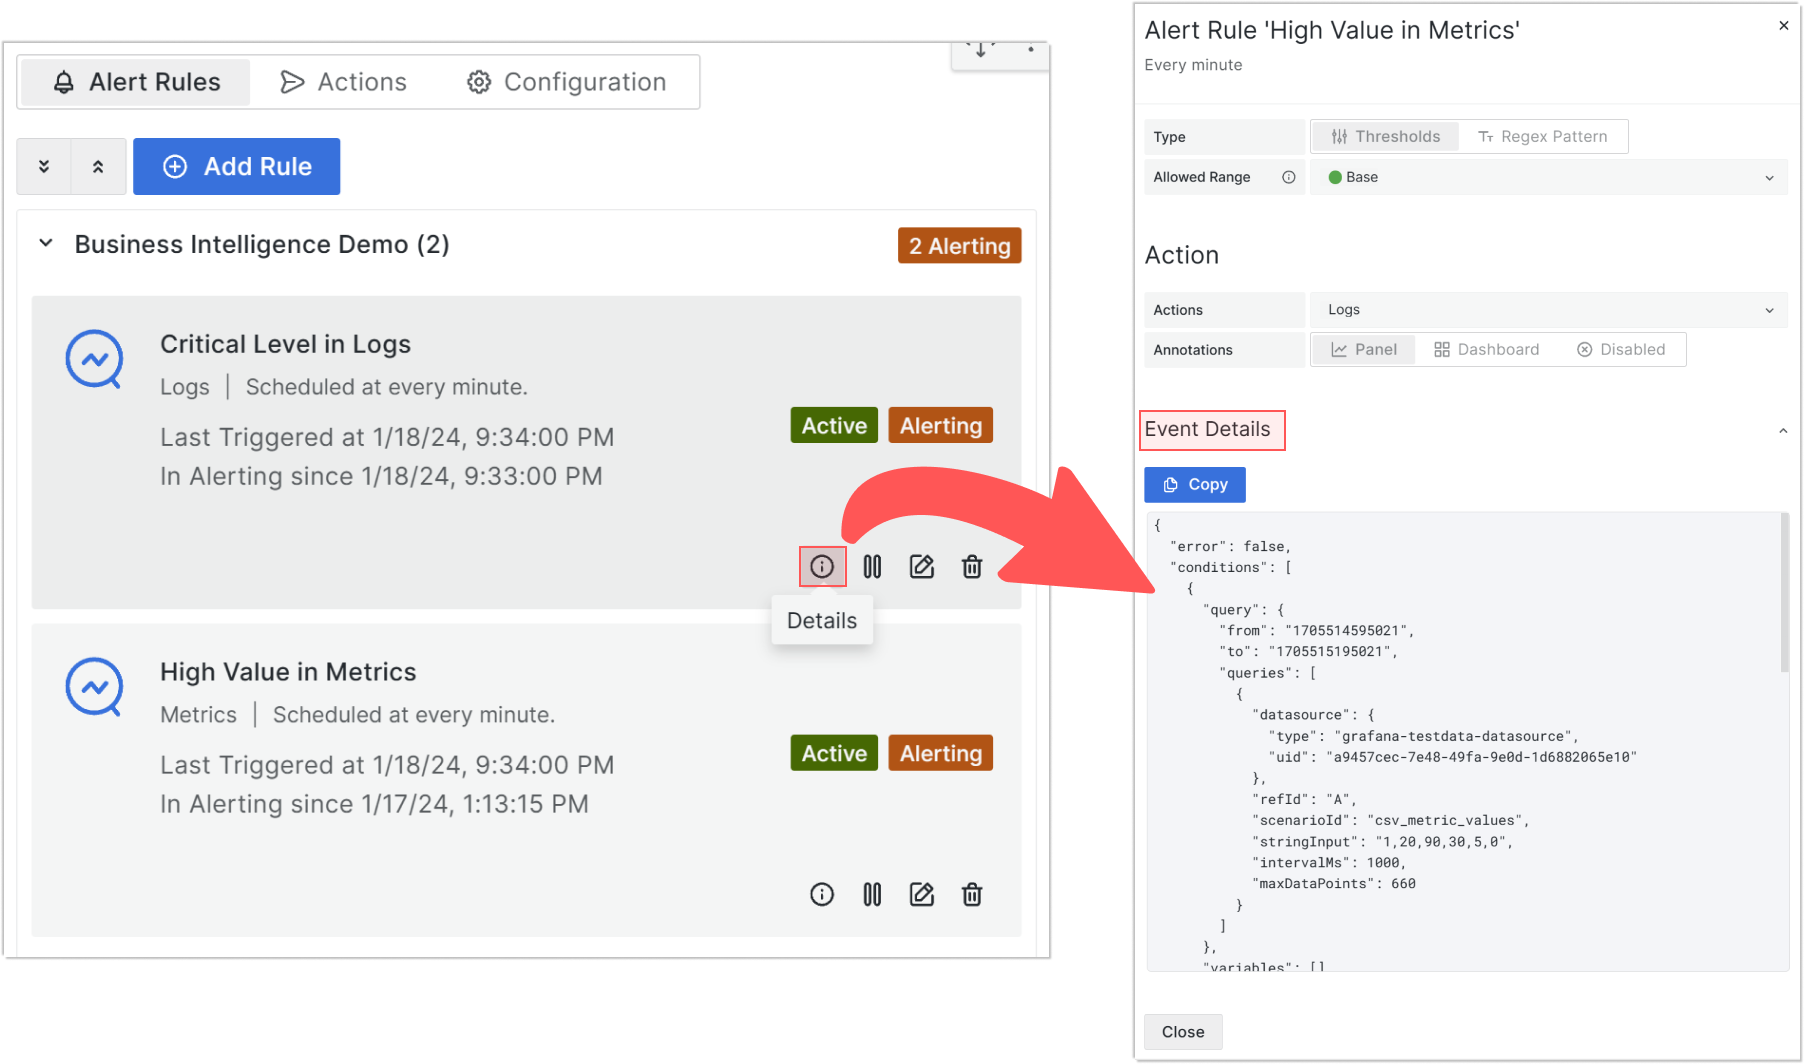
Event Details View
For alert rules in Alerting or Error states, you can now click Details on an alert card and expand the Event Details section to dive into specific information about the event.
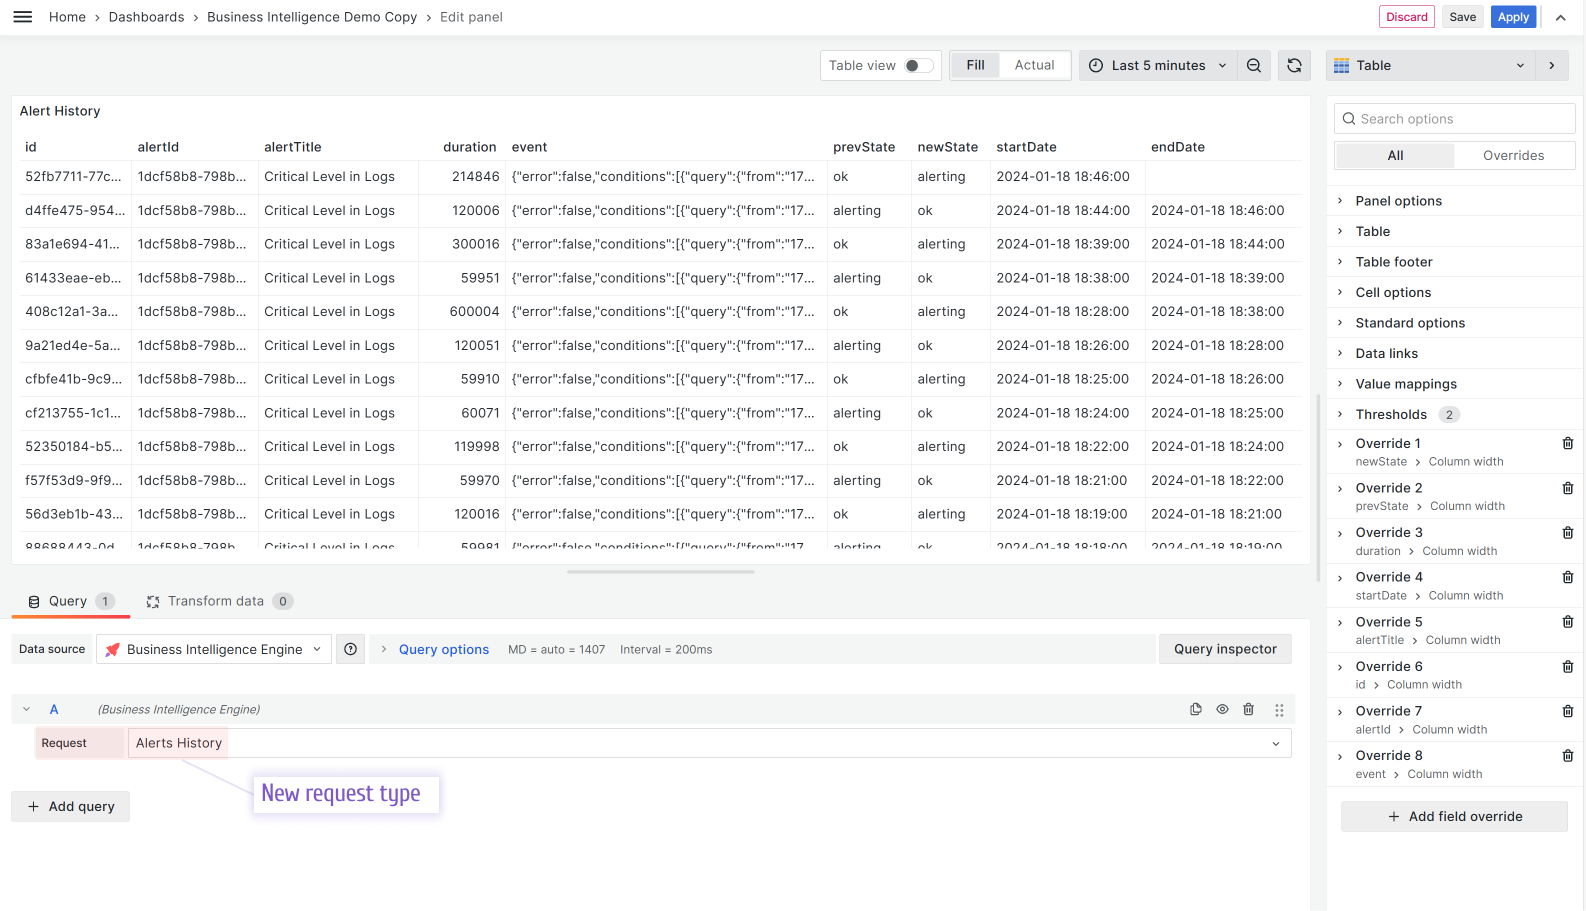
Alert History Visualization
A new Alerts History option in the BI Engine data source’s Request parameter allows you to retrieve and display alert history in any visualization panel. For example, here’s how it looks in a Table view:
Getting Started
Business Intelligence Platform is a powerful solution that harnesses Docker containers to deliver a modular, scalable, and user-friendly environment for alert-driven analytics. Whether you're just starting out or are an experienced user, our Quick Start Guide is designed to help you set up and deploy the platform effortlessly.
This guide provides a step-by-step walkthrough of the essential setup process, ensuring you can get up and running in no time. Key topics include:
- Configuring the Business Engine: Understand how to set up the core component that powers your analytics.
- Launching the Business Studio: Deploy and access the intuitive interface on your local machine for seamless management and visualization.
We’d Love to Hear From You!
Your feedback and ideas are invaluable to us! Here’s how you can get involved:
- Questions, Feature Requests, or Bugs: Submit a Zendesk ticket to receive a swift and personalized response from our dedicated support team.
- Join the Community: Subscribe to our YouTube Channel and share your thoughts or suggestions in the comments.
Your input is crucial in helping us grow and improve, so please don’t hesitate to reach out!