Business Intelligence 1.6.0: Variables, Prometheus, and Alert History


We’re thrilled to announce Business Intelligence 1.6.0, a pivotal release from Volkov Labs that evolves the Business Intelligence platform from proof-of-concept to a robust development milestone. Key updates include:
- Dashboard variables support for streamlined alerting.
- Prometheus data source integration.
- Built-in Prometheus monitoring.
- Expanded UI functionality.
- New Alert History visualization.
Watch the overview:
Dashboard Variables Support
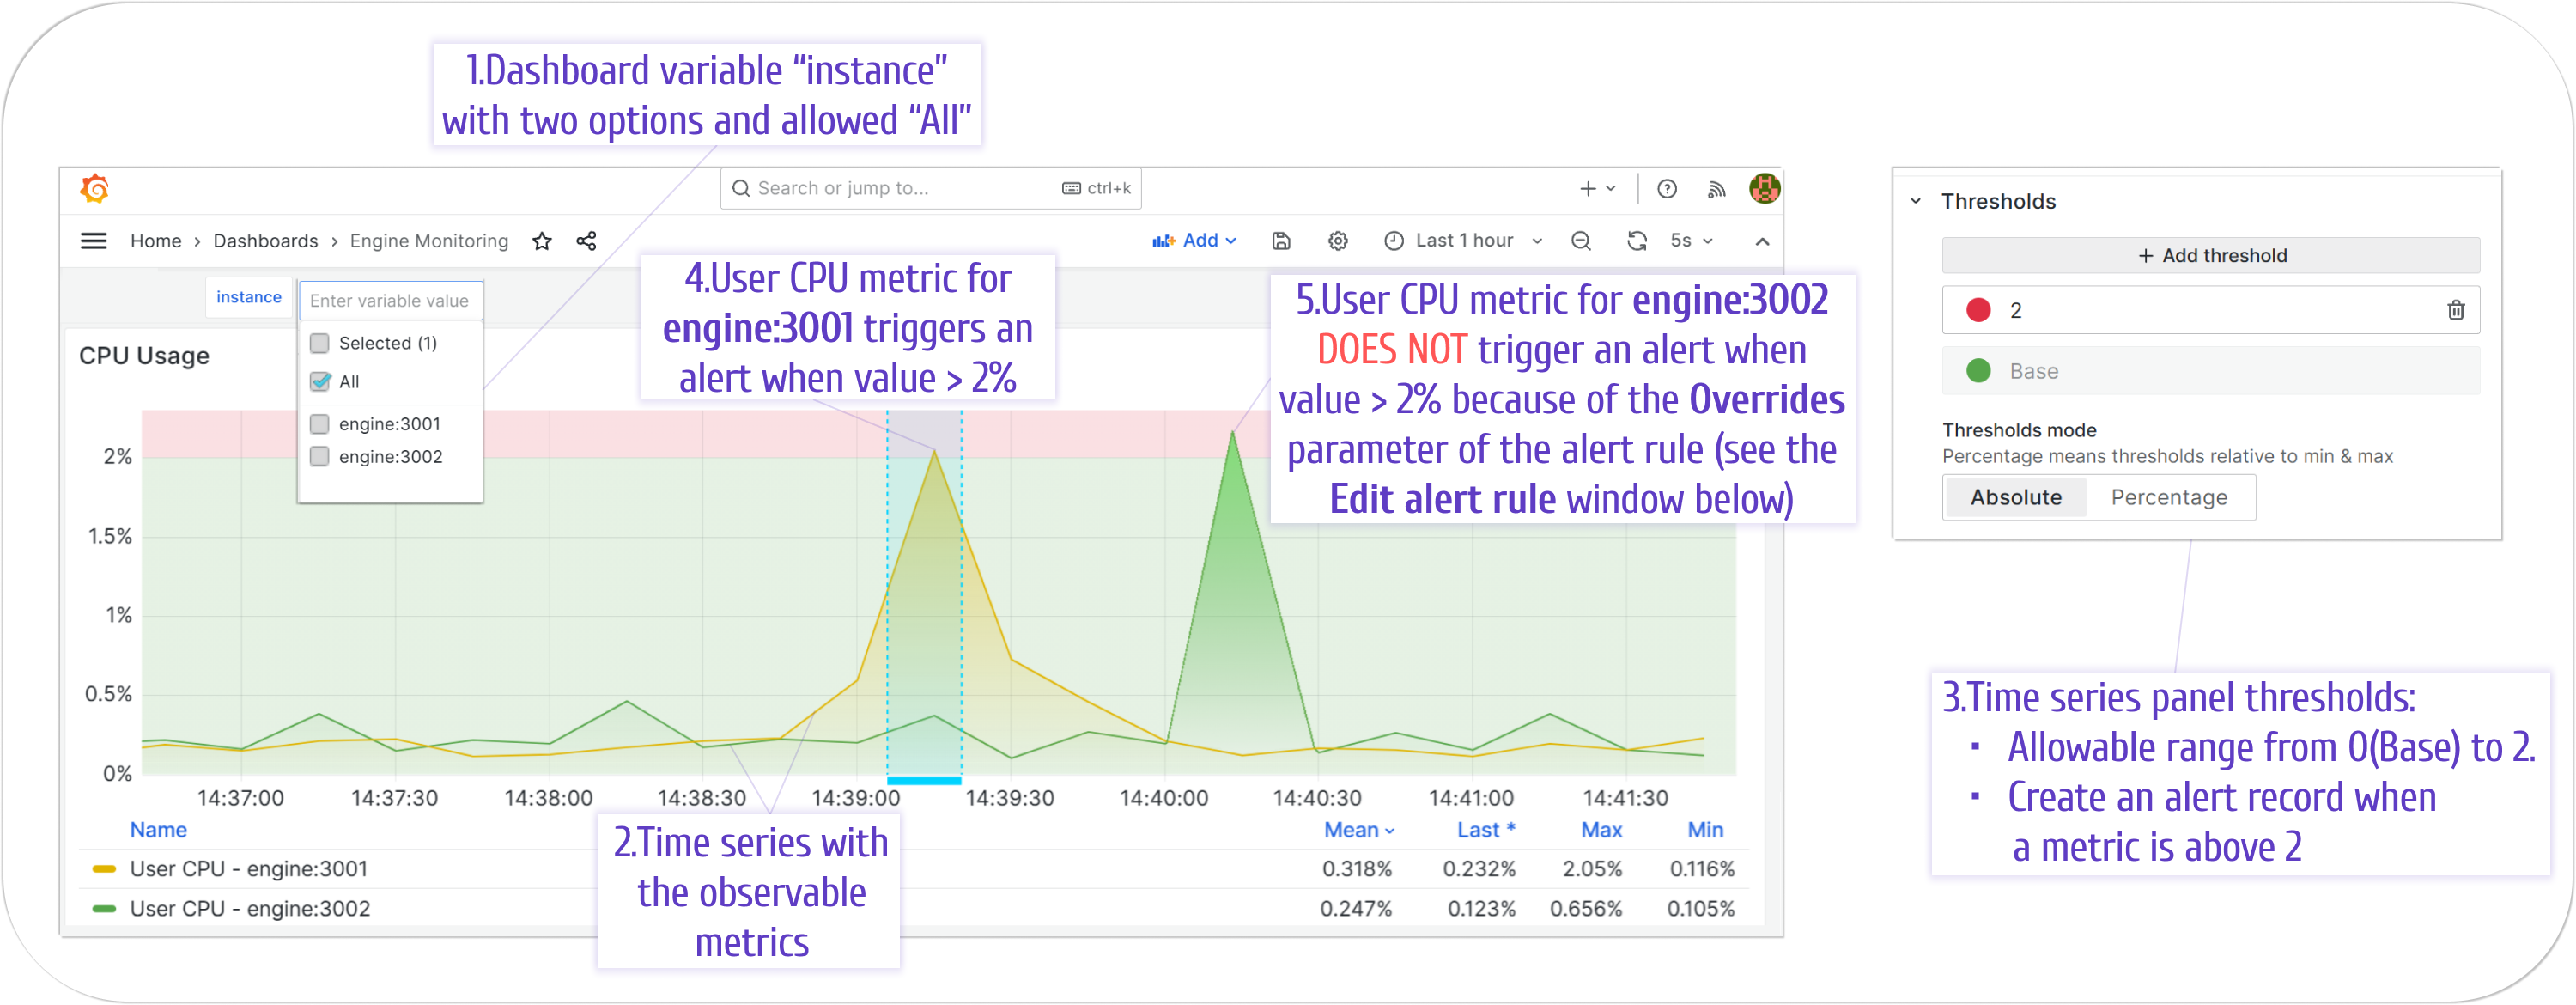
Variables transform alert configuration. Imagine monitoring two similar devices with slightly different CPU thresholds (e.g., 0-2% vs. over 2%). Without variables, you’d need separate rules for each—manageable for a few, but a nightmare for hundreds.
Now, one alert rule with variable-driven Overrides handles it all. Here’s how it looks in a Time Series panel:
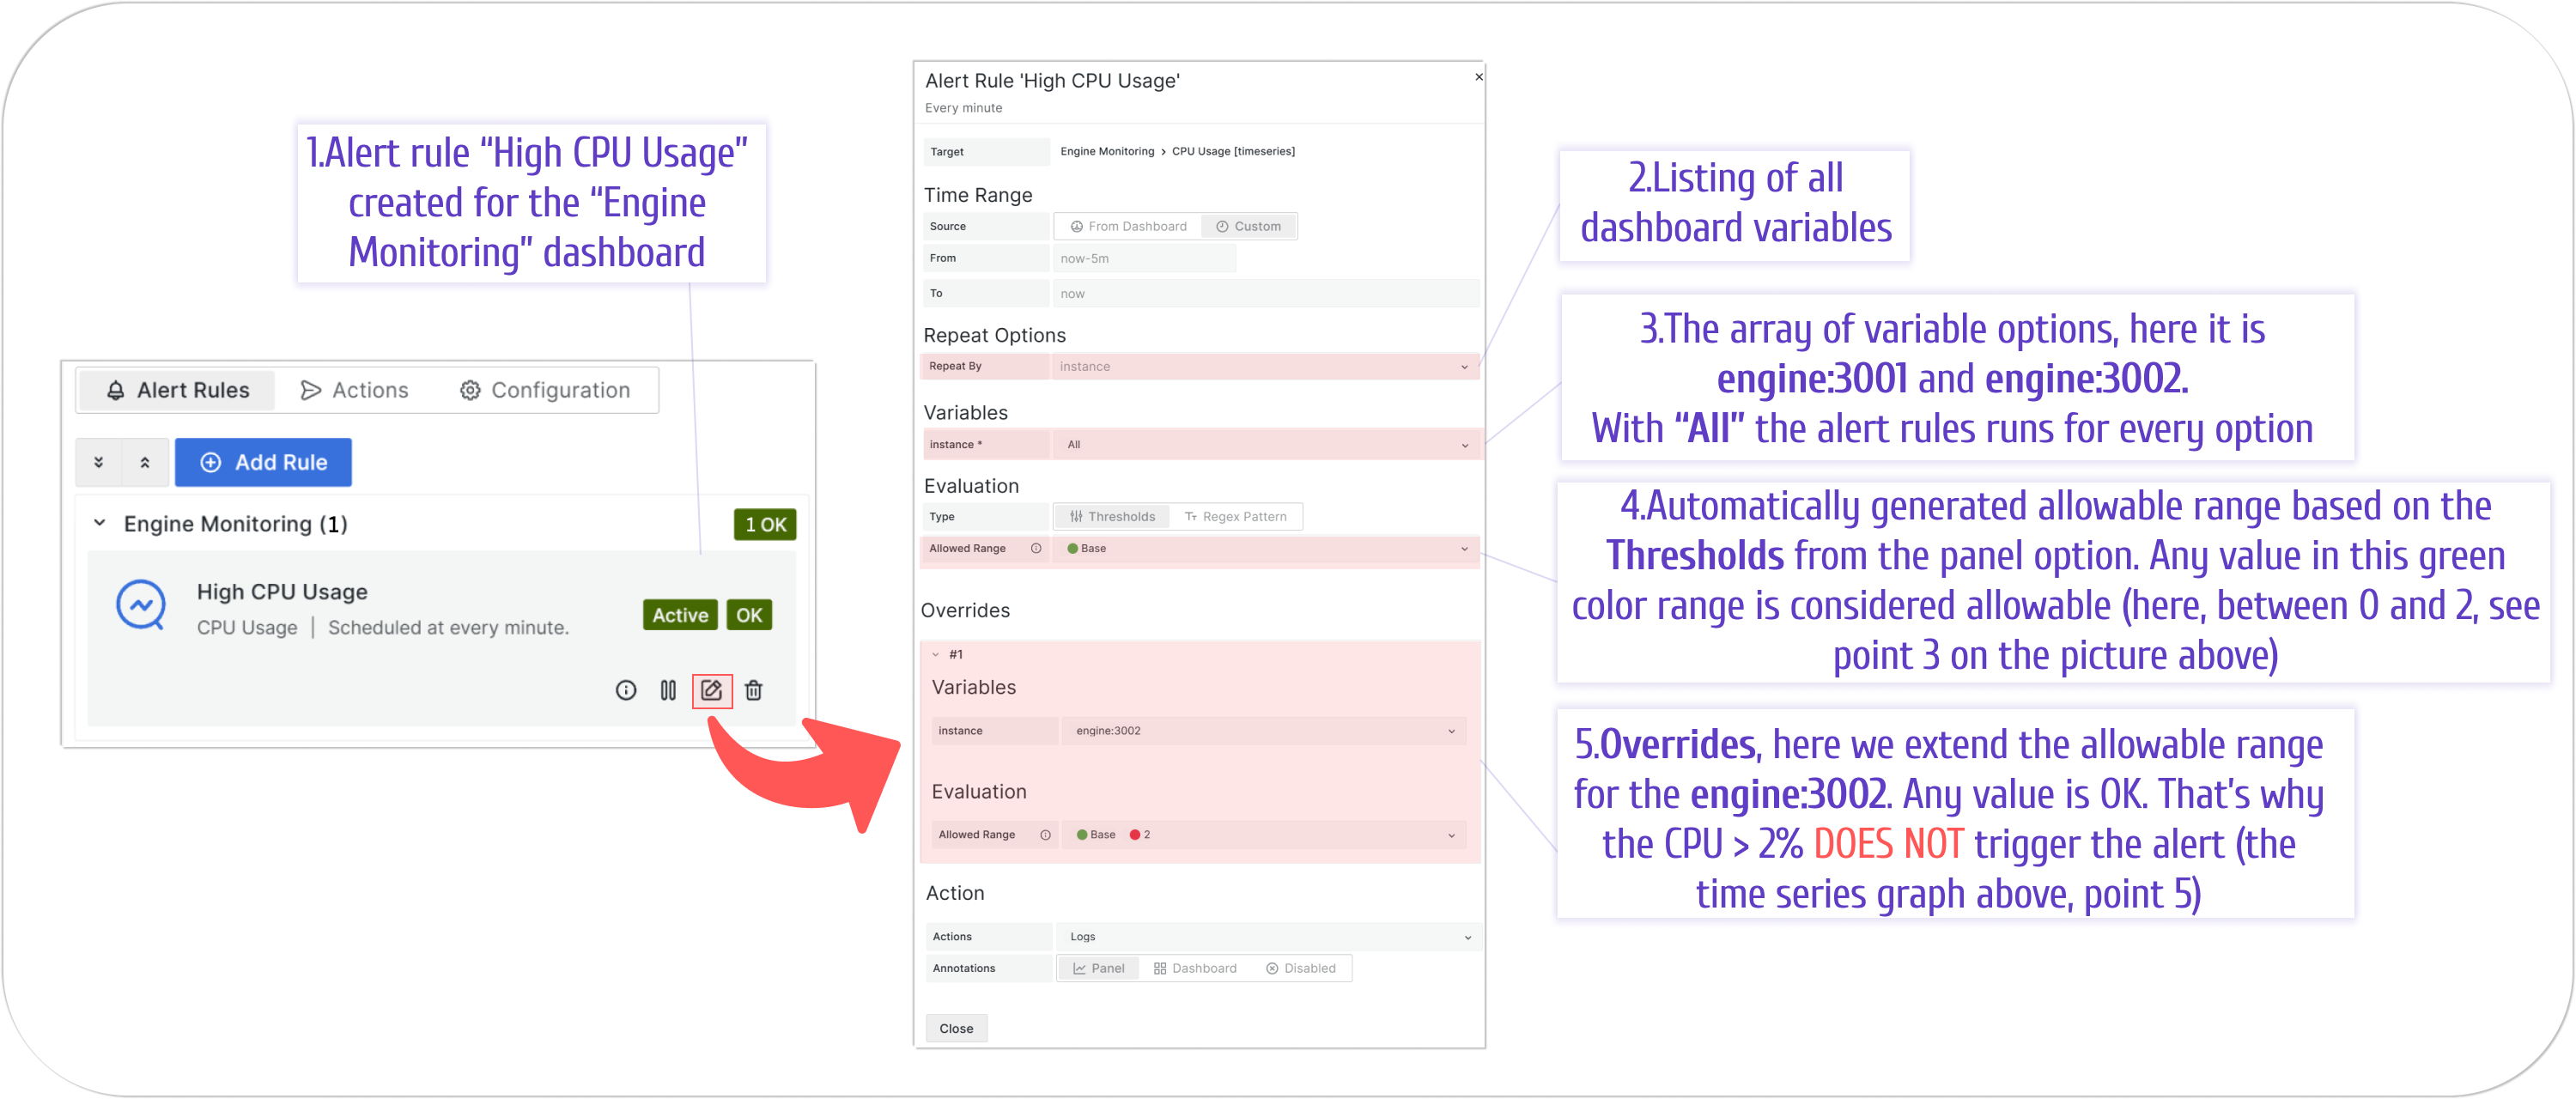
And the rule setup with variables:
Prometheus Data Source
This release ensures variable support for Prometheus, with plans to expand to other popular data sources soon.
Built-In Prometheus Monitoring
Monitor the BI Engine itself with new Prometheus middleware and a dedicated container. This built-in solution collects system health stats, viewable in a pre-built dashboard—perfect for observing your observability system.
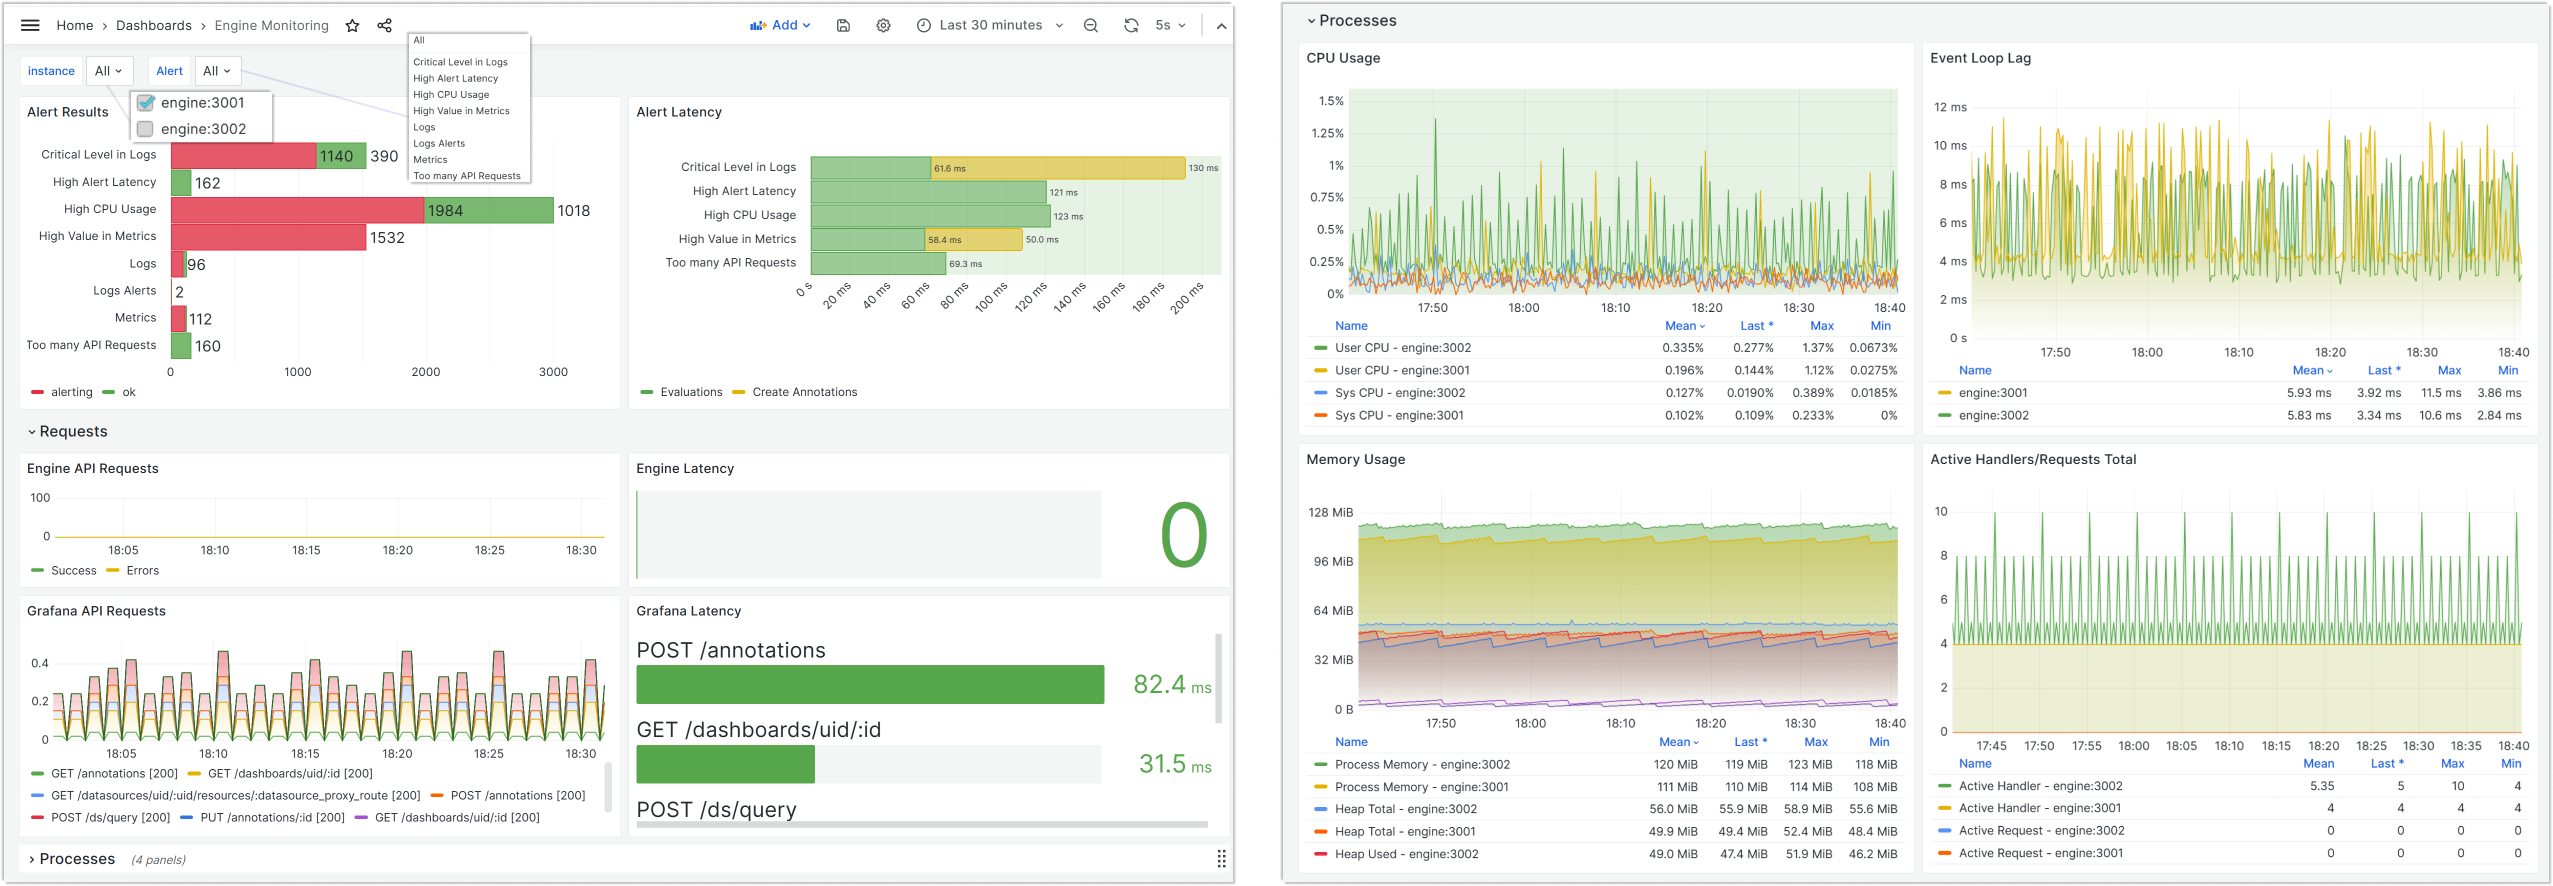
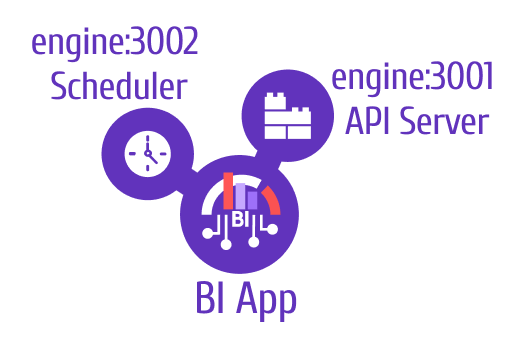
The BI Engine’s two components provide metrics:
- API Server:
engine:3001 - Scheduler:
engine:3002
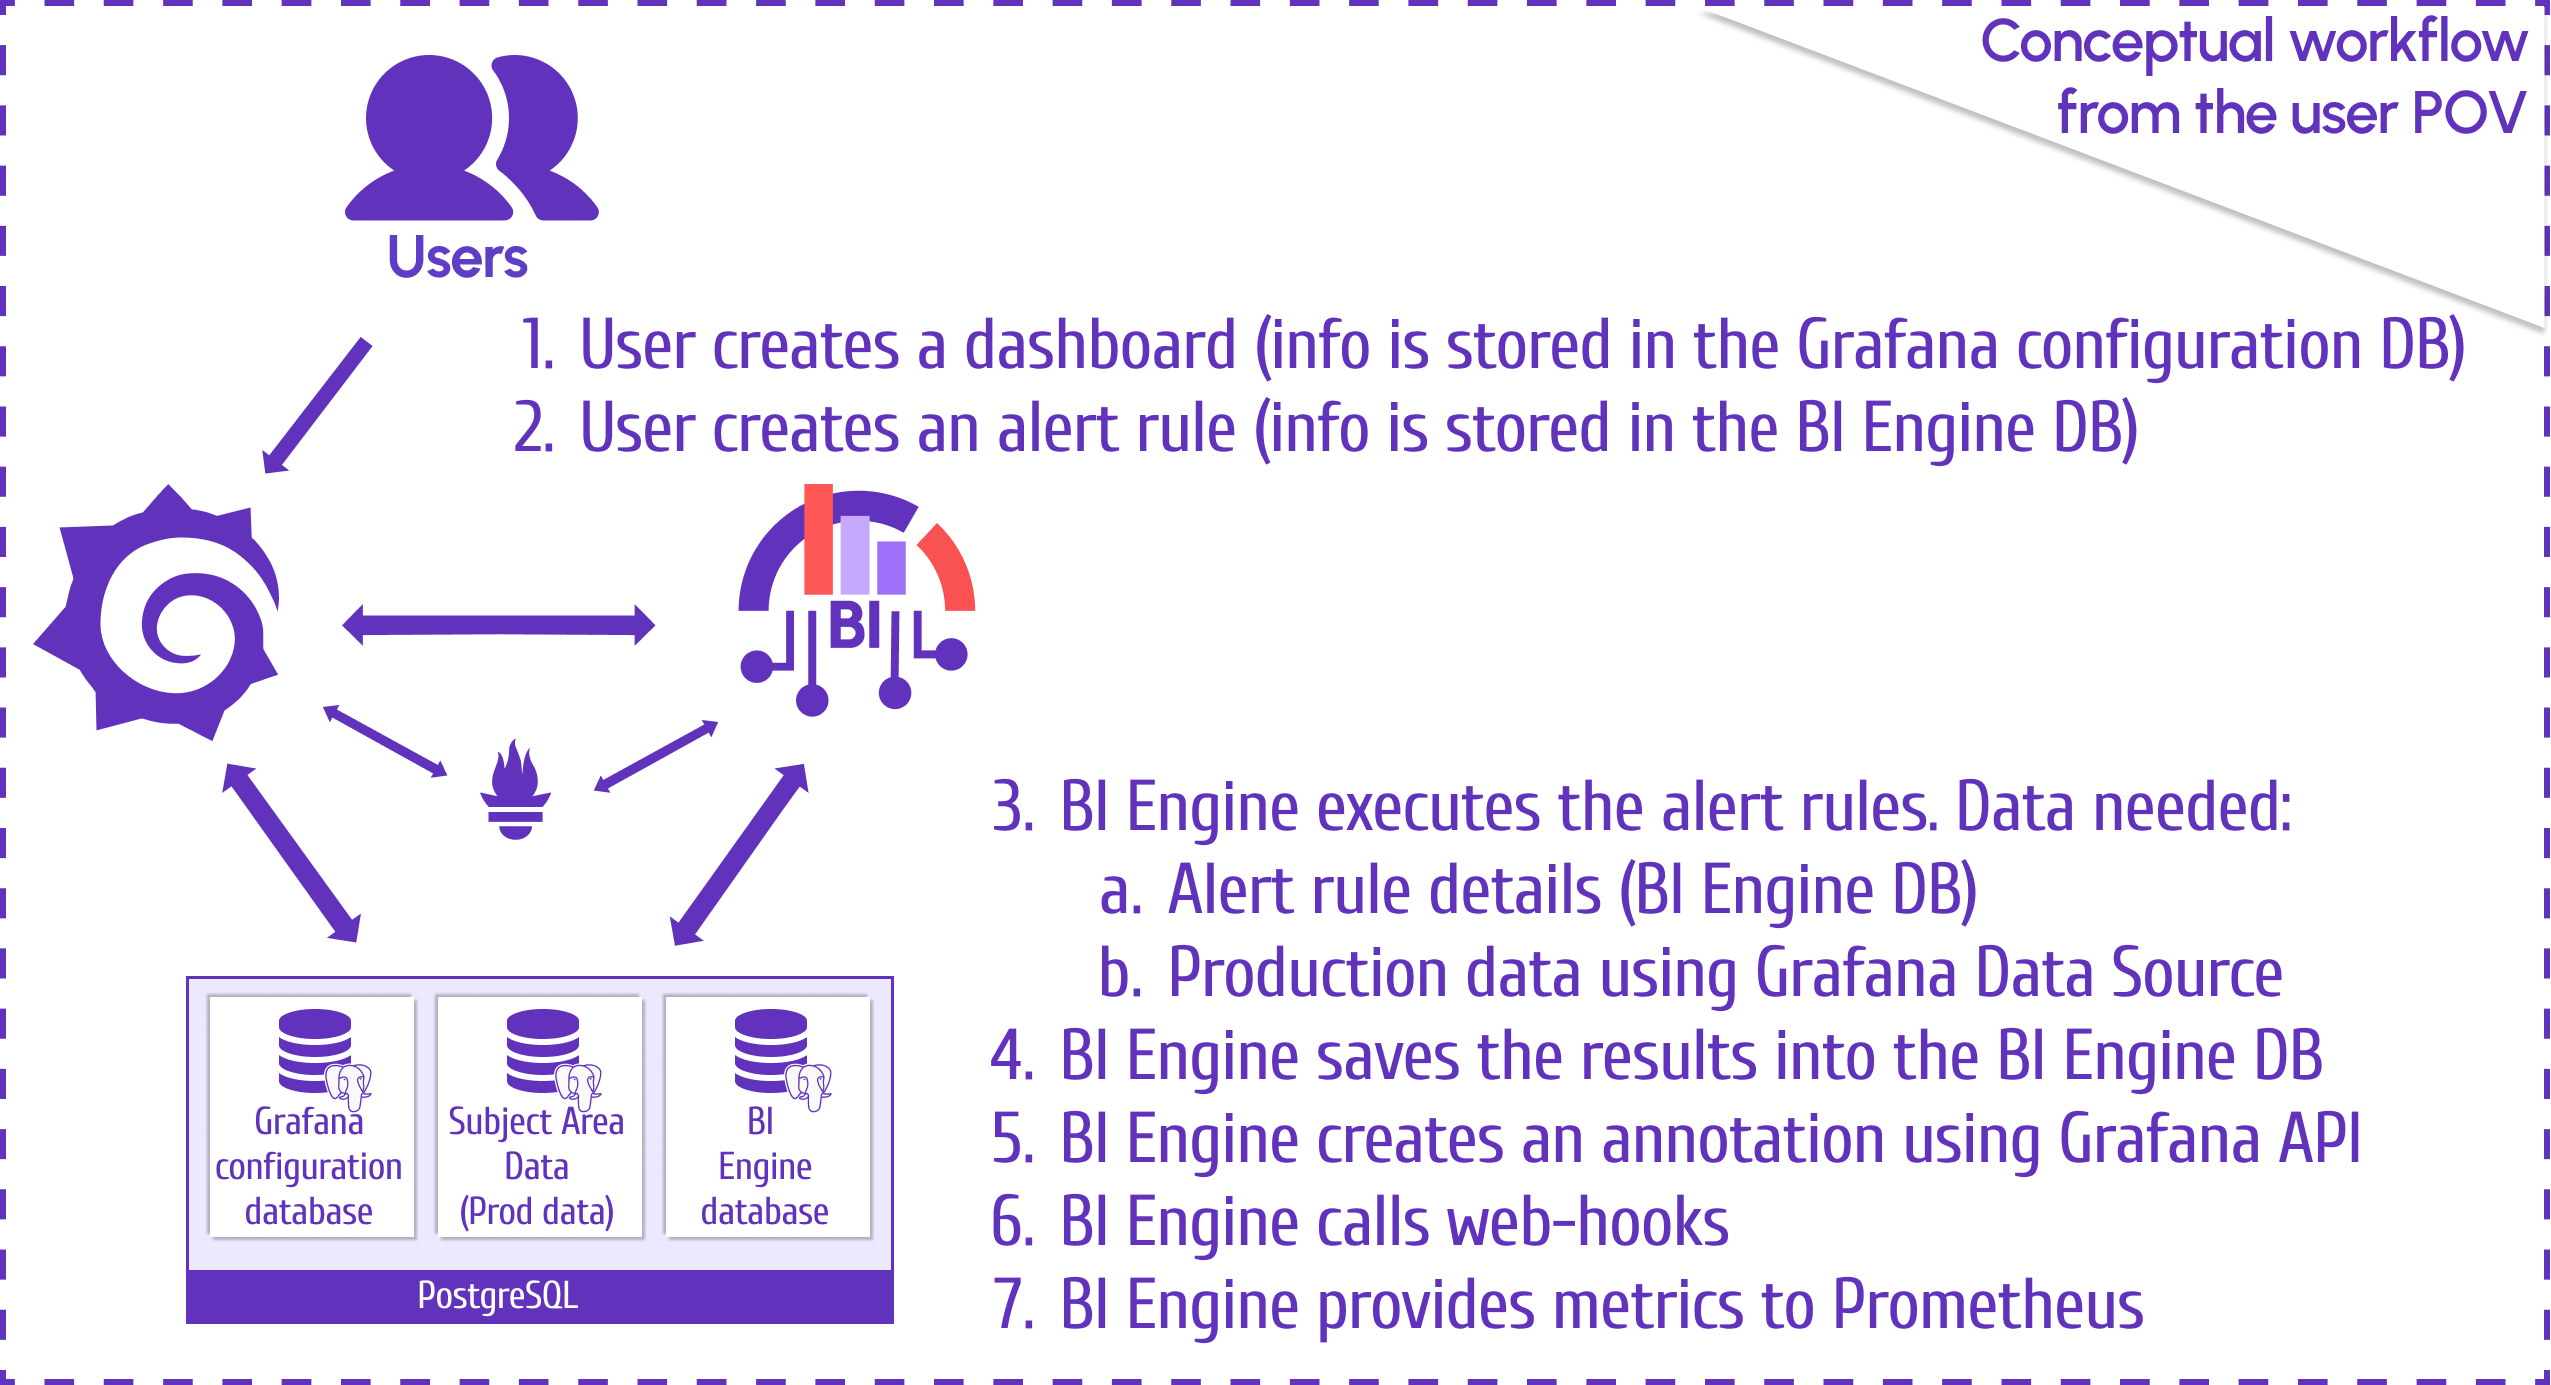
Alert Rules Workflow
Here’s the user-facing workflow, with Prometheus enabling troubleshooting and system reporting:
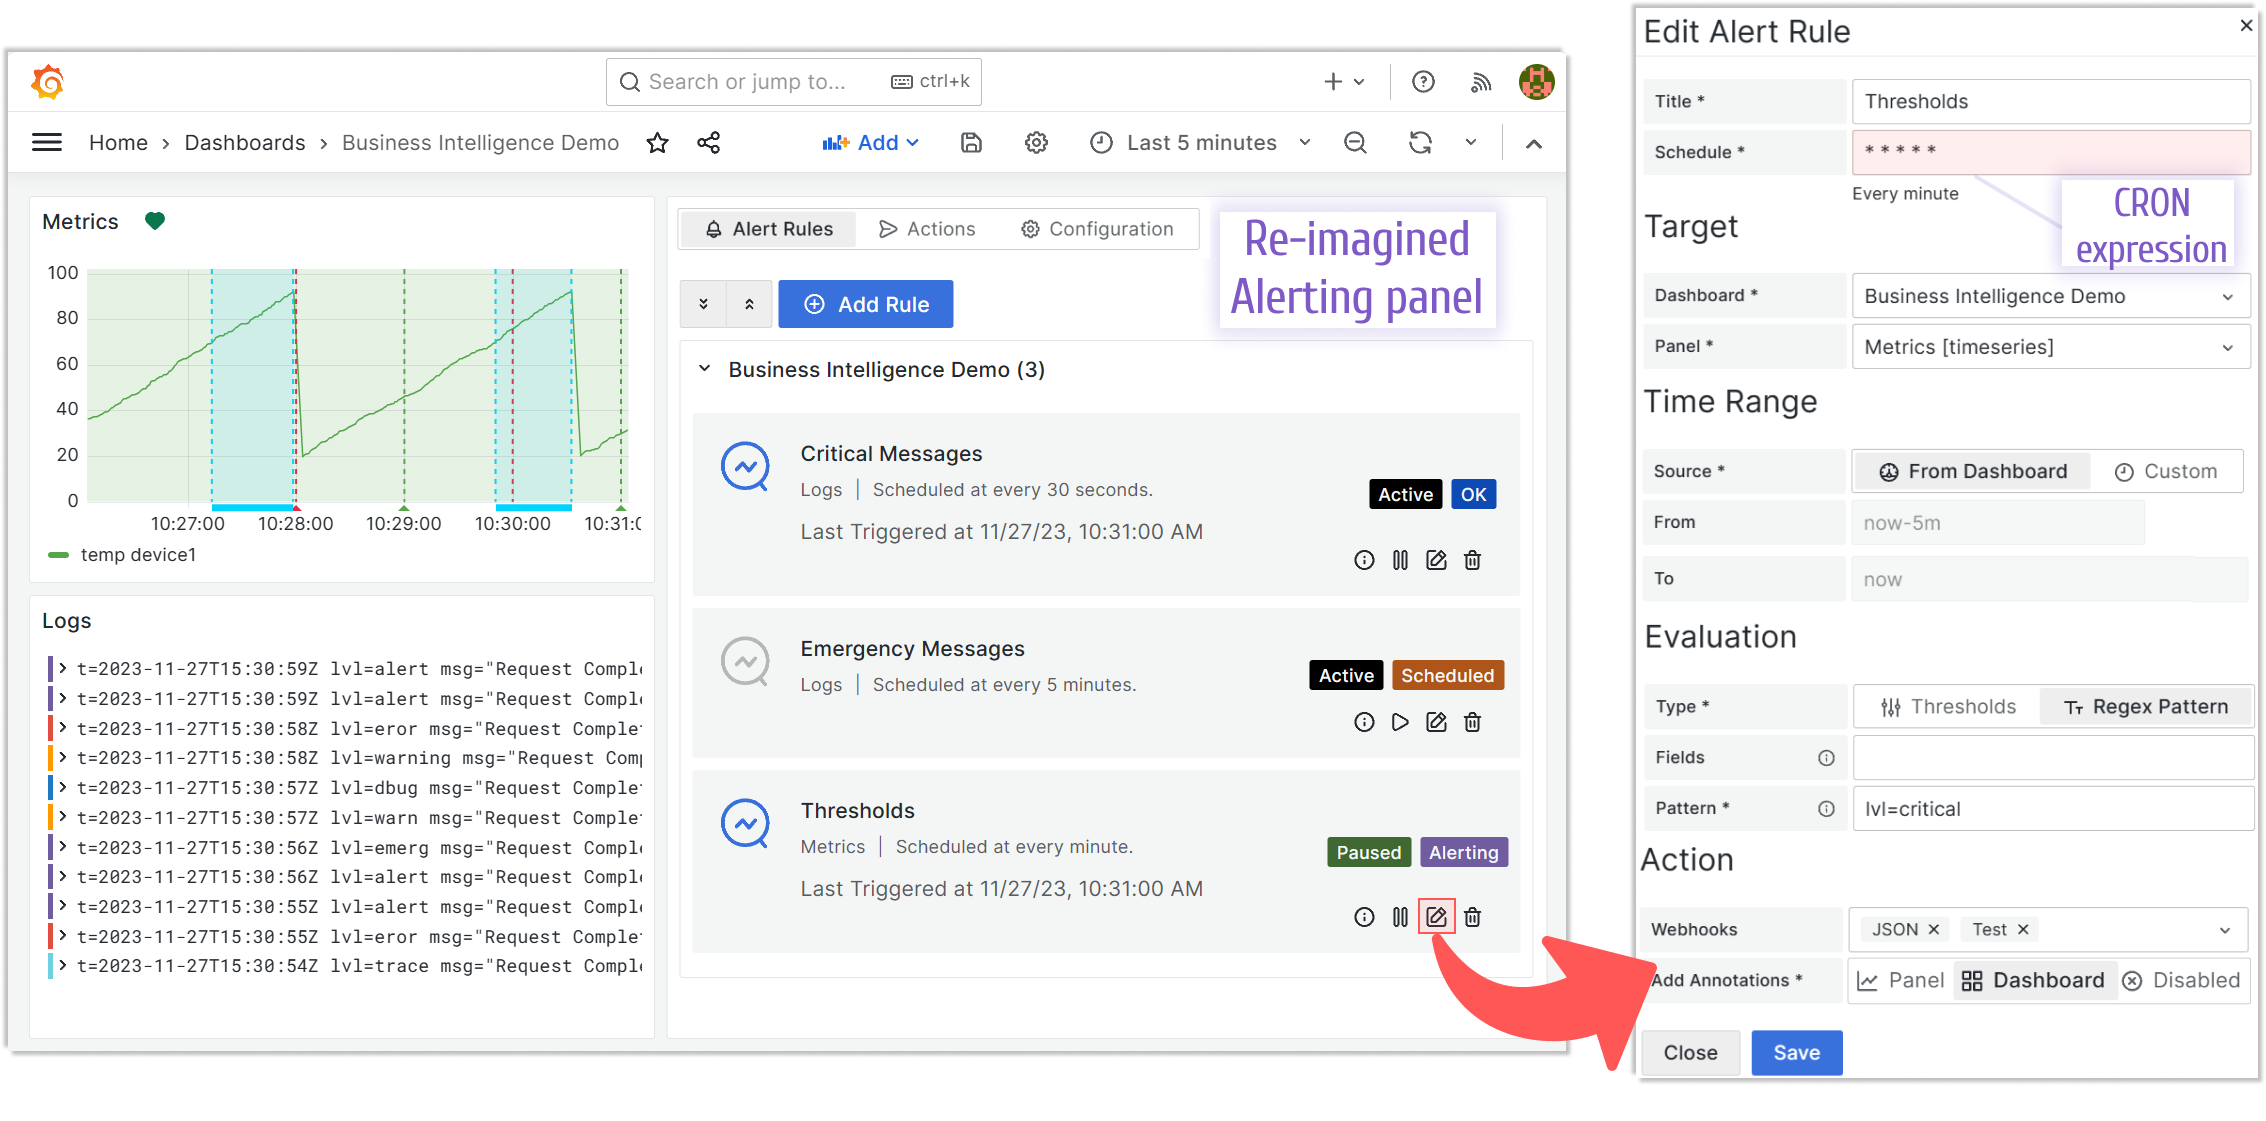
UI Enhancements
Actions Page
Renamed from Webhooks to Actions to align with alerting terminology (Alert rule-Alert record-Alert action).
Annotations
In Edit mode > Action category, the Add Annotations option now lets you attach annotations to a specific panel or the entire dashboard.
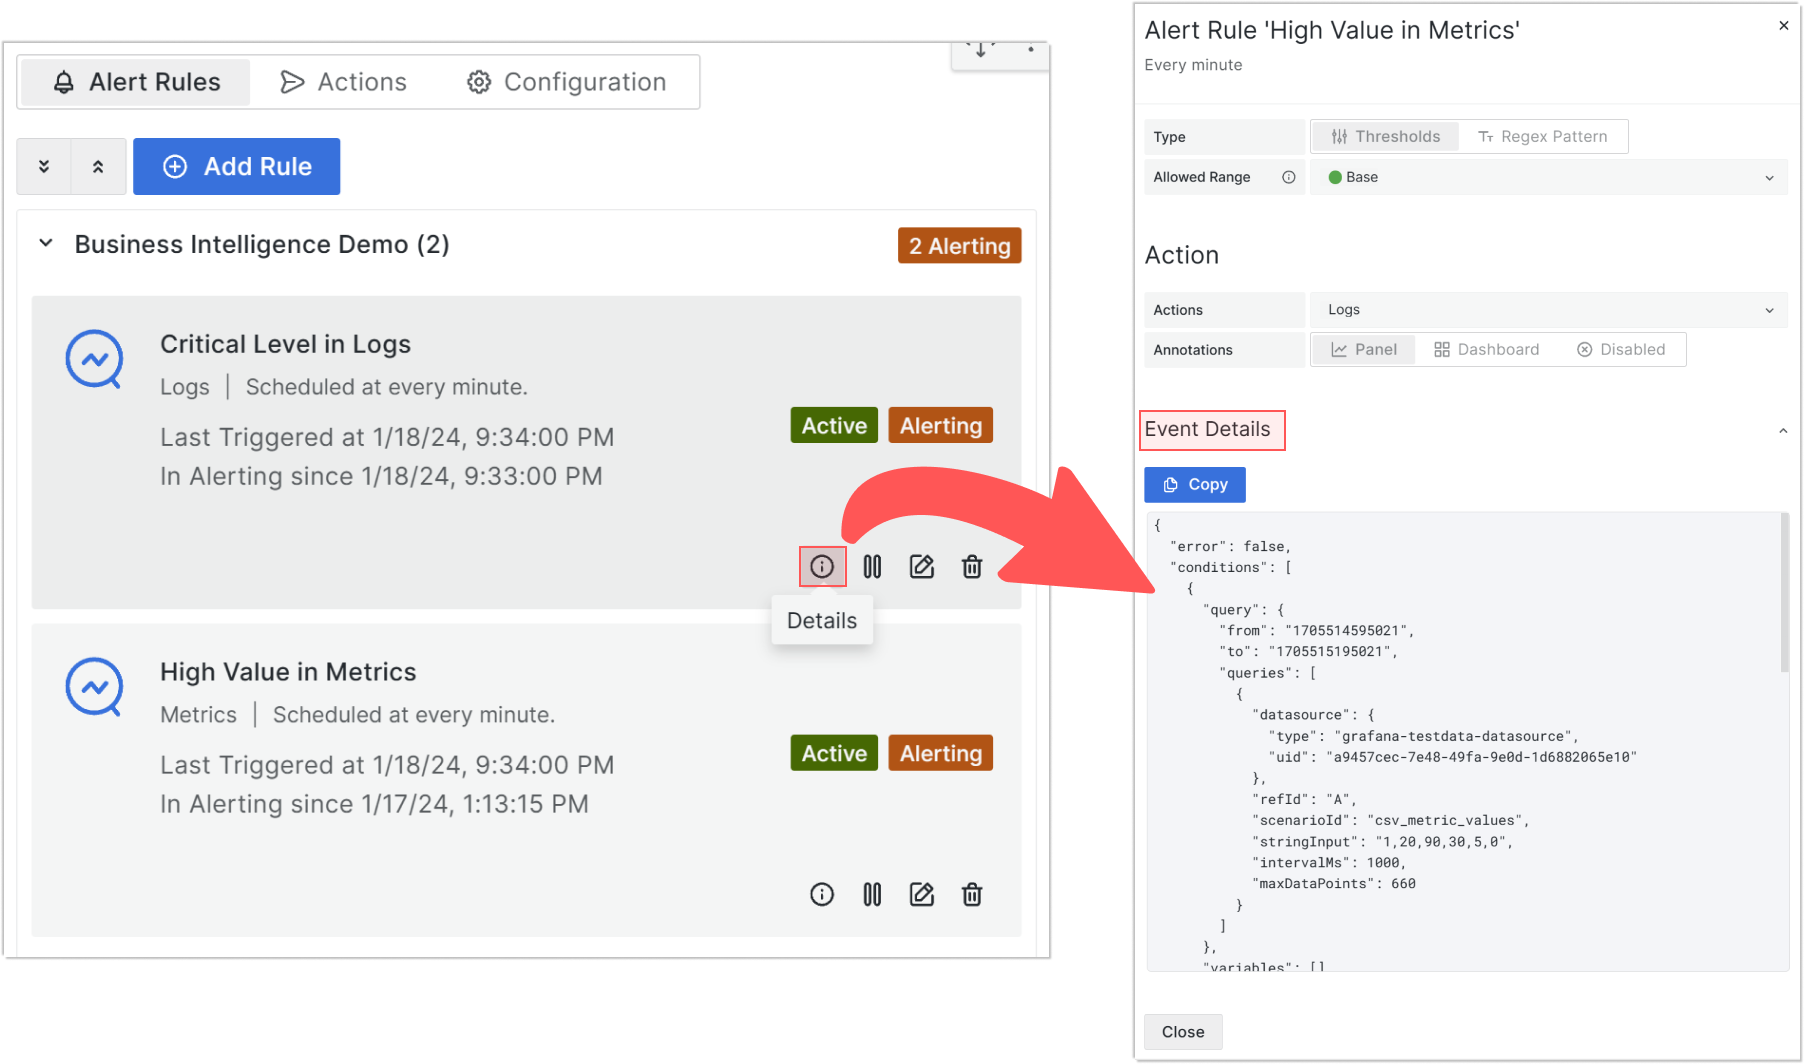
Event Details
For rules in Alerting or Error states, click Details on an alert card, then the Event Details header to inspect specifics.
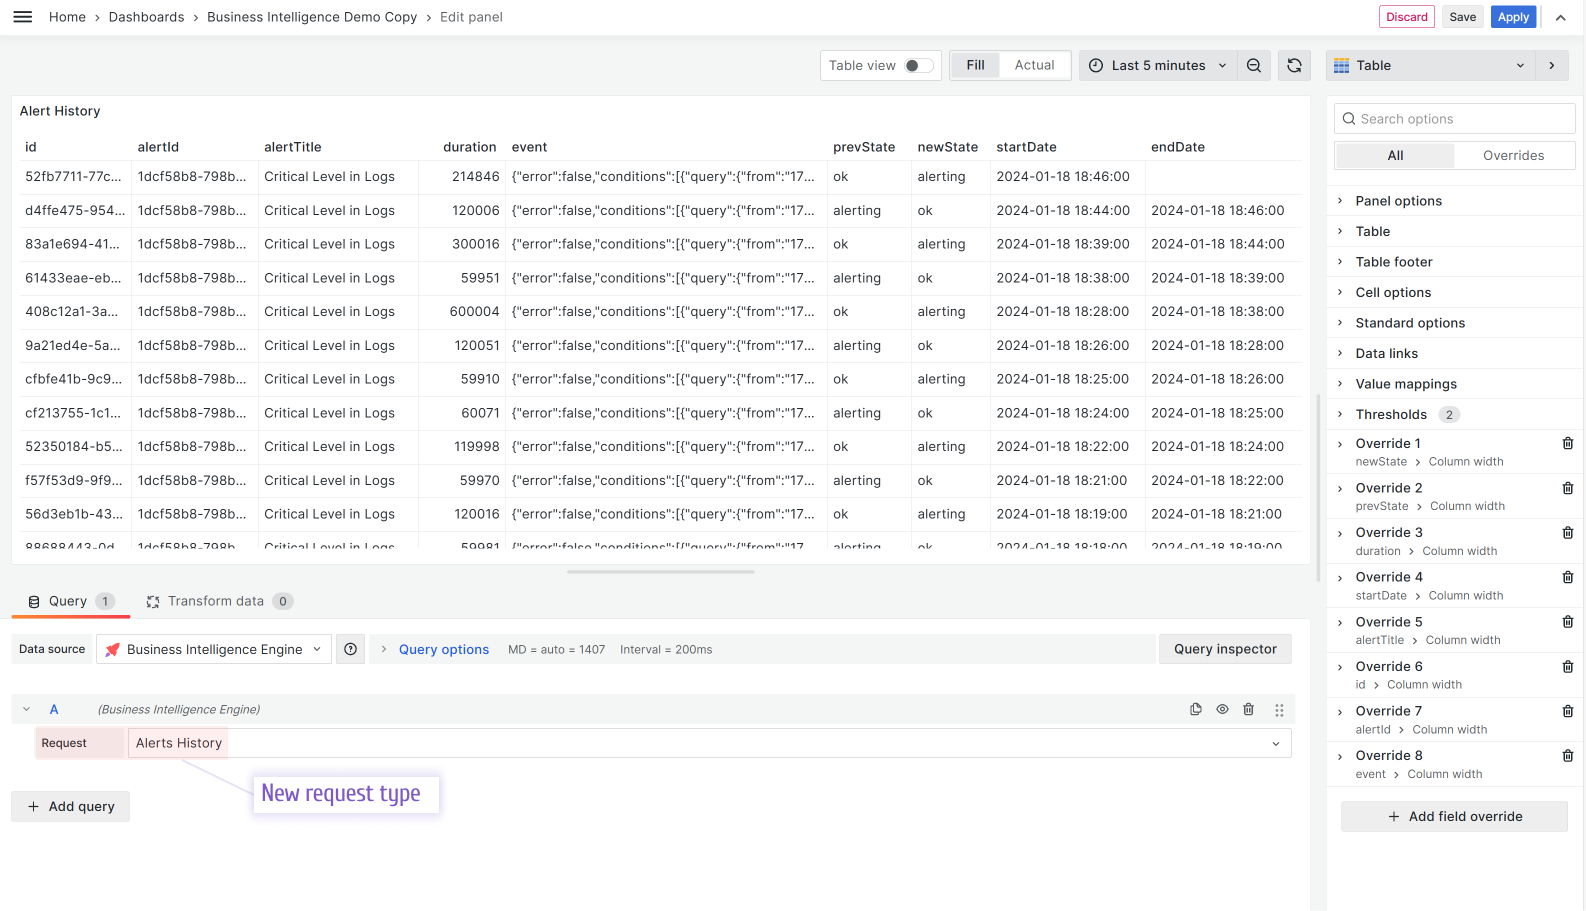
Alert History Visualization
A new Alerts History option in the BI Engine data source’s Request parameter lets you display alert history in any visualization panel—like this Table view:
Getting Started
The Business Intelligence platform uses Docker containers to deliver a modular, scalable solution. Our Quick Start guide provides a simplest setup to get started.
We’d Love to Hear From You!
Have feedback or ideas? Get involved:
- Questions, Features, or Bugs: Open a Zendesk ticket for a prompt and dedicated response from our team.
- Join the Conversation: Subscribe to our YouTube Channel and share your thoughts in the comments.
Your input helps us improve, so don’t hesitate to get in touch!