Business Intelligence 1.7.0: High Availability, REST API, and Enhanced UI
We’re thrilled to announce the release of Business Intelligence 1.7.0 from Volkov Labs! This update takes the Business Intelligence platform to new heights with powerful features designed to boost reliability, automation, and user experience. Here’s what’s new:
- Distributed High Availability (HA) for seamless, uninterrupted service.
- Swagger REST API for streamlined automation and data access.
- UI Improvements:
- New Duplicate Alert button for faster setups.
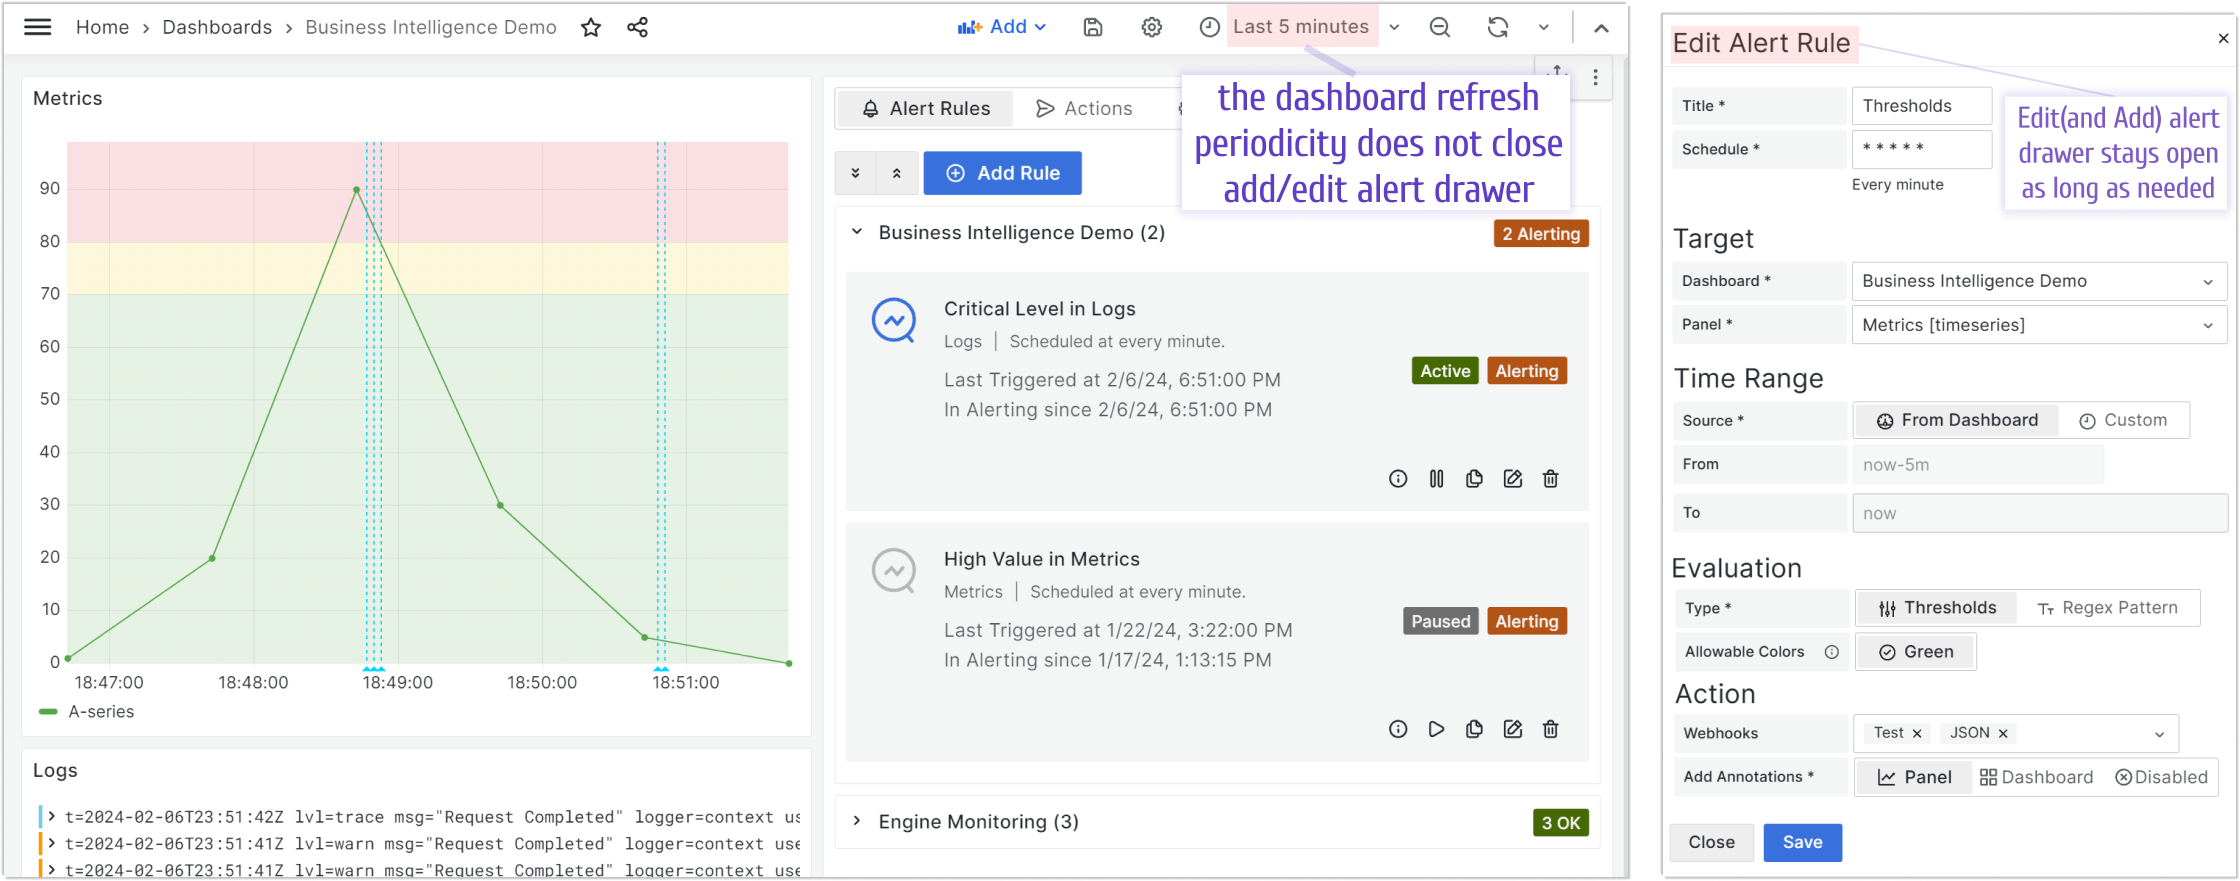
- Persistent dashboard refresh to maintain workflow.
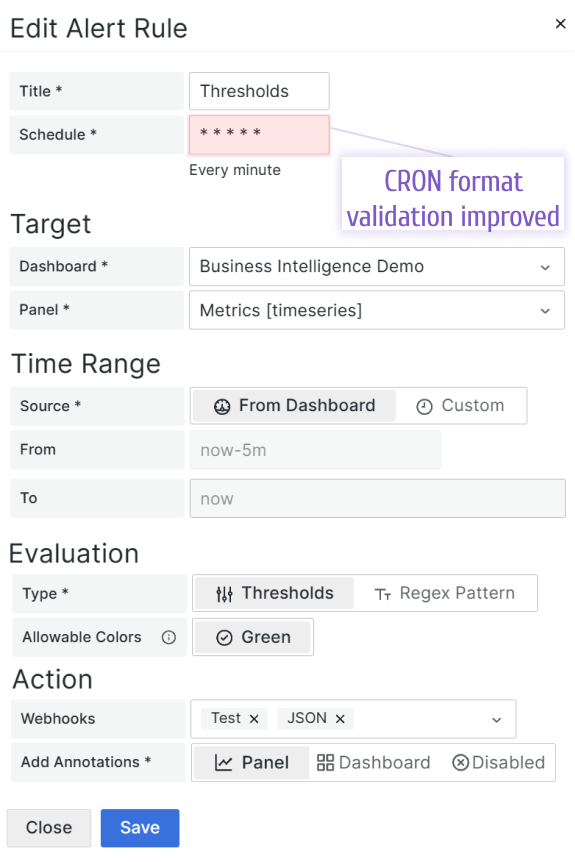
- Enhanced CRON validation for error-free scheduling.
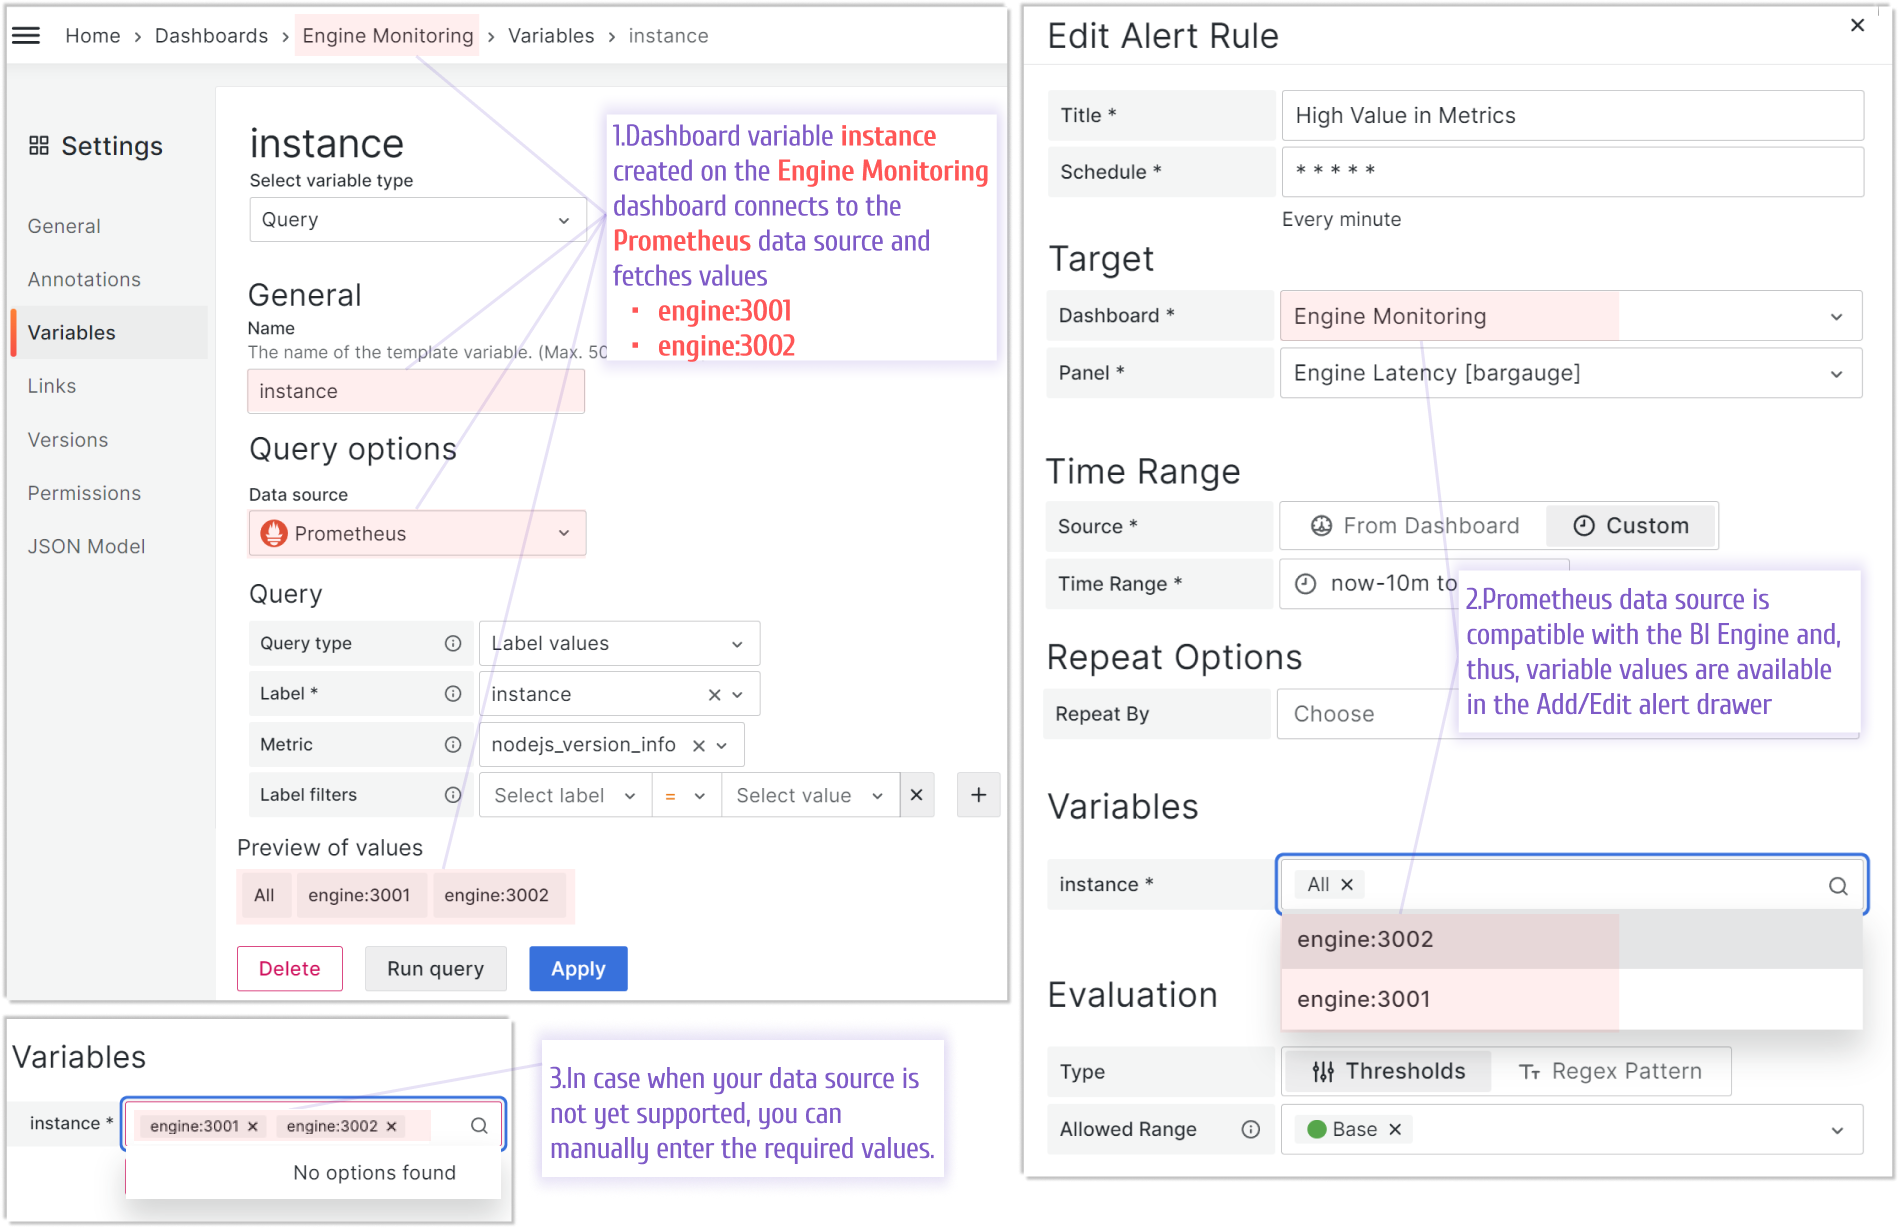
- Custom variable value input for greater flexibility.
Take a quick look at the highlights:
Distributed High Availability (HA)
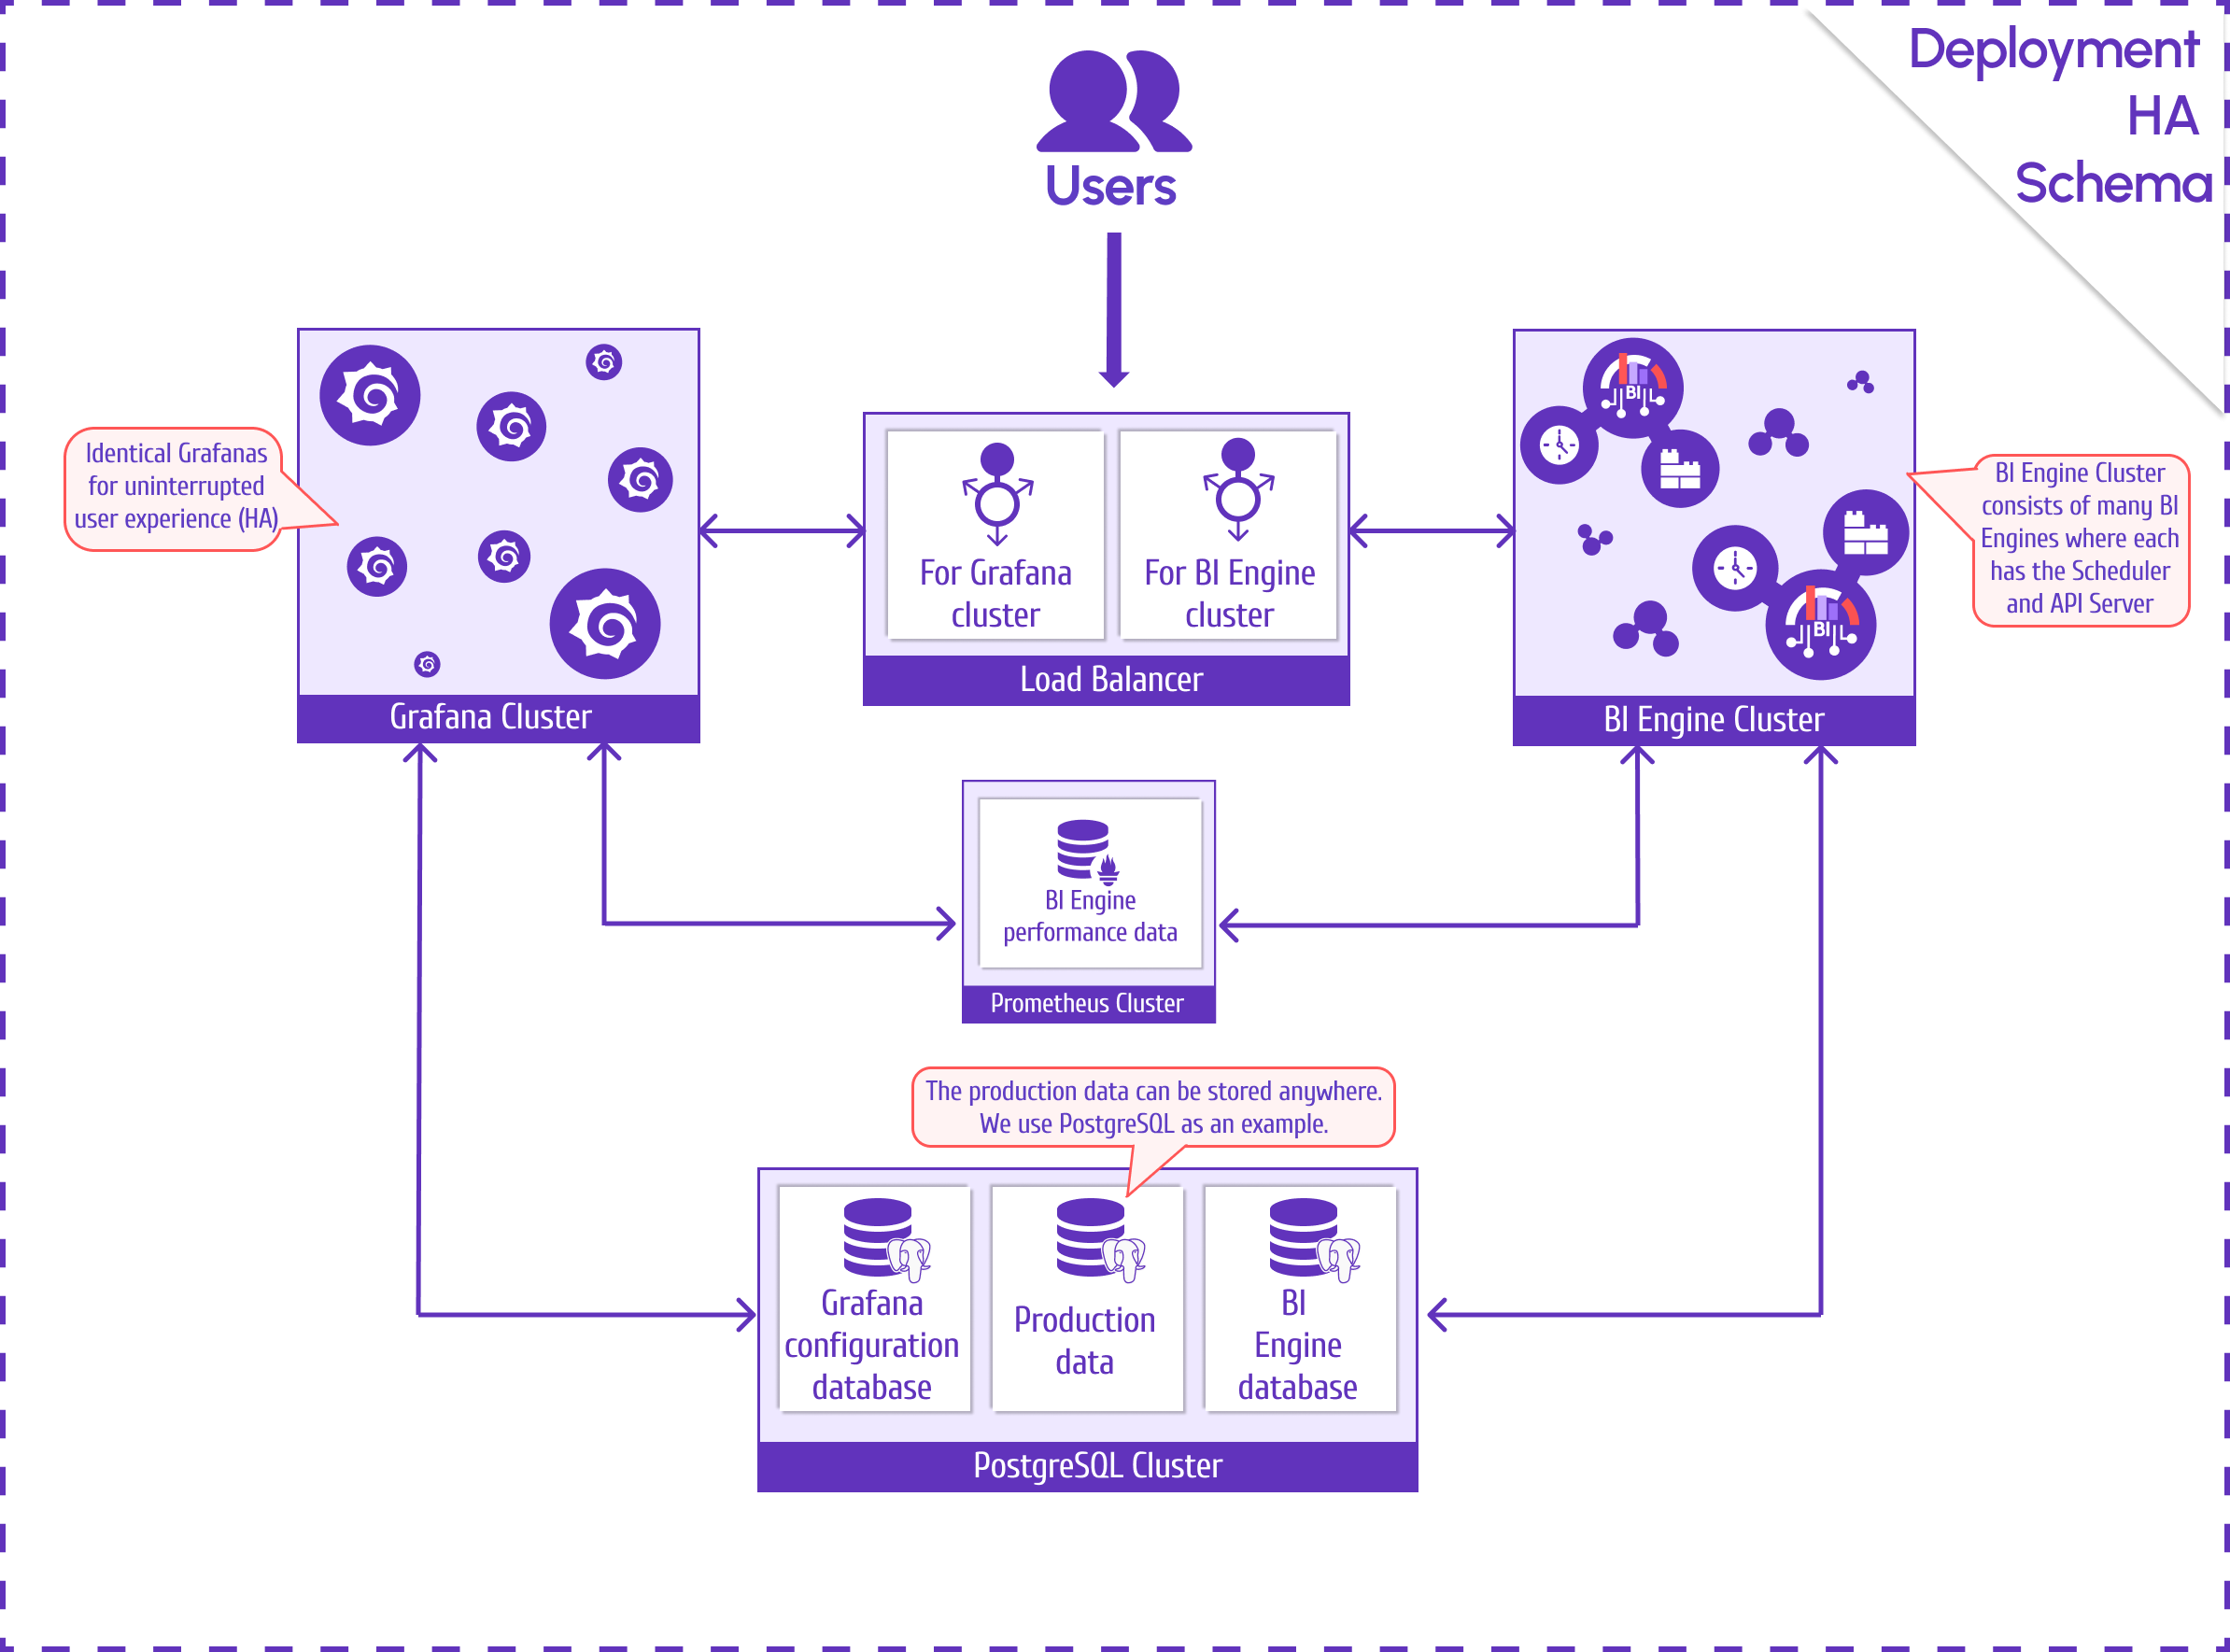
High Availability is a top priority for many, and with 1.7.0, we’ve made it a reality. Our BI platform now supports clustered components, ensuring redundancy and workload distribution for continuous operation, even under heavy demand. Key clusters include:
- BI Engine Cluster: Balances Server API requests and automates alert rule scheduling.
- Grafana Cluster: Powers data visualization and serves HTTP API for the BI Engine.
- Prometheus Cluster: Stores performance metrics for the BI Engine.
- PostgreSQL Cluster: Manages BI Engine data, Grafana configurations, and production datasets.
See the HA architecture in action:

Swagger REST API
Unlock new possibilities with our Swagger REST API. Whether you’re automating configurations or accessing critical data, this API simplifies integration and boosts efficiency. Explore the full capabilities in our REST API documentation.
UI Enhancements for a Smoother Experience
We’ve fine-tuned the user interface to save you time and reduce friction. Here’s what’s improved:
Duplicate Alert Button
Need to replicate an alert? The new Duplicate button lets you clone existing alerts with a single click, making setup faster and easier.

Persistent Dashboard Refresh
Say goodbye to workflow interruptions. The add/edit alert drawer now remains open during dashboard refreshes, even with short refresh intervals of 2-3 minutes.

Enhanced CRON Validation
Scheduling alerts is now more intuitive. Enter an invalid CRON format, and you’ll get immediate feedback with a clear error message—no more trial and error.

Custom Variable Values
While we natively support SQL and Prometheus data sources, we’re expanding compatibility. For unsupported sources, you can now manually input variable values in the add/edit drawer, ensuring your alerts remain operational.

Getting Started
Business Intelligence Platform is a powerful solution that harnesses Docker containers to deliver a modular, scalable, and user-friendly environment for alert-driven analytics. Whether you're just starting out or are an experienced user, our Quick Start Guide is designed to help you set up and deploy the platform effortlessly.
This guide provides a step-by-step walkthrough of the essential setup process, ensuring you can get up and running in no time. Key topics include:
- Configuring the Business Engine: Understand how to set up the core component that powers your analytics.
- Launching the Business Studio: Deploy and access the intuitive interface on your local machine for seamless management and visualization.
We’d Love to Hear From You!
Your feedback and ideas are invaluable to us! Here’s how you can get involved:
- Questions, Feature Requests, or Bugs: Submit a Zendesk ticket to receive a swift and personalized response from our dedicated support team.
- Join the Community: Subscribe to our YouTube Channel and share your thoughts or suggestions in the comments.
Your input is crucial in helping us grow and improve, so please don’t hesitate to reach out!


