Business Alerting: Reinventing Alerts in Grafana


Through close collaboration with the Grafana Community, we've collected valuable feedback on improving alerting—calling for simpler controls, a unified interface, and anomaly detection with reporting for self-hosted environments. This led to the creation of Business Alerting, a reimagined solution tailored for business users.
In this video, I introduce alerting fundamentals, explore native Grafana components, and share our vision for Business Alerting. The article below dives deeper into these topics:
Alerting Basics
Alerting monitors data changes and triggers responses when predefined rules are violated. It consists of three core components:
- Alert Rule: Specifies what to monitor, including time frame, frequency, query (e.g., SQL, PromQL), and thresholds.
- Alert Record: Captures instances when data breaches thresholds.
- Alert Action: Executes a predefined response to the recorded breach.
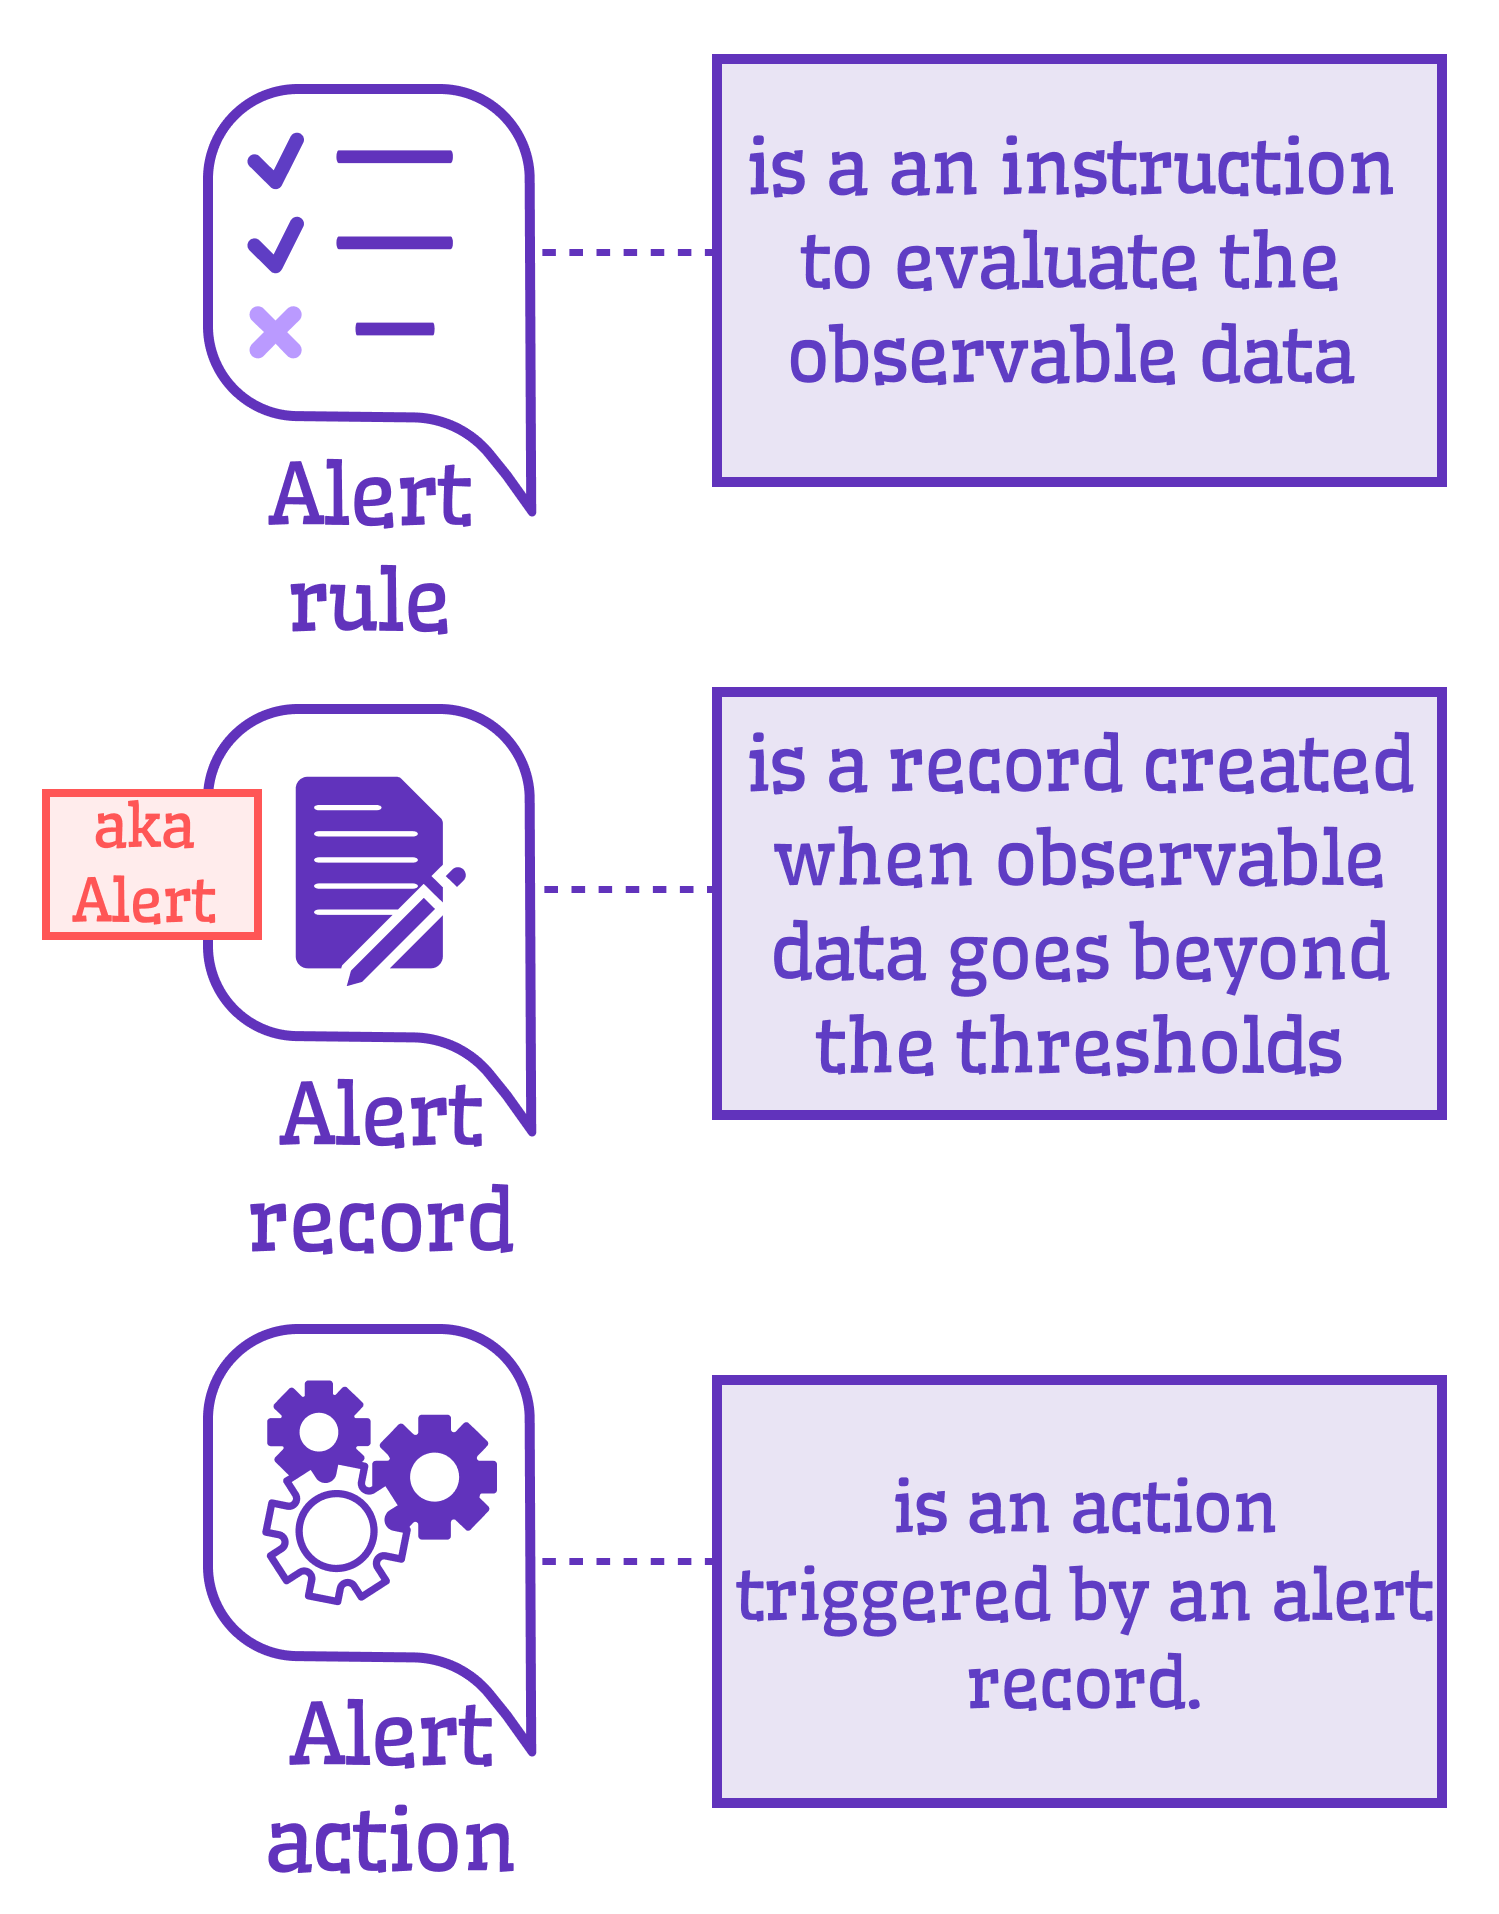
You define the "what" and "how," and when a rule is breached, records trigger actions—a straightforward yet powerful mechanism.
Native Alerting vs. Business Alerting
The following diagram compares Grafana’s native alerting with our vision for Business Alerting:
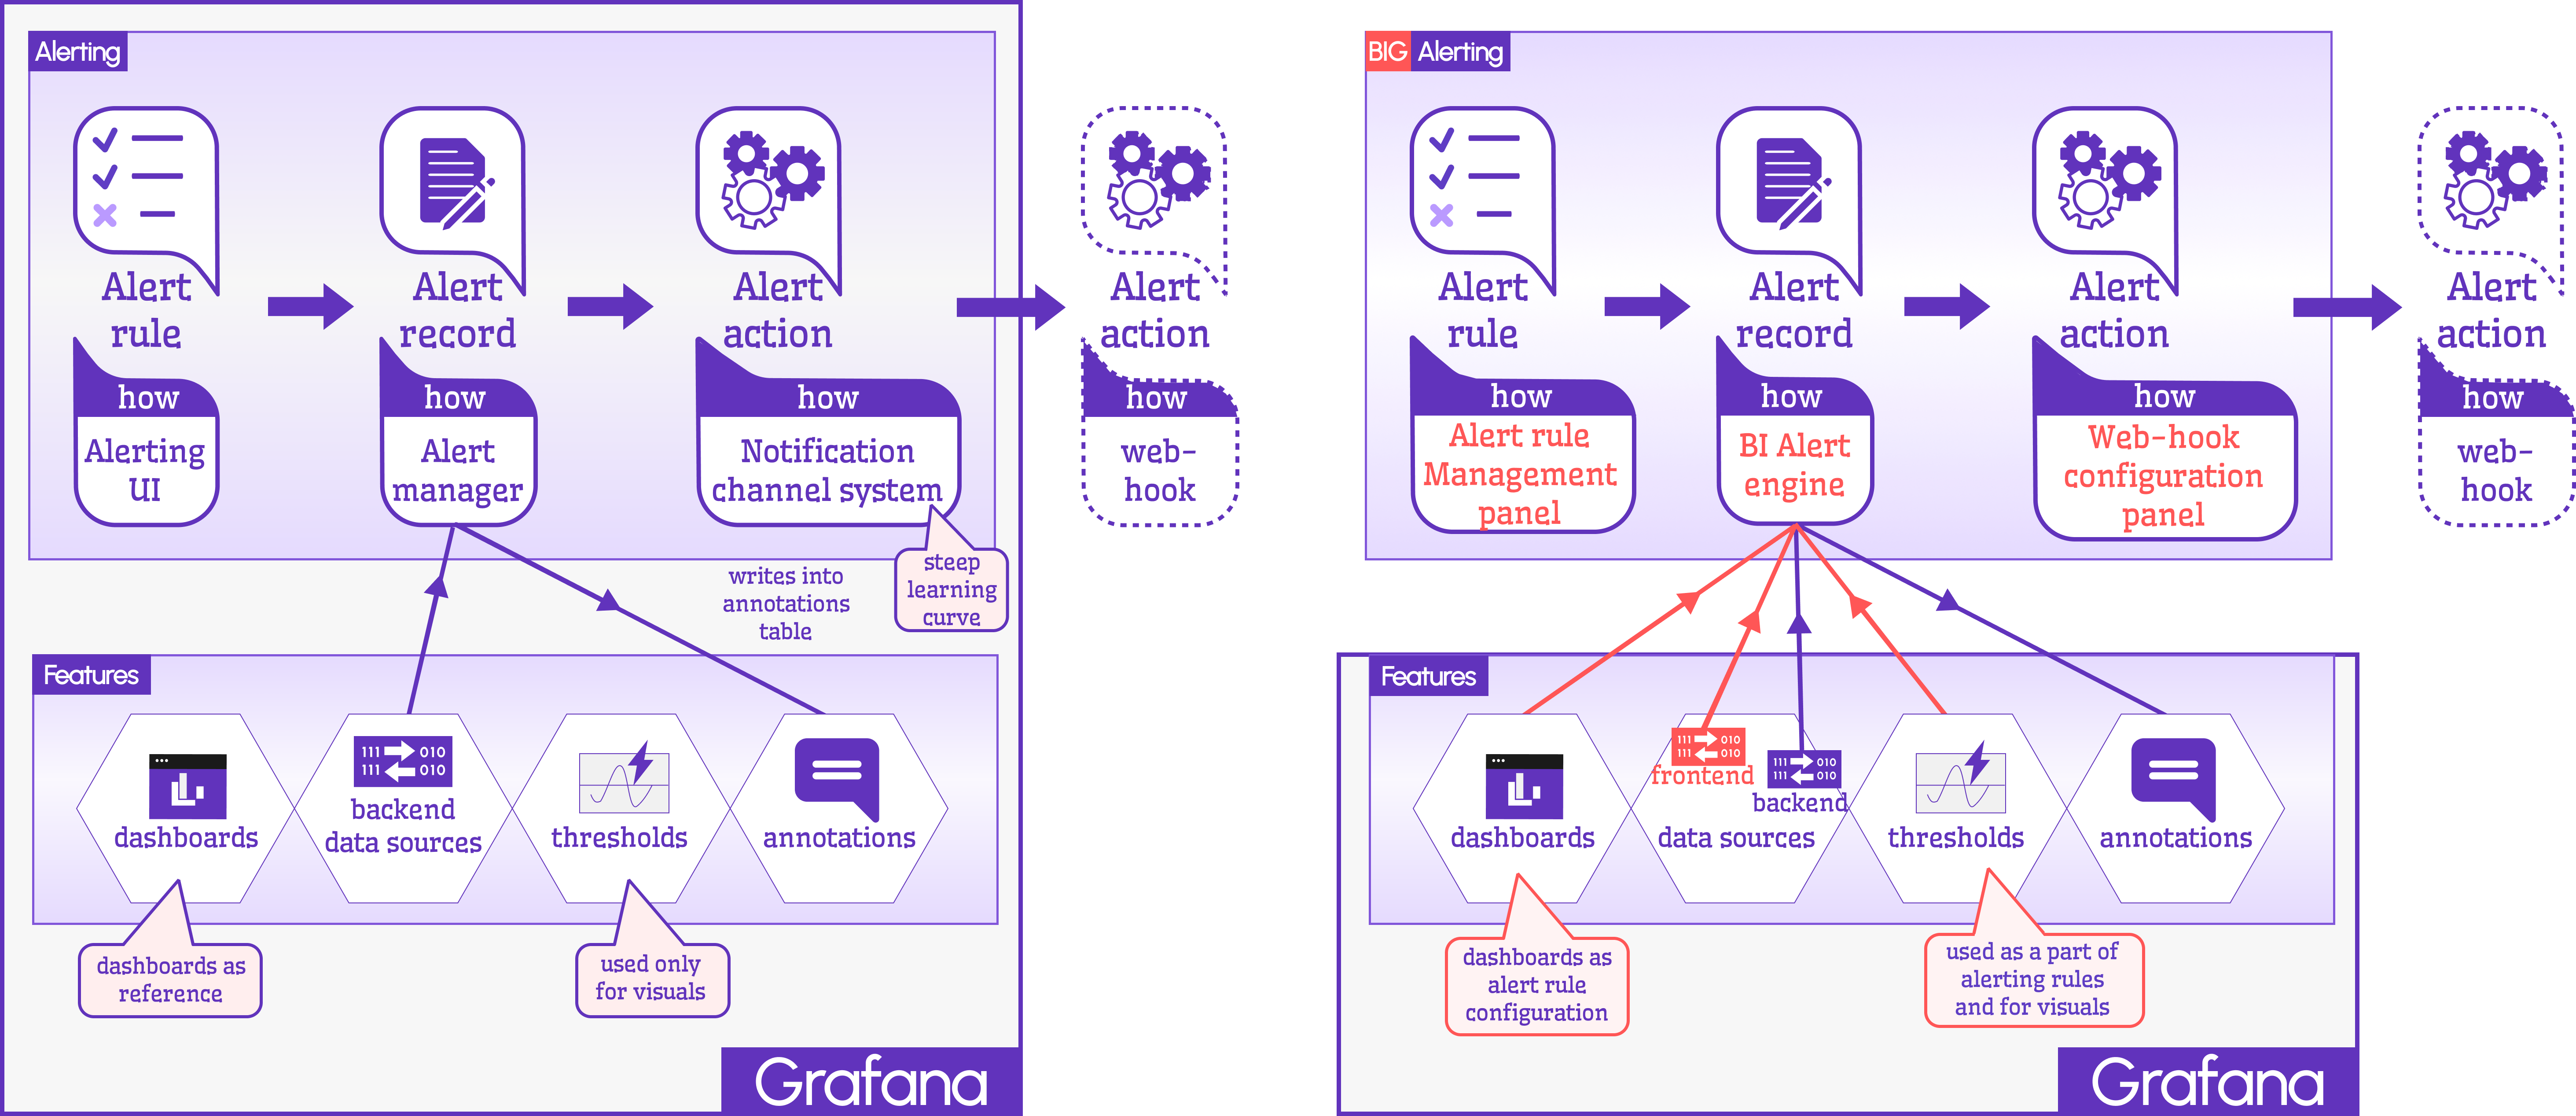
Native Alerting
- Rules: Configured through the Alerting UI.
- Records: Managed by the Alert Manager, which logs breaches as annotations (vertical lines on Time Series) for backend data sources.
- Actions: Supported by a powerful notification system (text, Slack, email, OnCall), though it has a steep learning curve. Webhooks for third-party APIs are possible but complex to set up.
Business Alerting
We’ve reimagined all three components for simplicity and accessibility:
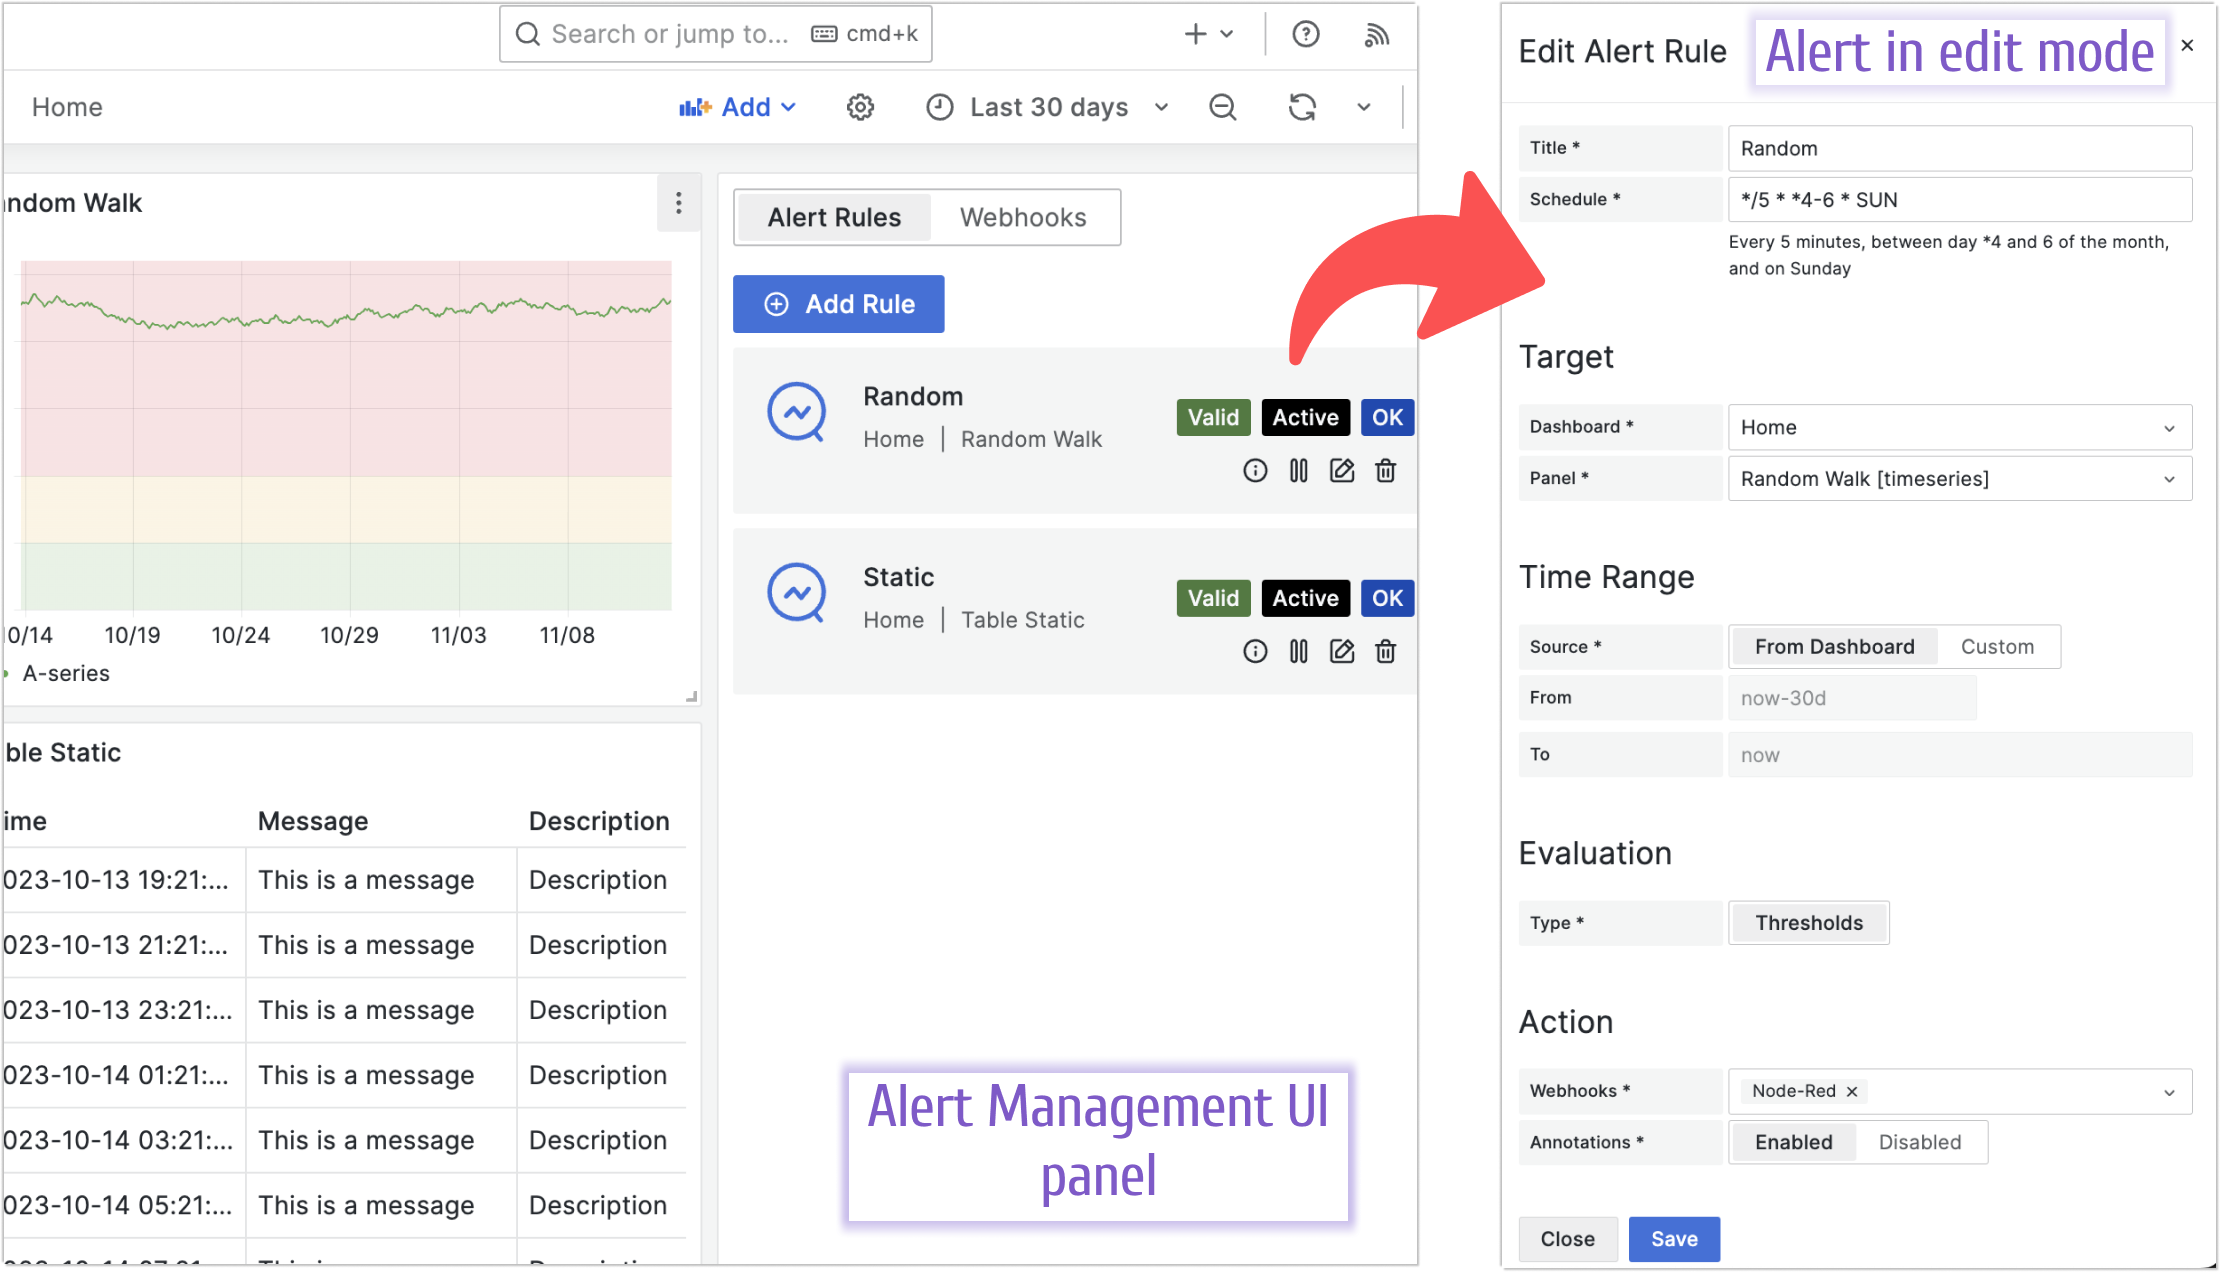
Business Alerting Panel
A unified, user-friendly interface streamlines rule creation for business users. Key features include:
- Title: Assign a name to your alert.
- Schedule: Define frequency using CRON expressions.
- Target Dashboard/Panel: Automatically pull queries and thresholds from dropdown menus.
- Time Range: Use dashboard defaults or set custom ranges.
- Action: Select from pre-configured webhooks.
- Annotation: Optionally disable annotation records.
Future updates will support managing hundreds of alerts with advanced grouping and filtering capabilities.
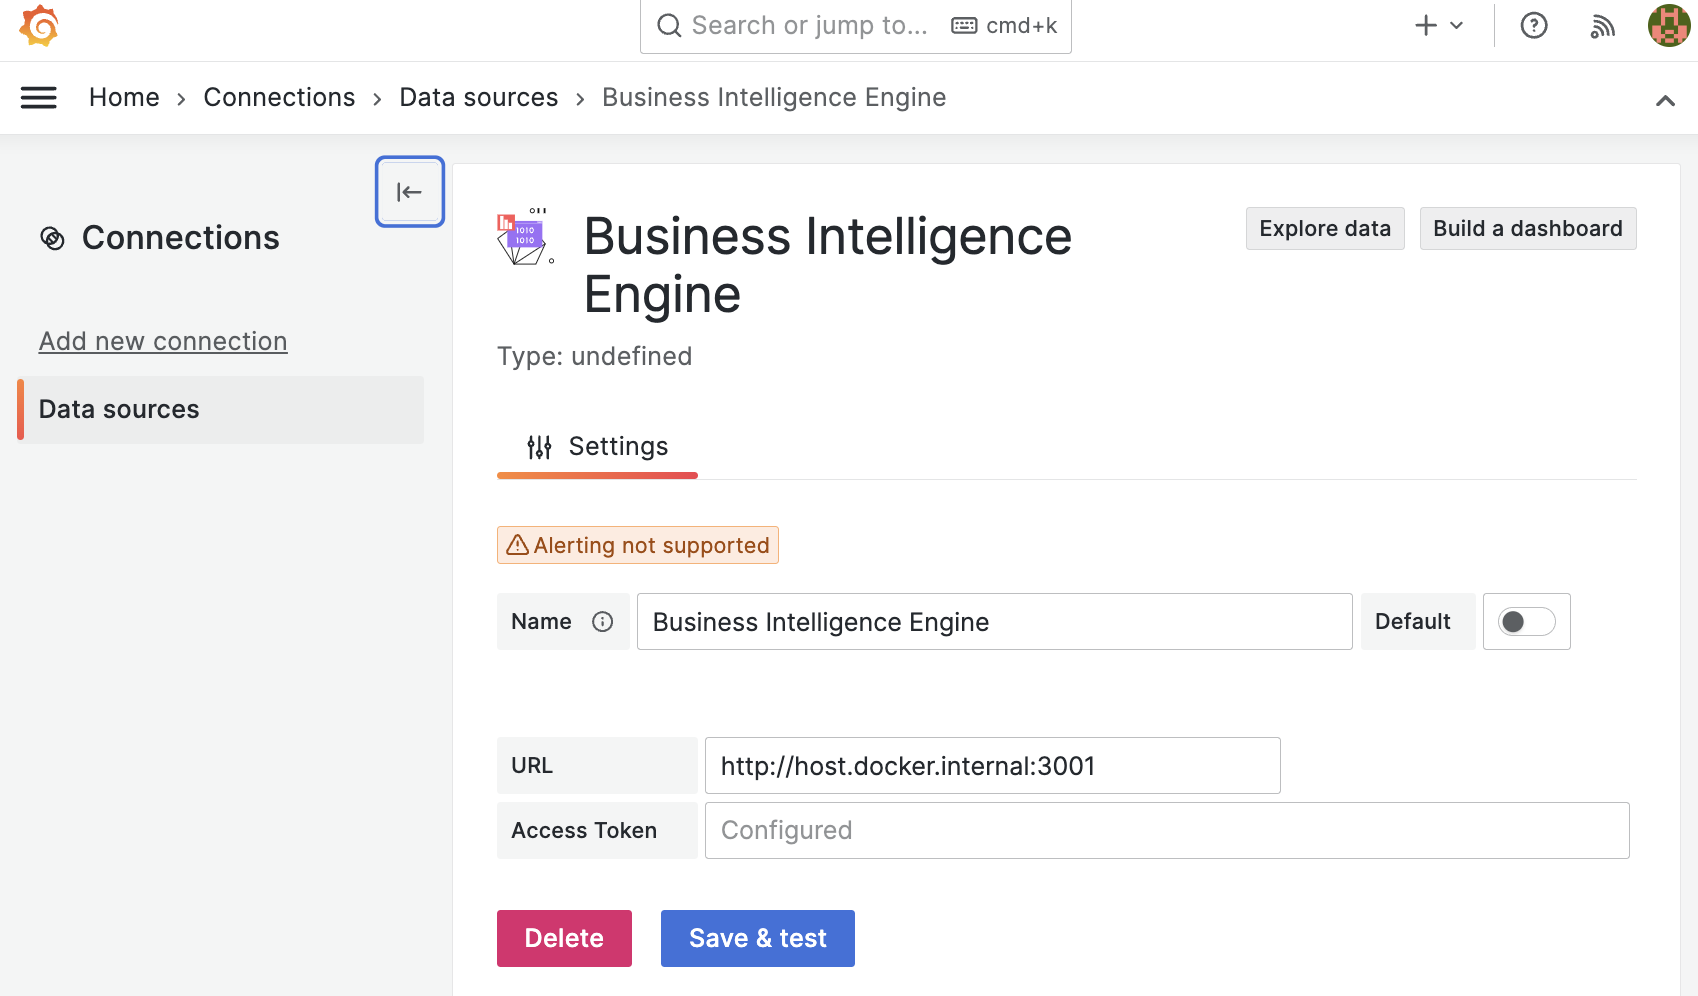
Business Engine
Our alternative to the Alert Manager offers:
- Seamless integration with dashboard queries and thresholds, eliminating redundant configuration.
- Deployment in a separate container for a flexible, scalable architecture.
- Future support for AI-driven anomaly detection.
Connect to it using the Business Engine data source:
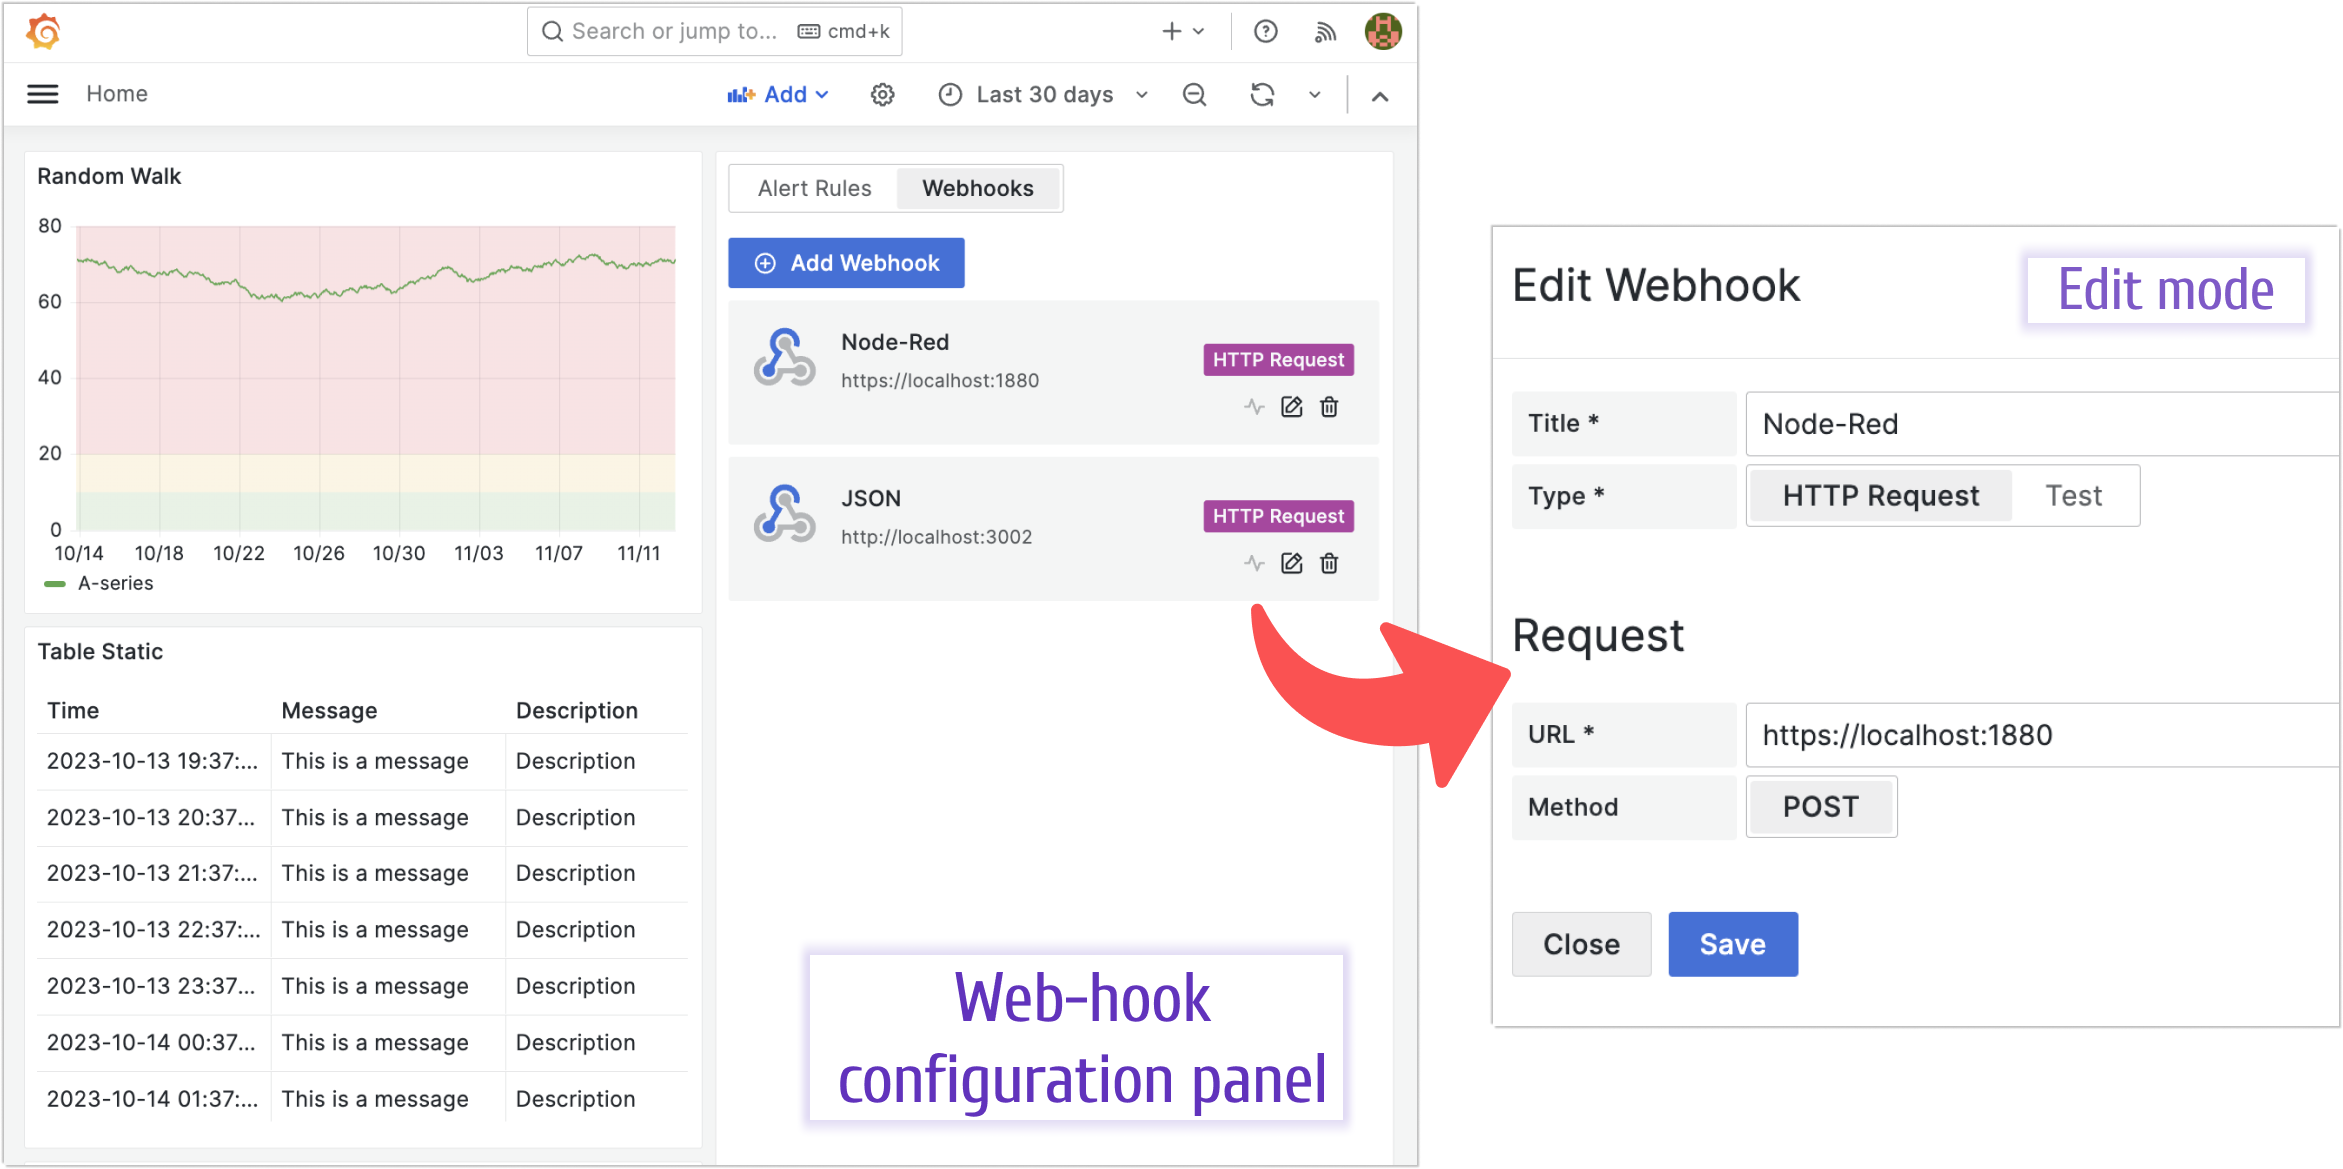
Webhooks Configuration
A dedicated panel simplifies webhook management, with edit mode providing:
- Name and type (HTTP or Test).
- Request URL and method (currently limited to POST).
Why Business Alerting?
By unifying controls, prioritizing usability, and planning cutting-edge features, Business Alerting makes Grafana’s alerting capabilities accessible to non-technical users, empowering business teams to act on data insights effectively.
Getting Started
Business Intelligence Platform is a powerful solution that harnesses Docker containers to deliver a modular, scalable, and user-friendly environment for alert-driven analytics. Whether you're just starting out or are an experienced user, our Quick Start Guide is designed to help you set up and deploy the platform effortlessly.
This guide provides a step-by-step walkthrough of the essential setup process, ensuring you can get up and running in no time. Key topics include:
- Configuring the Business Engine: Understand how to set up the core component that powers your analytics.
- Launching the Business Studio: Deploy and access the intuitive interface on your local machine for seamless management and visualization.
We’d Love to Hear From You!
Your feedback and ideas are invaluable to us! Here’s how you can get involved:
- Questions, Feature Requests, or Bugs: Submit a Zendesk ticket to receive a swift and personalized response from our dedicated support team.
- Join the Community: Subscribe to our YouTube Channel and share your thoughts or suggestions in the comments.
Your input is crucial in helping us grow and improve, so please don’t hesitate to reach out!