Business Alerting: Reinventing Alerts in Grafana


Working closely with the Grafana Community, we’ve gathered a wealth of feedback on enhancing alerting—simpler controls, unified UI, and anomaly detection with reporting for self-hosted setups. This inspired Business Alerting, a reimagined approach designed for business users.
In this video, I cover alerting basics, native Grafana components, and our vision for Business Alerting. The article expands on these points with added depth:
Alerting Basics
Alerting tracks data changes and responds when rules are breached. Its three core components are:
- Alert Rule: Defines what to monitor—time frame, frequency, query (e.g., SQL, PromQL), and thresholds.
- Alert Record: Logs when data exceeds thresholds.
- Alert Action: Executes a response to the record.
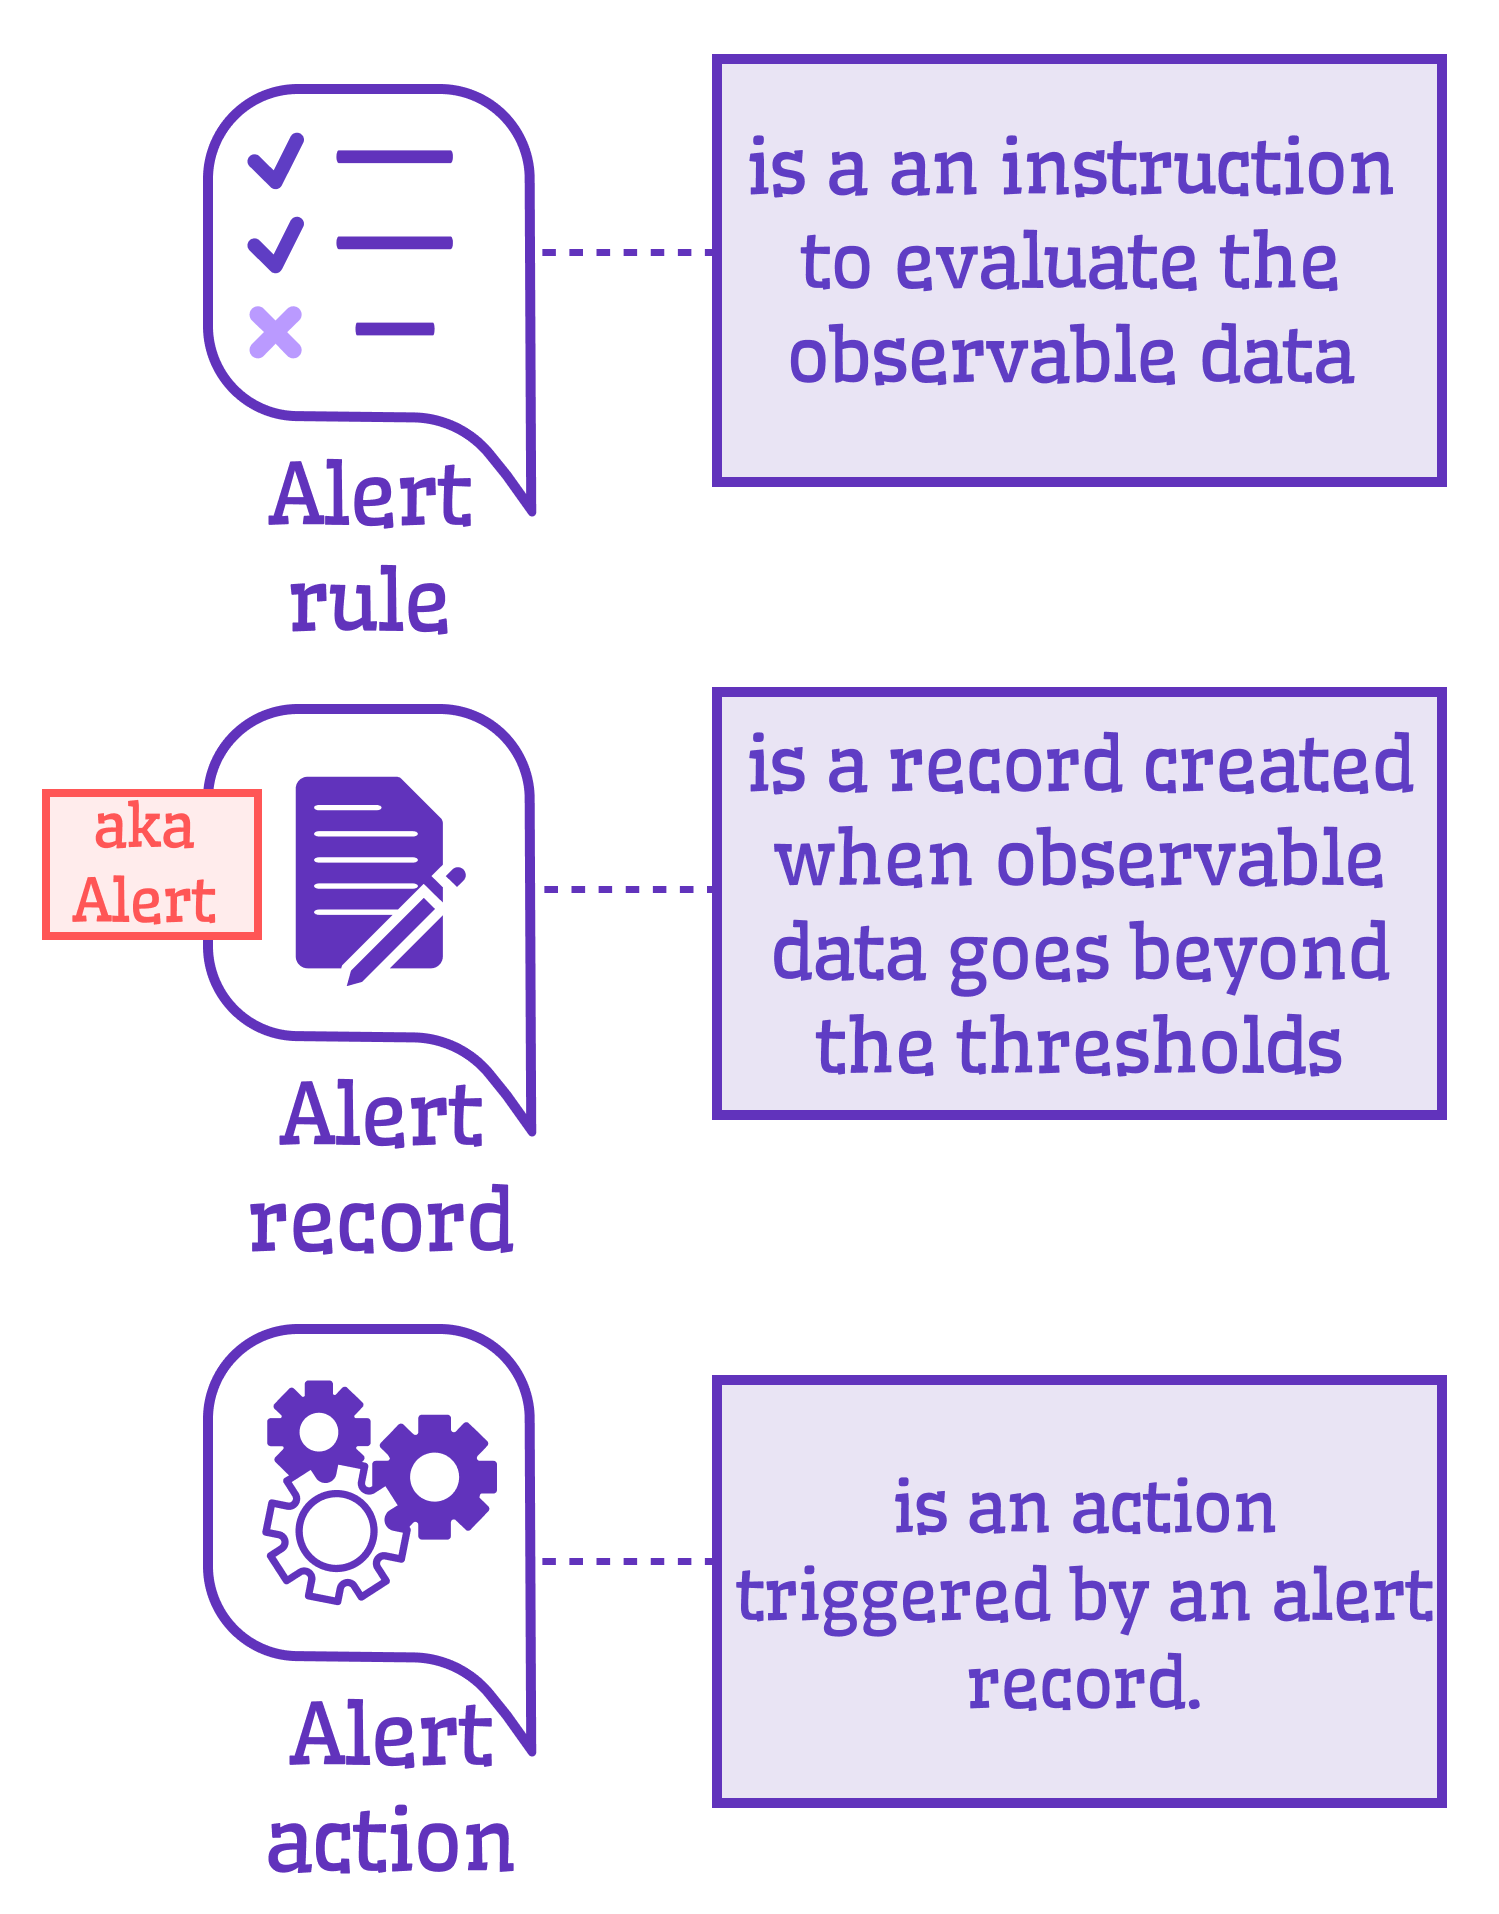
You set the “what” and “how,” and when rules break, records trigger actions—simple yet powerful.
Native Alerting vs. Business Alerting
This schema compares Grafana’s native alerting with our Business Alerting vision:
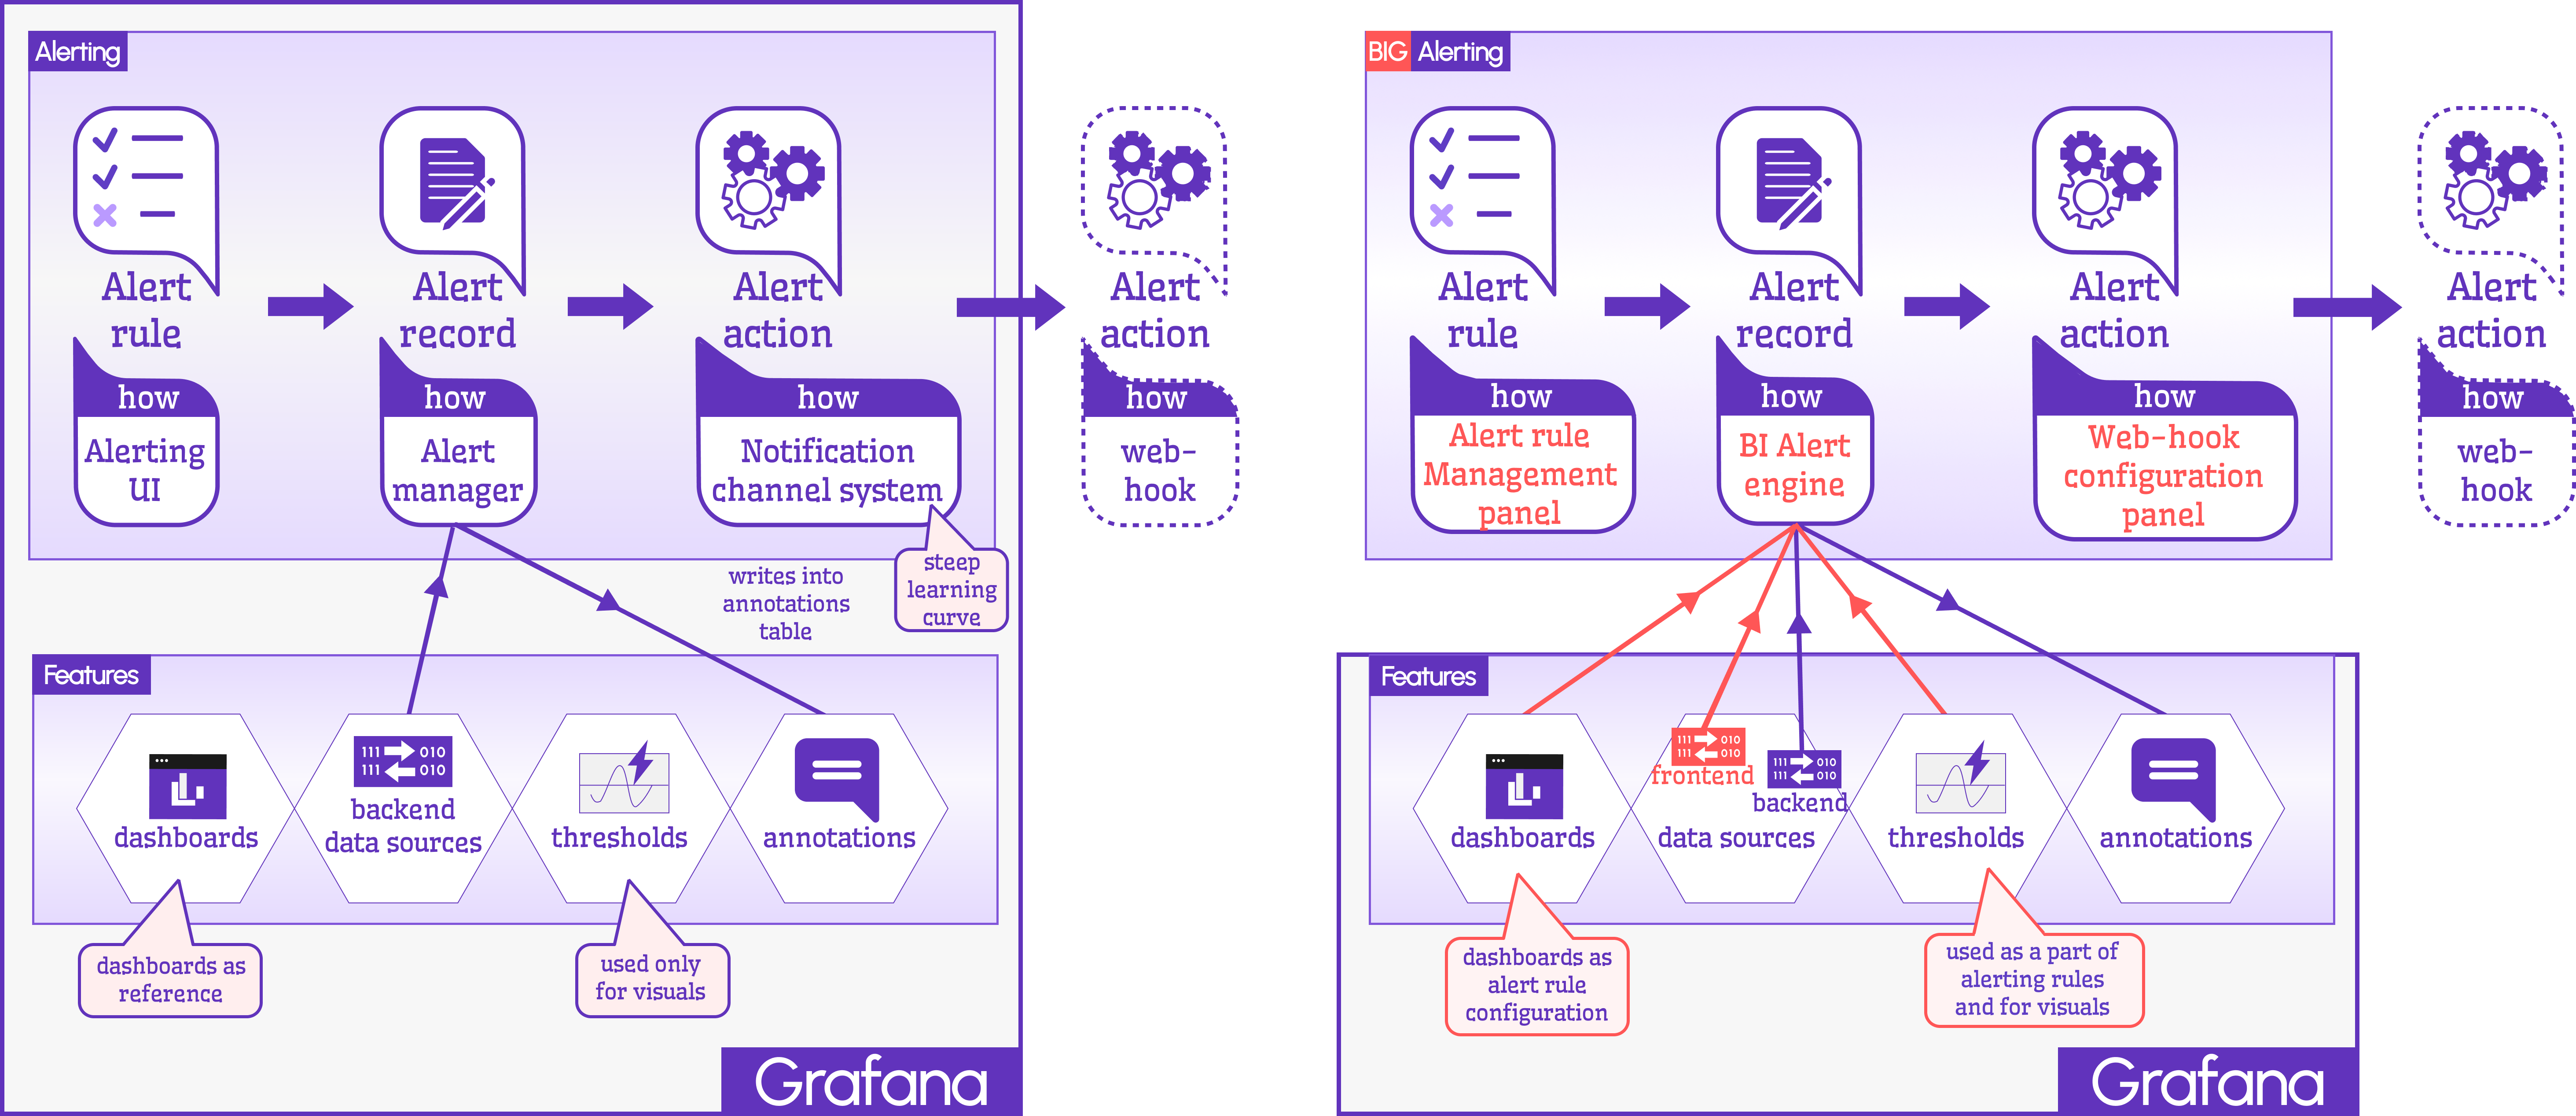
Native Alerting
- Rules: Created via the Alerting UI.
- Records: Managed by the Alert Manager, which logs breaches as annotations (vertical lines on Time Series) for backend data sources.
- Actions: Handled by a robust notification system (text, Slack, email, OnCall) with a steep learning curve. Webhooks (3rd-party APIs) are possible but tricky to implement.
Business Alerting
We’ve rethought all three:
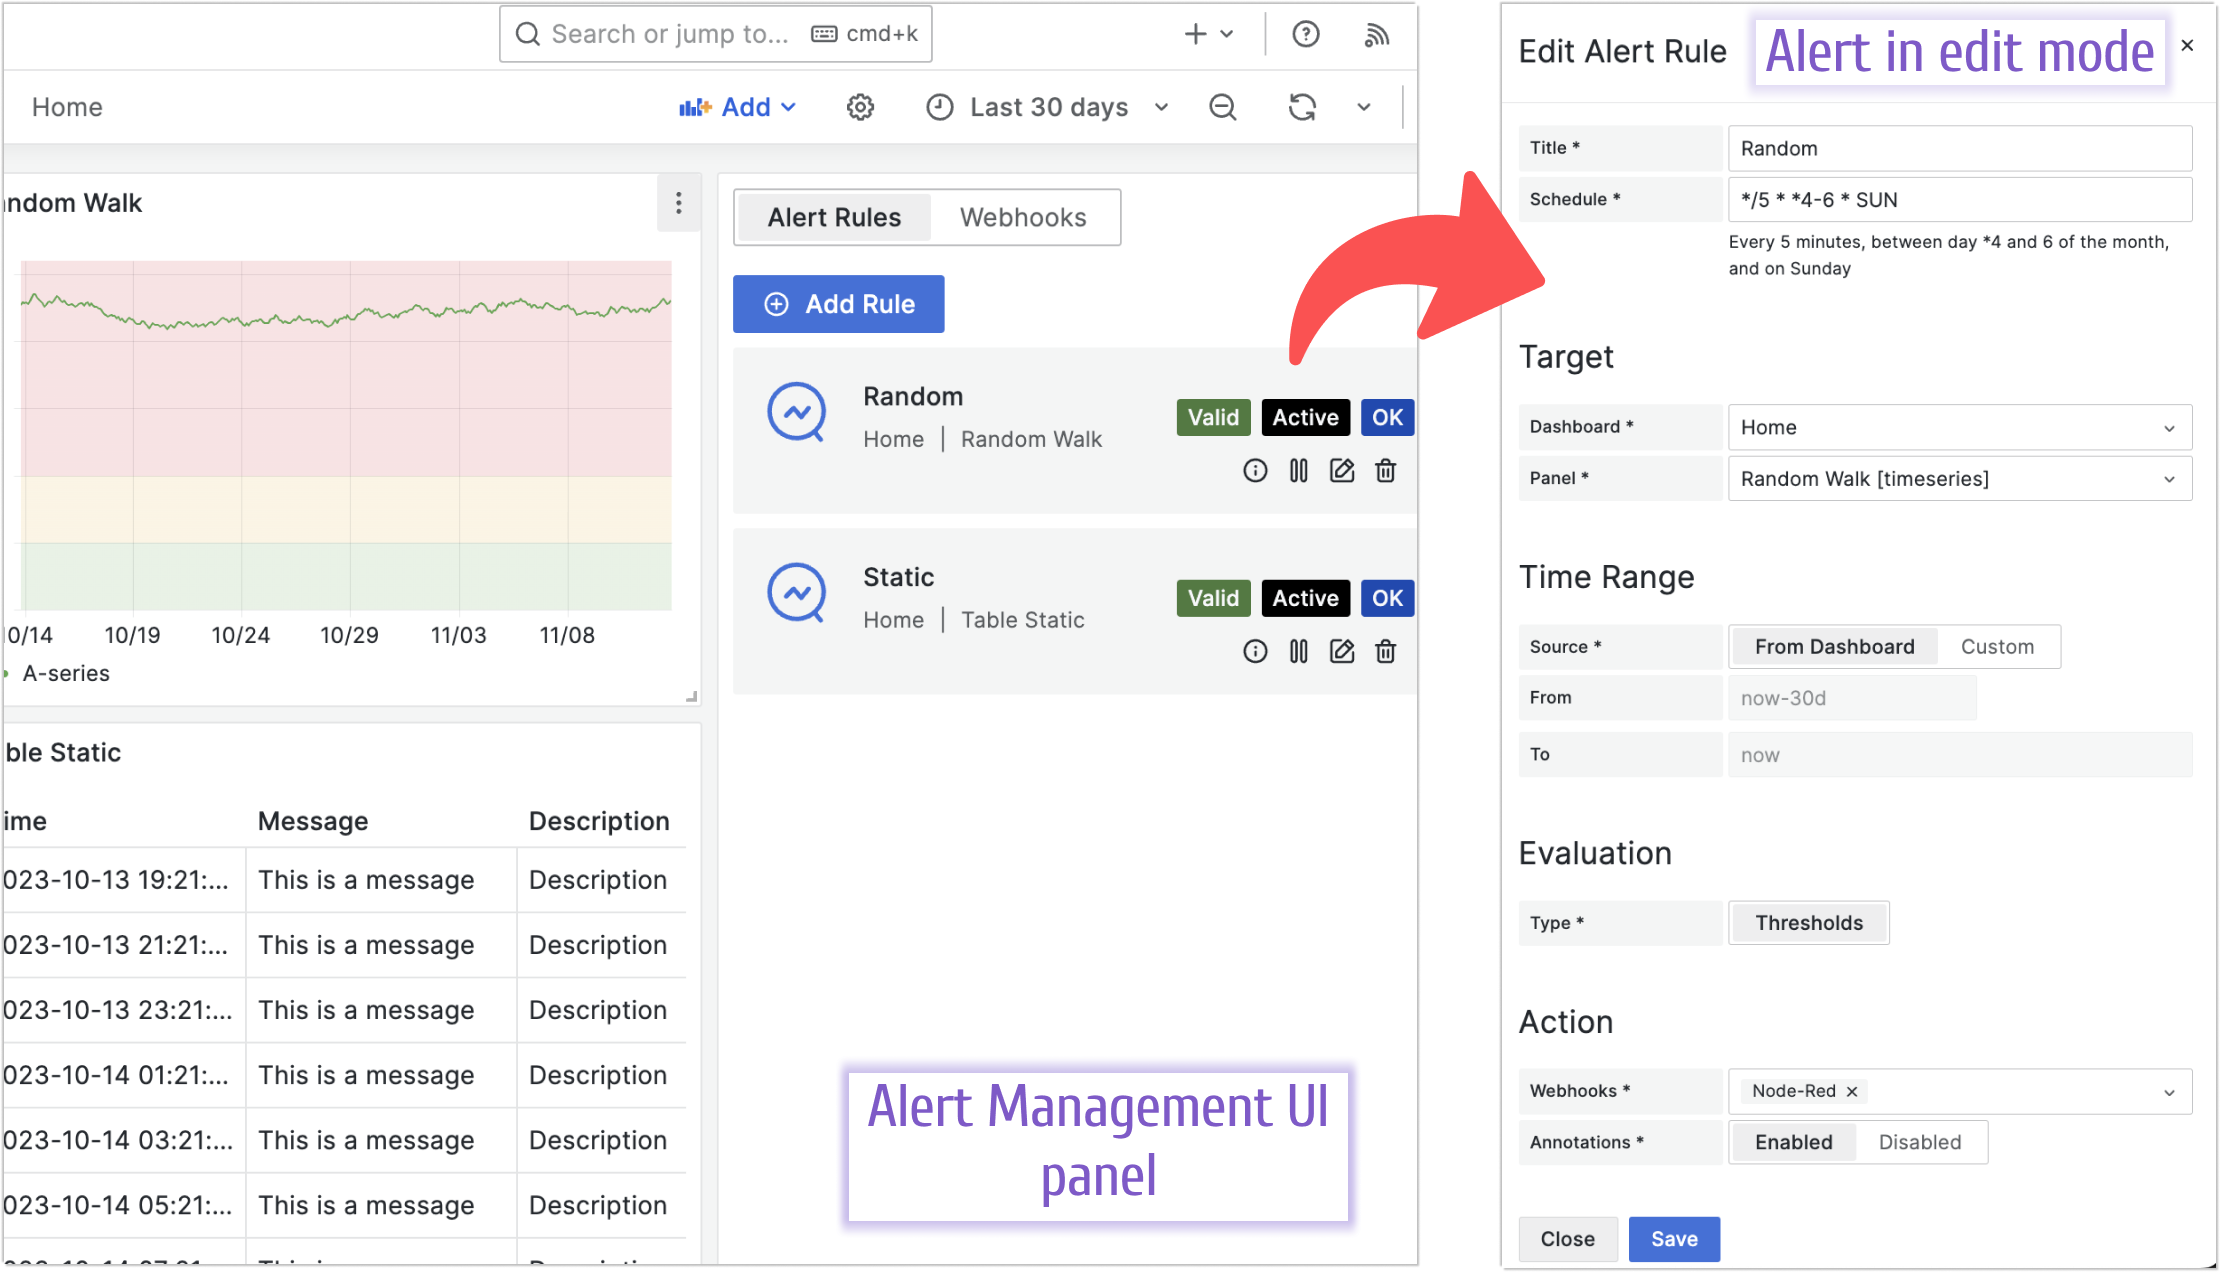
Business Alerting Panel
A single, intuitive screen simplifies rule creation for business users. Key settings include:
- Title: Name your alert.
- Schedule: Set frequency with CRON expressions.
- Target Dashboard/Panel: Auto-pull queries and thresholds from dropdowns.
- Time Range: Use dashboard defaults or customize.
- Action: Pick from pre-configured webhooks.
- Annotation: Opt out to skip annotation records.
Future enhancements will support hundreds of alerts with grouping and filtering.
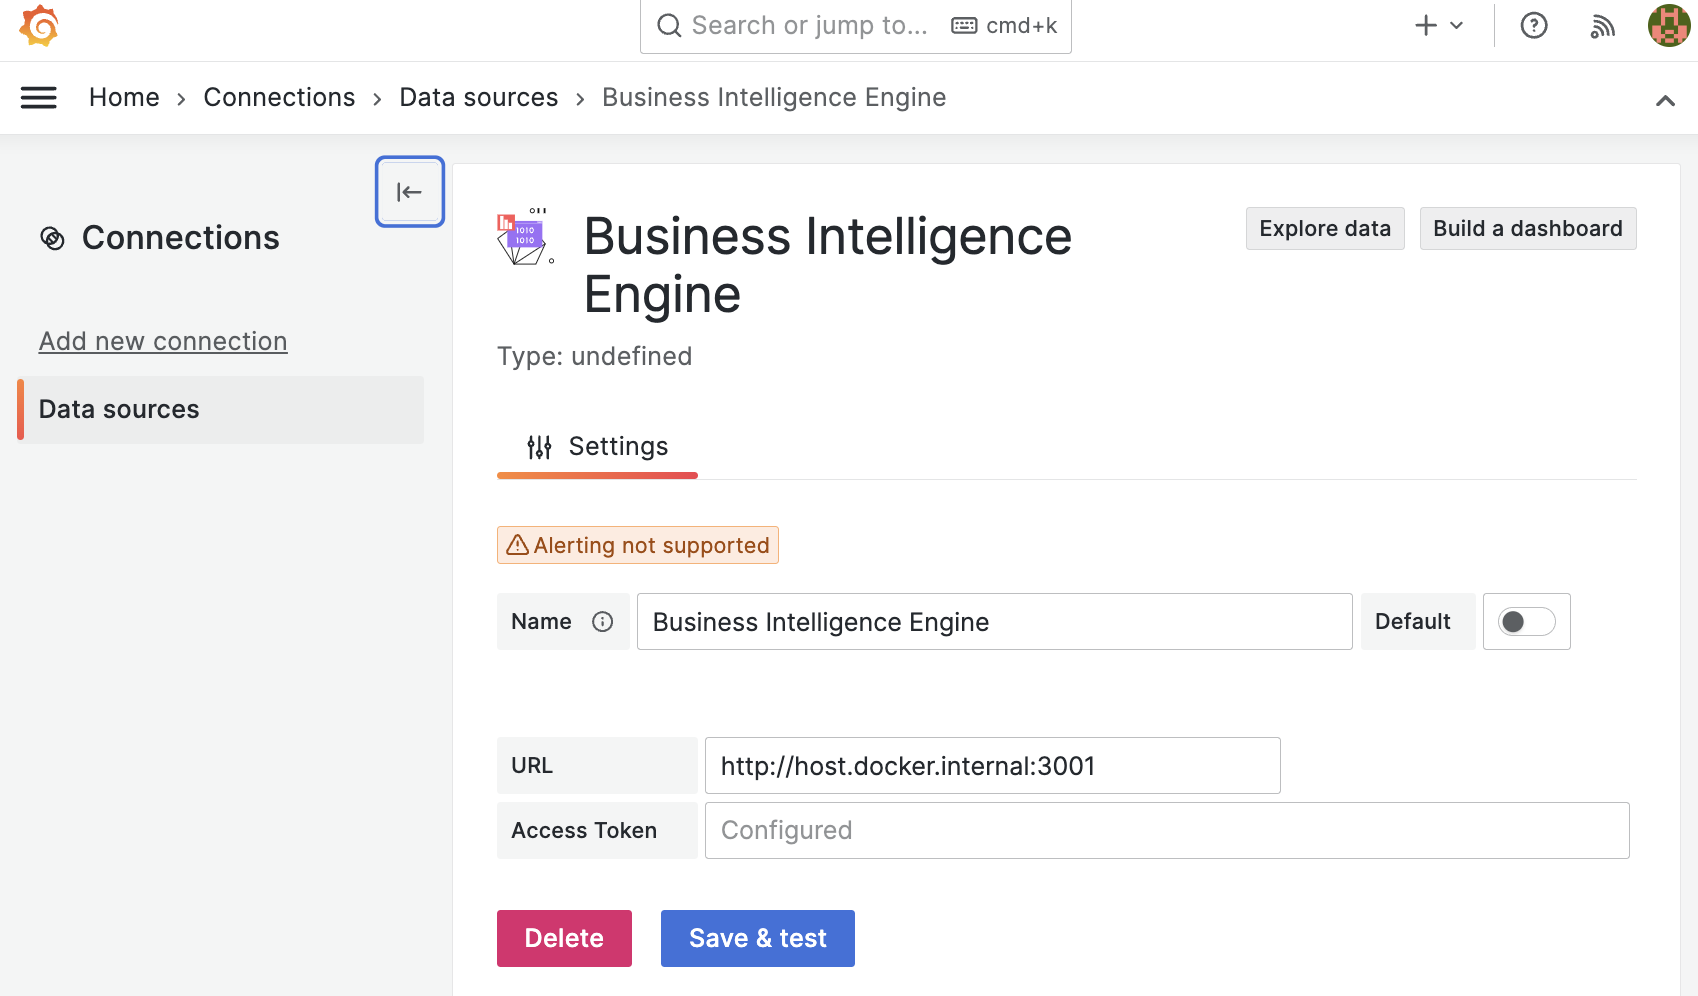
Business Engine
Our Alert Manager replacement:
- Leverages dashboard queries and thresholds, cutting redundant setup.
- Runs in a separate container for flexible architecture.
- Future-ready for AI-driven anomaly detection.
Connect via the Business Engine data source:
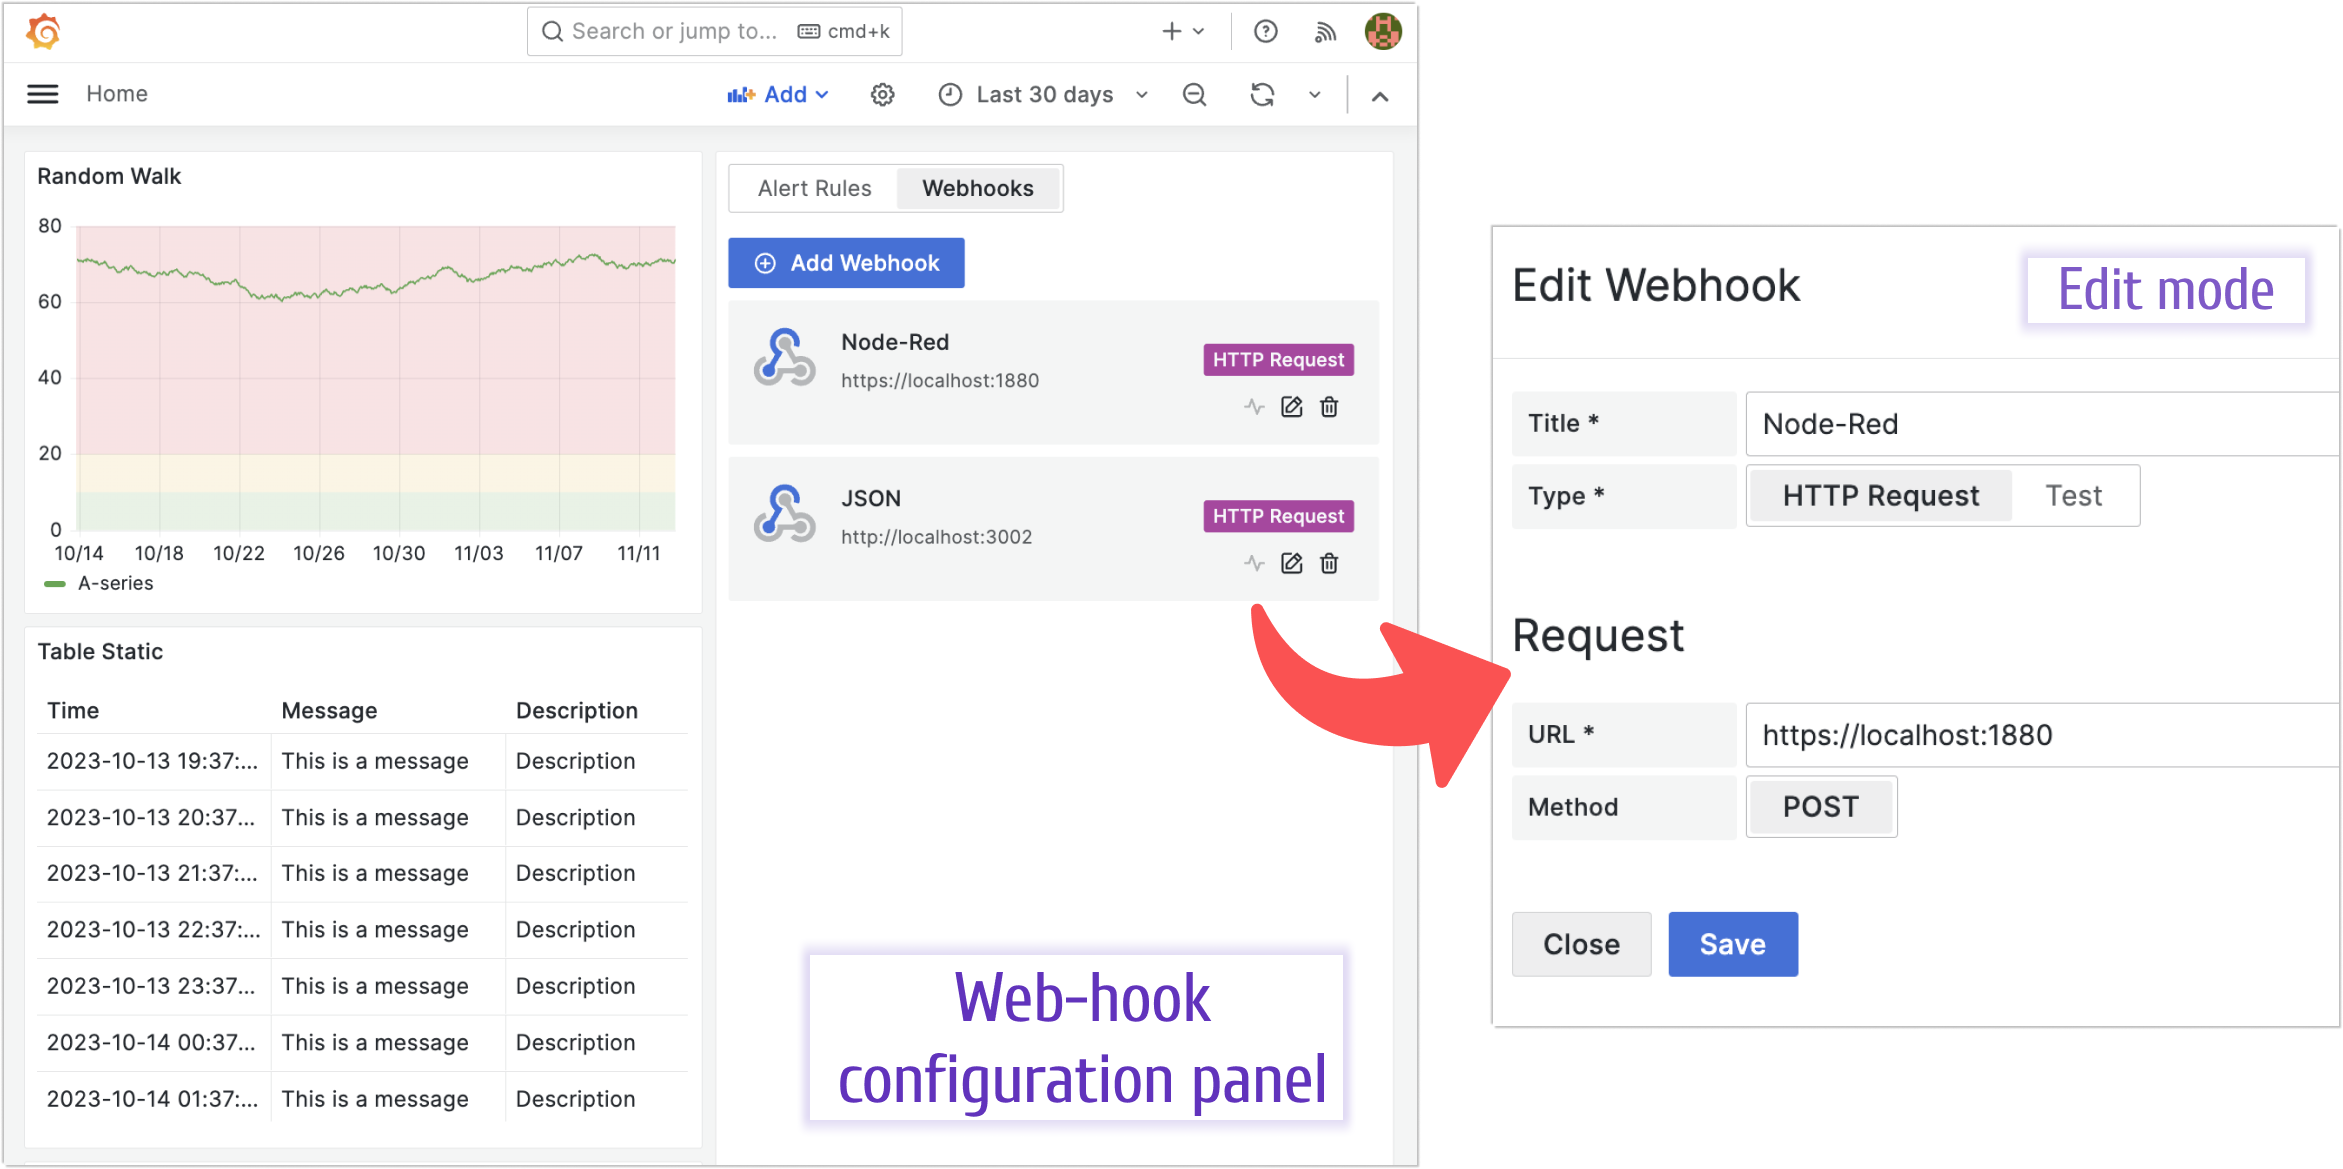
Webhooks Configuration
A dedicated panel lists webhooks, with edit mode offering:
- Name and type (HTTP or Test).
- Request URL and method (POST only, for now).
Why Business Alerting?
By consolidating controls, enhancing usability, and planning advanced features, we’re making alerting accessible beyond technical experts—enabling business teams in Grafana.
Getting Started
The Business Intelligence platform uses Docker containers to deliver a modular, scalable solution. Our Quick Start guide provides a simplest setup to get started.
We’d Love to Hear From You!
Have feedback or ideas? Get involved:
- Questions, Features, or Bugs: Open a Zendesk ticket for a prompt and dedicated response from our team.
- Join the Conversation: Subscribe to our YouTube Channel and share your thoughts in the comments.
Your input helps us improve, so don’t hesitate to get in touch!