Business Intelligence 2.4.0: Easier Grafana Connect, Alert Insights, and More


We’re thrilled to unveil the public preview of Business Intelligence 2.4.0, a release from Volkov Labs that enhances the Business Intelligence platform with:
- Seamless Grafana connection via Business Studio.
- Richer alert event details for troubleshooting.
- High Availability (HA) status in the Business Engine overview.
- A simplified scheduler for alert rules.
- Data frame previews within Business Studio.
- Clearer user prompts for configuration.
- An updated Business Engine API.
Discover how these updates streamline your BI experience below.
Connect Grafana via Business Studio
Gone are the days of manually tweaking the GRAFANA_TOKEN in config files. Now, Business Studio offers a user-friendly interface to link a Business Engine to a Grafana instance:
- Go to Business Engine > Environment page.
- Scroll to the Grafana section and click Edit.
- Enter the Grafana URL and Service Account token.
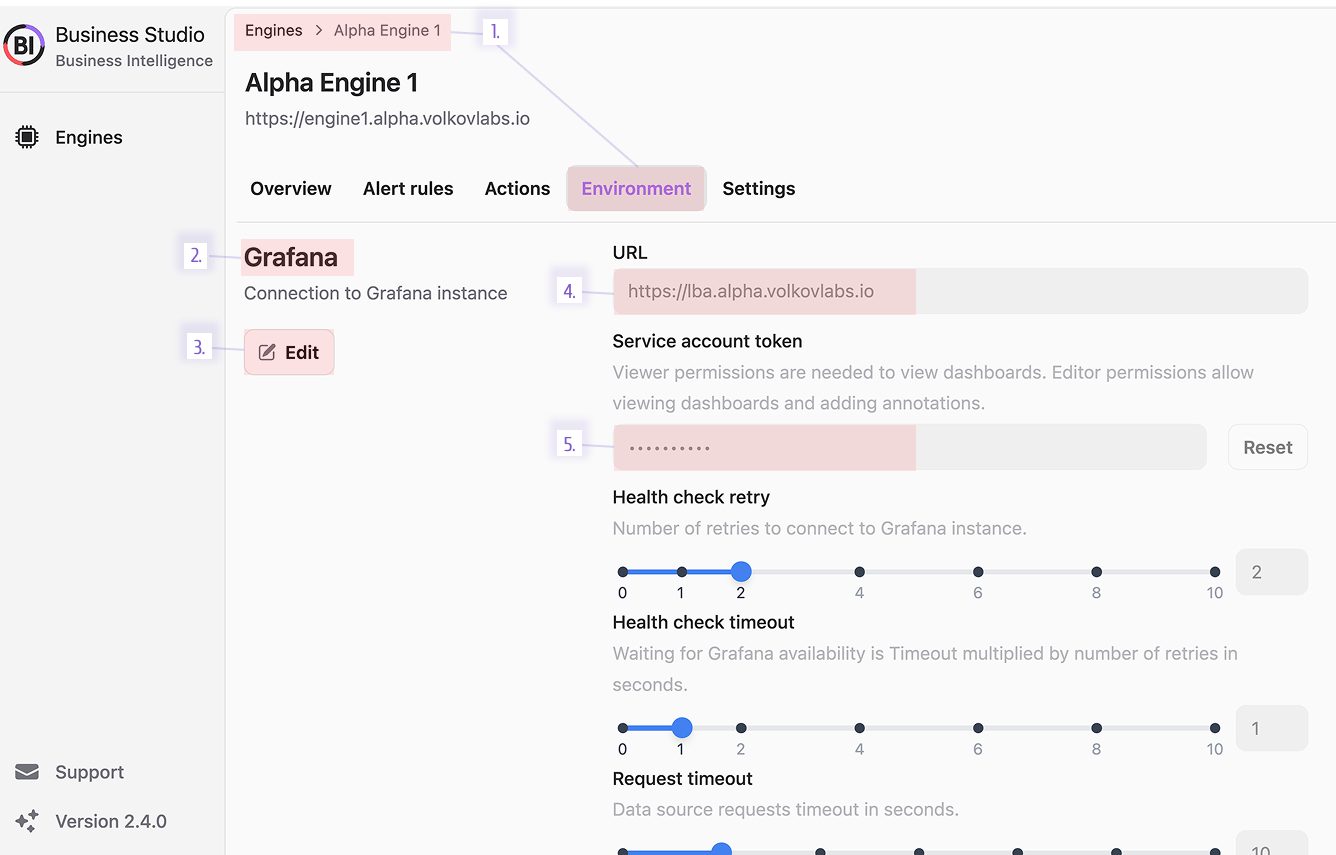
This updates the grafana_token in the environments table. In an HA setup, editing one engine syncs all others connected to the same database—no redundant tweaks needed.
Update one Business Engine, and all others in the cluster follow automatically.
Deeper Alert Event Insights
An “alert event” is a database record of an alert, also called an alert record.
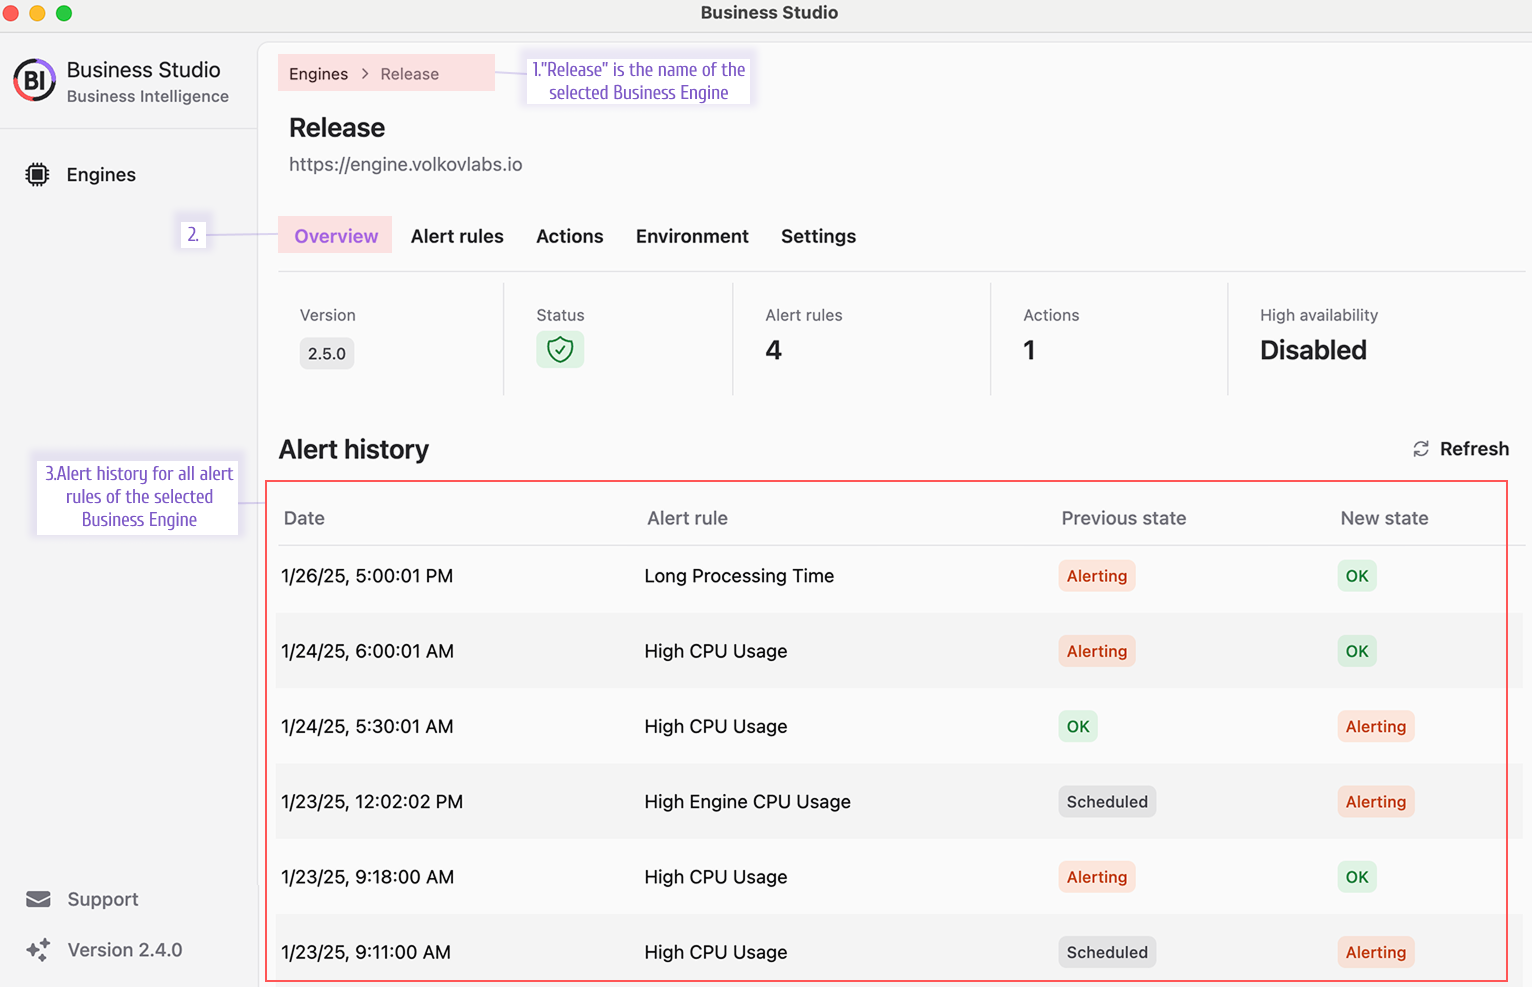
All Alert Rules
- Navigate to a Business Engine’s Overview page.
- Check the Alert History for a unified view of all alert events.
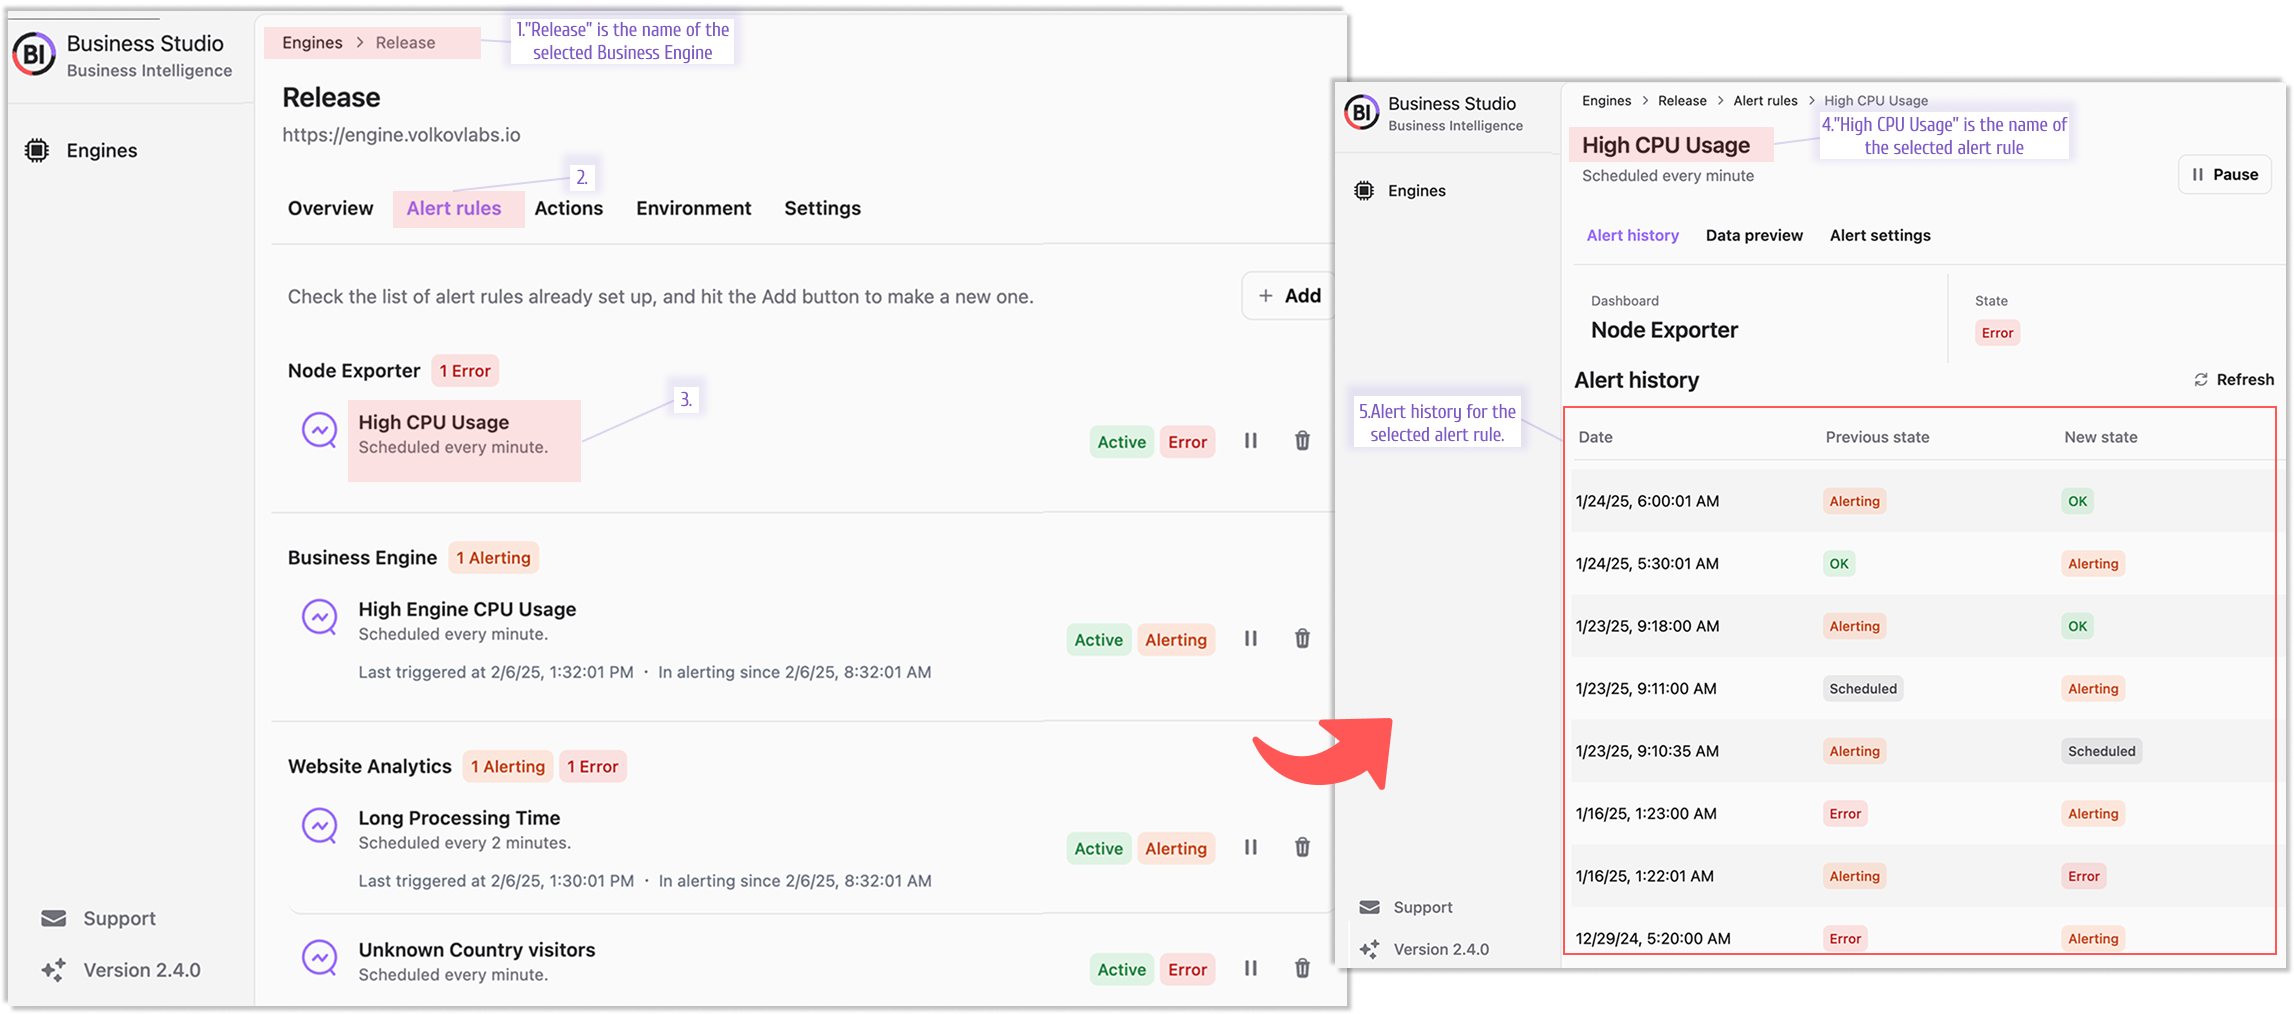
Single Alert Rule
- Go to the Alert Rules page, select a rule, and review its Alert History.
- Click an event to dive into details.
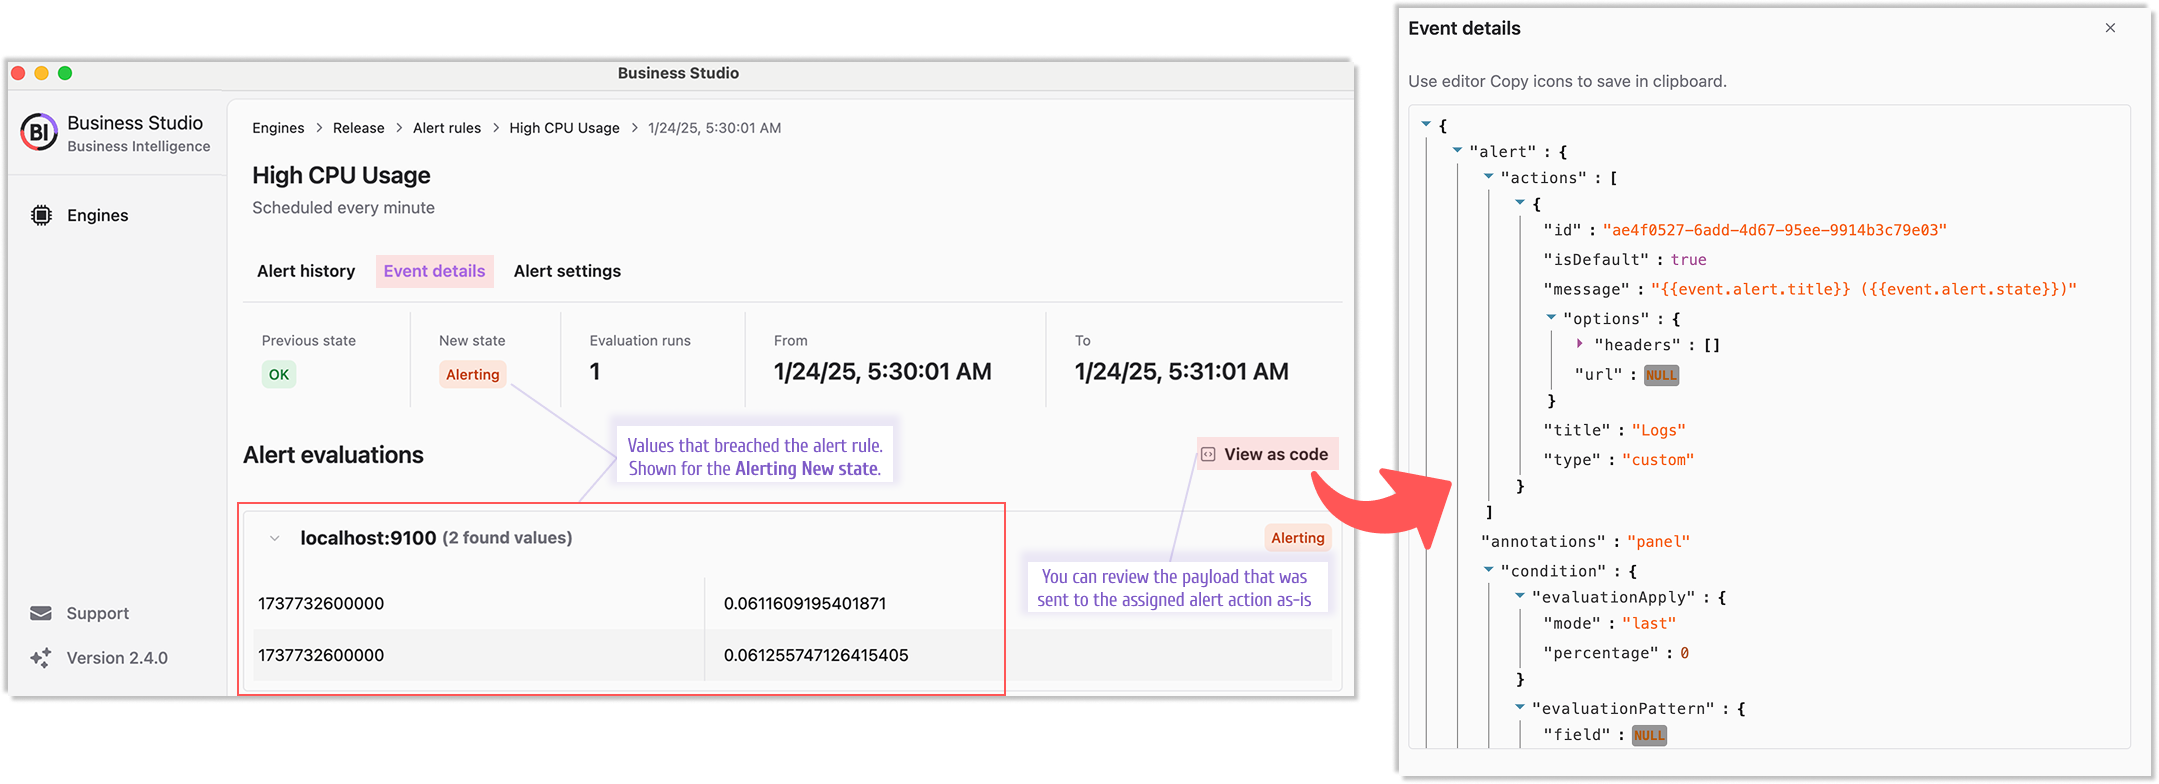
- Alerting State: The Alert Evaluations section highlights triggering values. Use View as Code for the full payload.
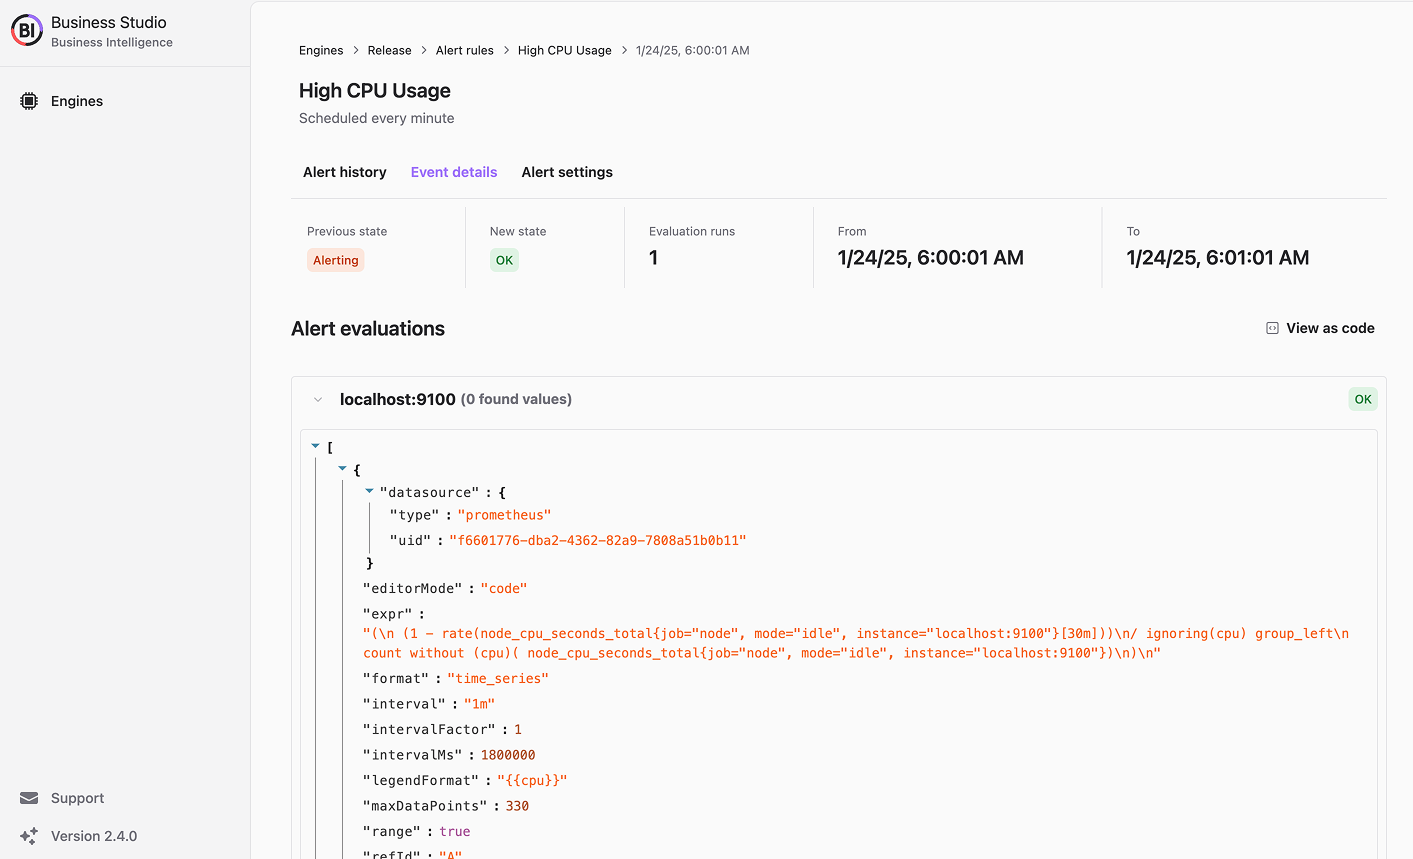
- Other States: Payloads display directly in Alert Evaluations.
These enhancements make troubleshooting faster and more precise.
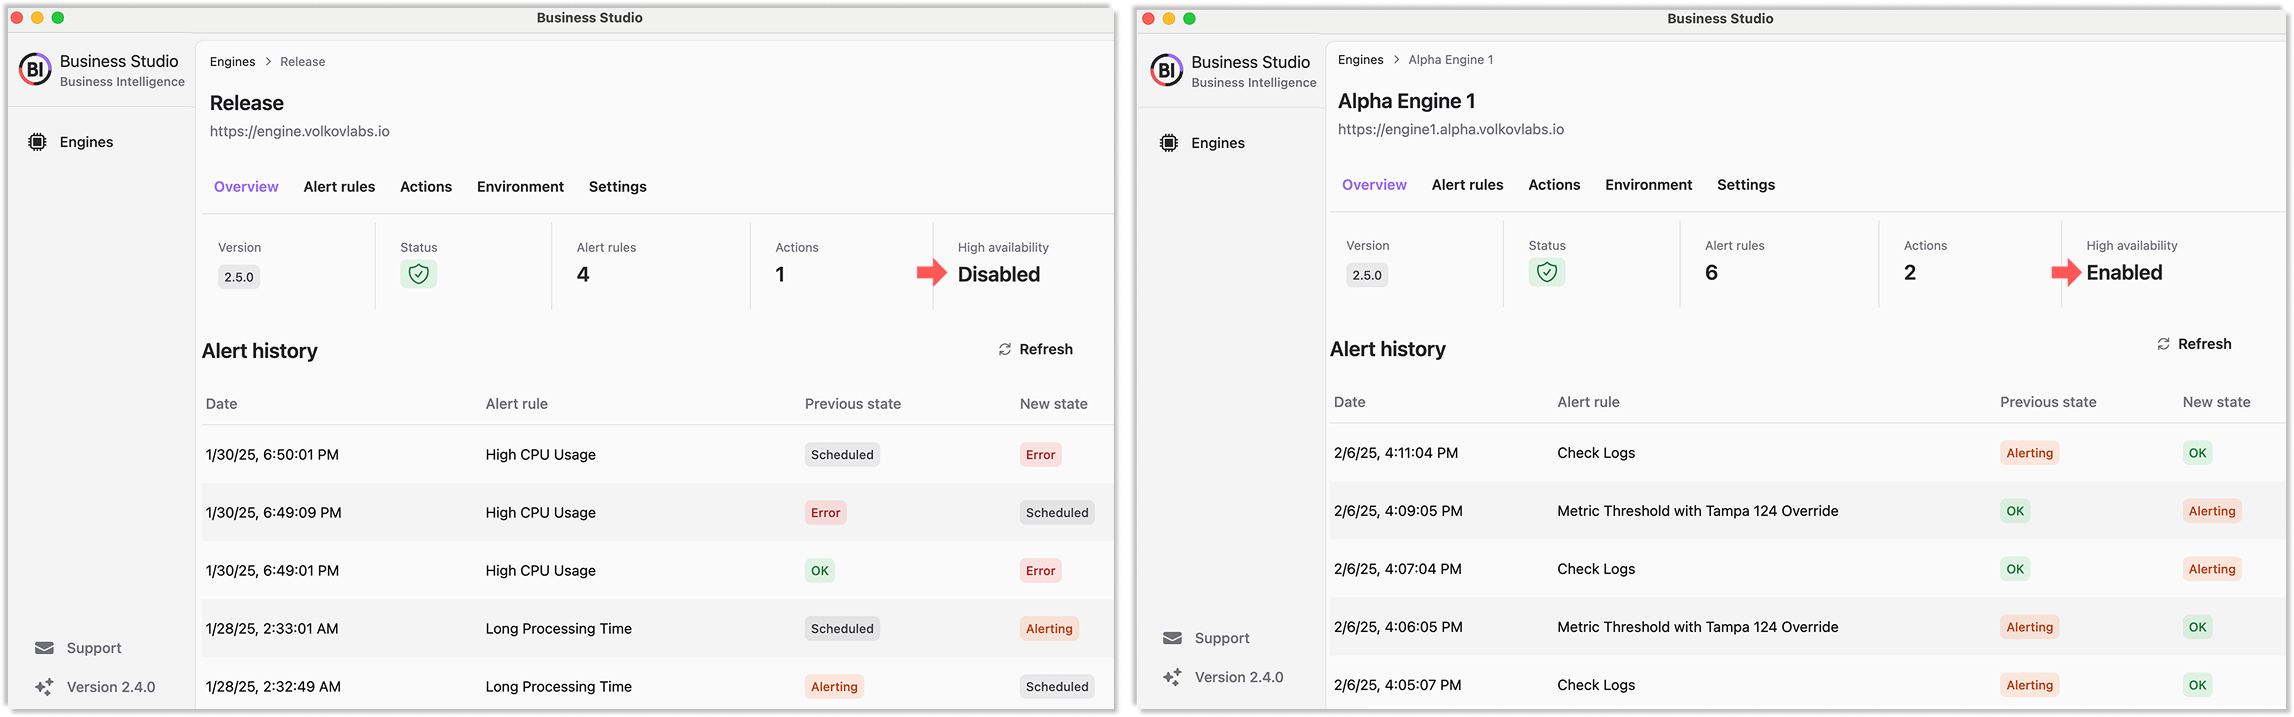
High Availability (HA) Status
The Business Engine Overview now flags HA status:
- Disabled: Solo engine in the cluster.
- Enabled: Multiple engines detected.
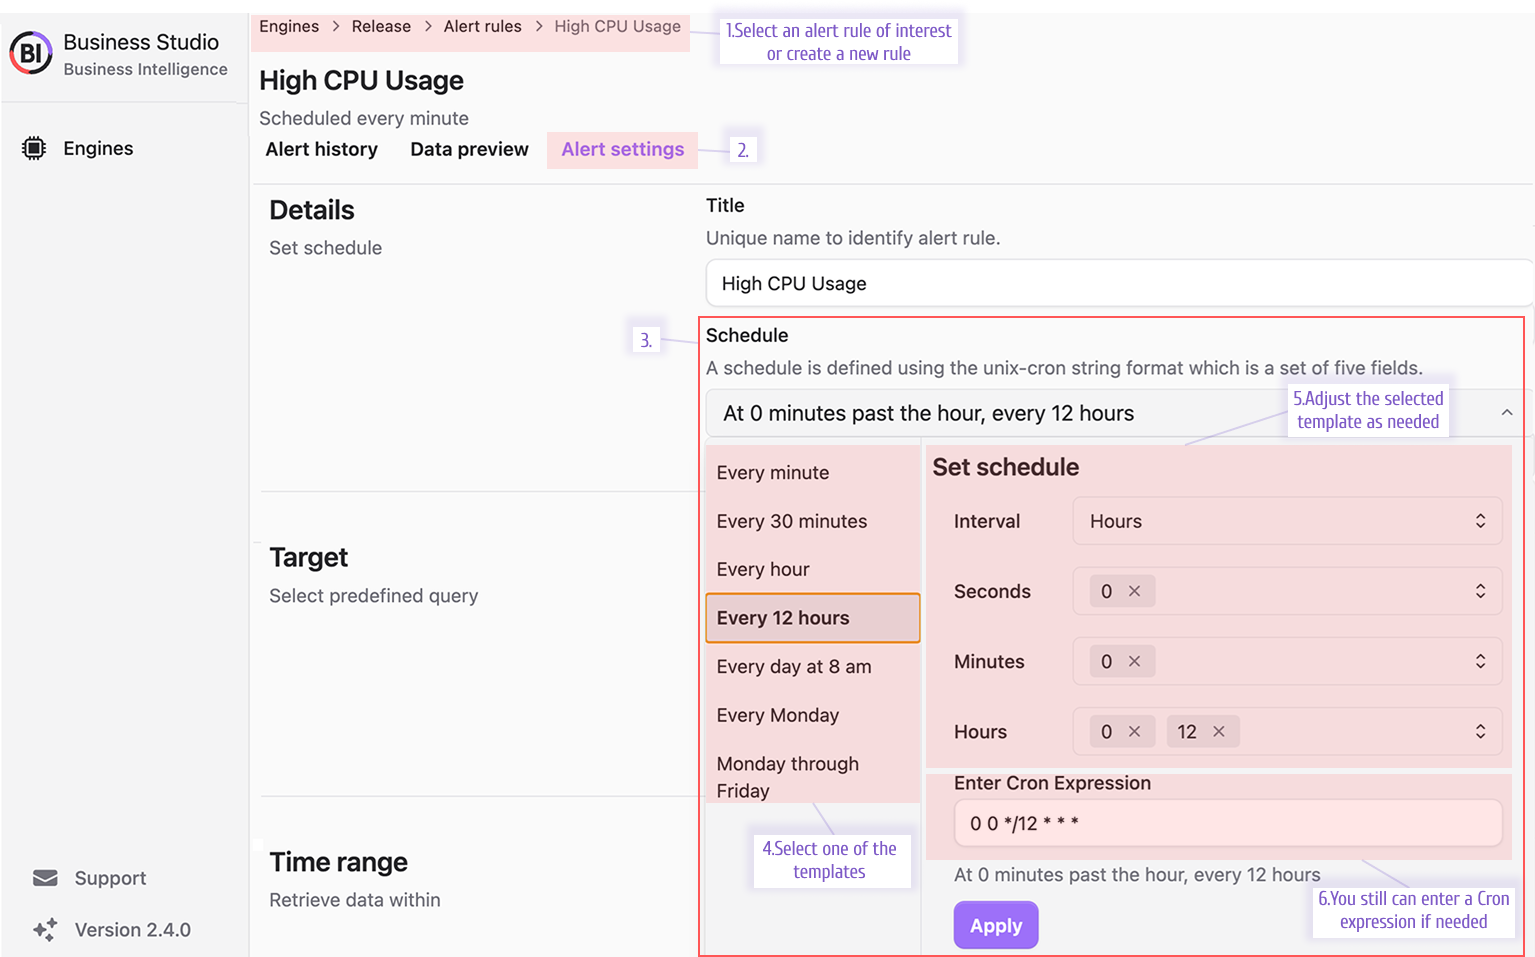
Simplified Alert Scheduling
Creating alert rules is now easier with preset templates alongside Cron expressions. Pick a template and tweak as needed—no Cron expertise required.
Preview Grafana Data Frames
See the data behind your alerts directly in Business Studio:
- Open an alert rule.
- (Optional) Confirm dashboard and panel on Alert Settings.
- Switch to Data Preview and adjust variables if needed.
- Review the data frame—or click View as Code for raw details.
- (Optional) Cross-check in Grafana’s Table View under panel edit mode.
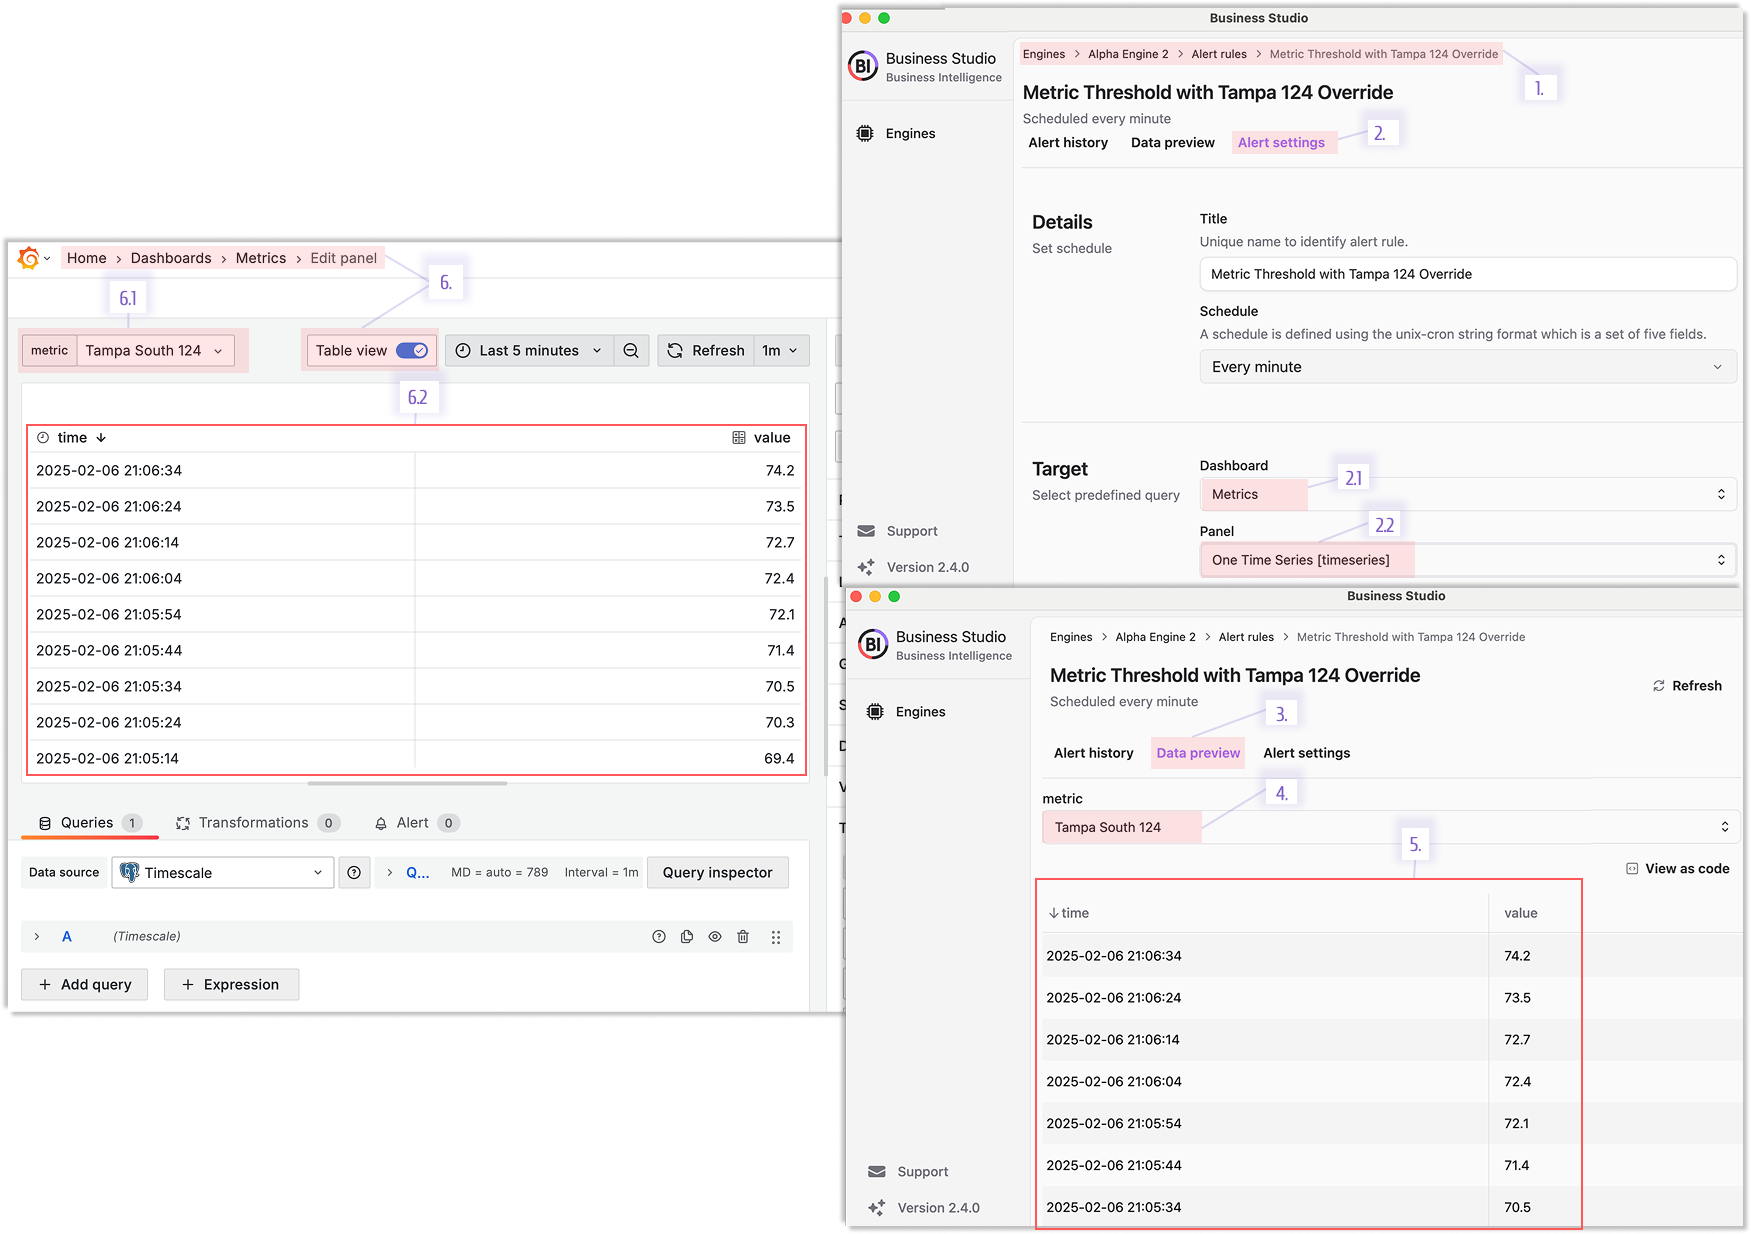
This transparency bridges Business Studio and Grafana seamlessly.
Clearer User Prompts
Enhanced prompts across the UI clarify parameter meanings, reducing setup confusion and boosting confidence.
Updated Business Engine API
The OpenAPI specification is refreshed, keeping third-party integrations smooth and aligned with 2.4.0’s features.
Downloads: Business Studio 2.4.0
MacOS and Windows installers are signed, notarized, and built via automated GitHub workflows for top security.
- MacOS:
- Linux:
- Windows:
Getting Started
Business Intelligence Platform is a powerful solution that harnesses Docker containers to deliver a modular, scalable, and user-friendly environment for alert-driven analytics. Whether you're just starting out or are an experienced user, our Quick Start Guide is designed to help you set up and deploy the platform effortlessly.
This guide provides a step-by-step walkthrough of the essential setup process, ensuring you can get up and running in no time. Key topics include:
- Configuring the Business Engine: Understand how to set up the core component that powers your analytics.
- Launching the Business Studio: Deploy and access the intuitive interface on your local machine for seamless management and visualization.
We’d Love to Hear From You!
Your feedback and ideas are invaluable to us! Here’s how you can get involved:
- Questions, Feature Requests, or Bugs: Submit a Zendesk ticket to receive a swift and personalized response from our dedicated support team.
- Join the Community: Subscribe to our YouTube Channel and share your thoughts or suggestions in the comments.
Your input is crucial in helping us grow and improve, so please don’t hesitate to reach out!