Business Reporting: Streamline Insights with Automation


We’re excited to introduce Business Reporting, a standout feature of the Business Intelligence platform, designed to revolutionize how you manage and share insights from your Grafana dashboards. With seamless integration for Grafana Open Source Software (OSS), automated workflows using Node-RED to deliver PNG reports via Gmail, and high-performance rendering, Business Reporting enables organizations to distribute critical data effortlessly.
Looking ahead, we’re thrilled to explore AI-driven analysis of dashboard screenshots to proactively detect issues across panels. Let’s dive into how Business Reporting can transform your workflows today and what innovative features are on the horizon!
Why Business Reporting Matters
In today’s fast-paced world, timely and accessible data is essential for informed decision-making. Business Reporting automates the capture, formatting, and distribution of dashboard insights within the Business Intelligence platform, saving time and ensuring consistency.
Whether you’re delivering daily performance metrics to executives or archiving reports for compliance, this feature simplifies the process. Here are the key benefits of Business Reporting:
- Automation of Routine Tasks: Schedule dashboard screenshots at regular intervals to eliminate manual effort.
- Seamless Grafana OSS Integration: Harness the power of Grafana Open Source Software for flexible, customizable dashboards.
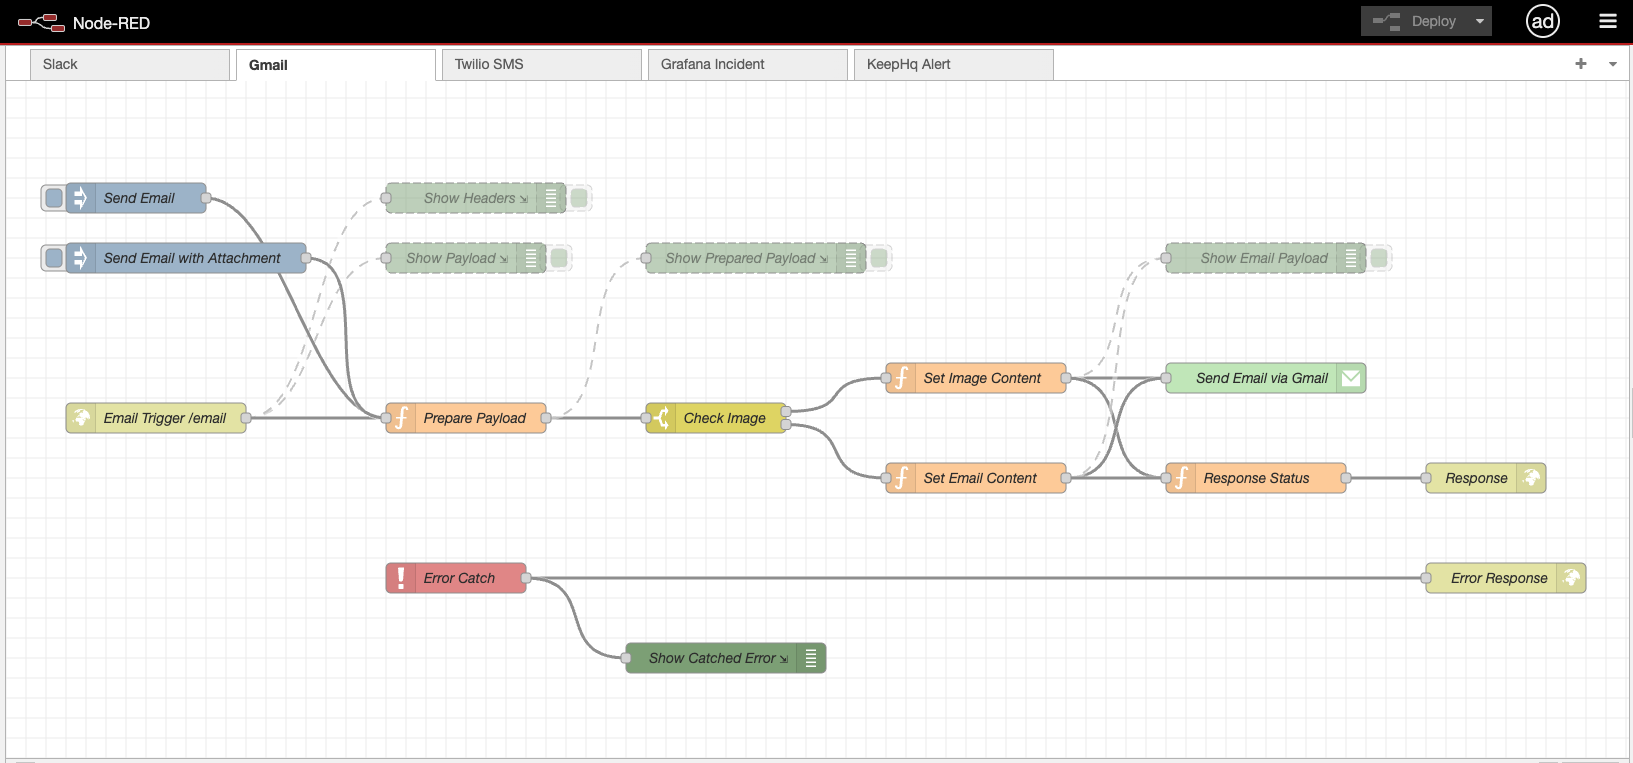
- Efficient Distribution: Use Node-RED workflows to send PNG reports directly via Gmail, keeping stakeholders informed.
- High Performance: Leverage the Image Renderer Microservice with GPU acceleration for rapid rendering.
- Scalable and Reliable: Designed to manage data-intensive dashboards with proven real-world reliability.
Ready to transform your reporting process? Let’s explore the details!
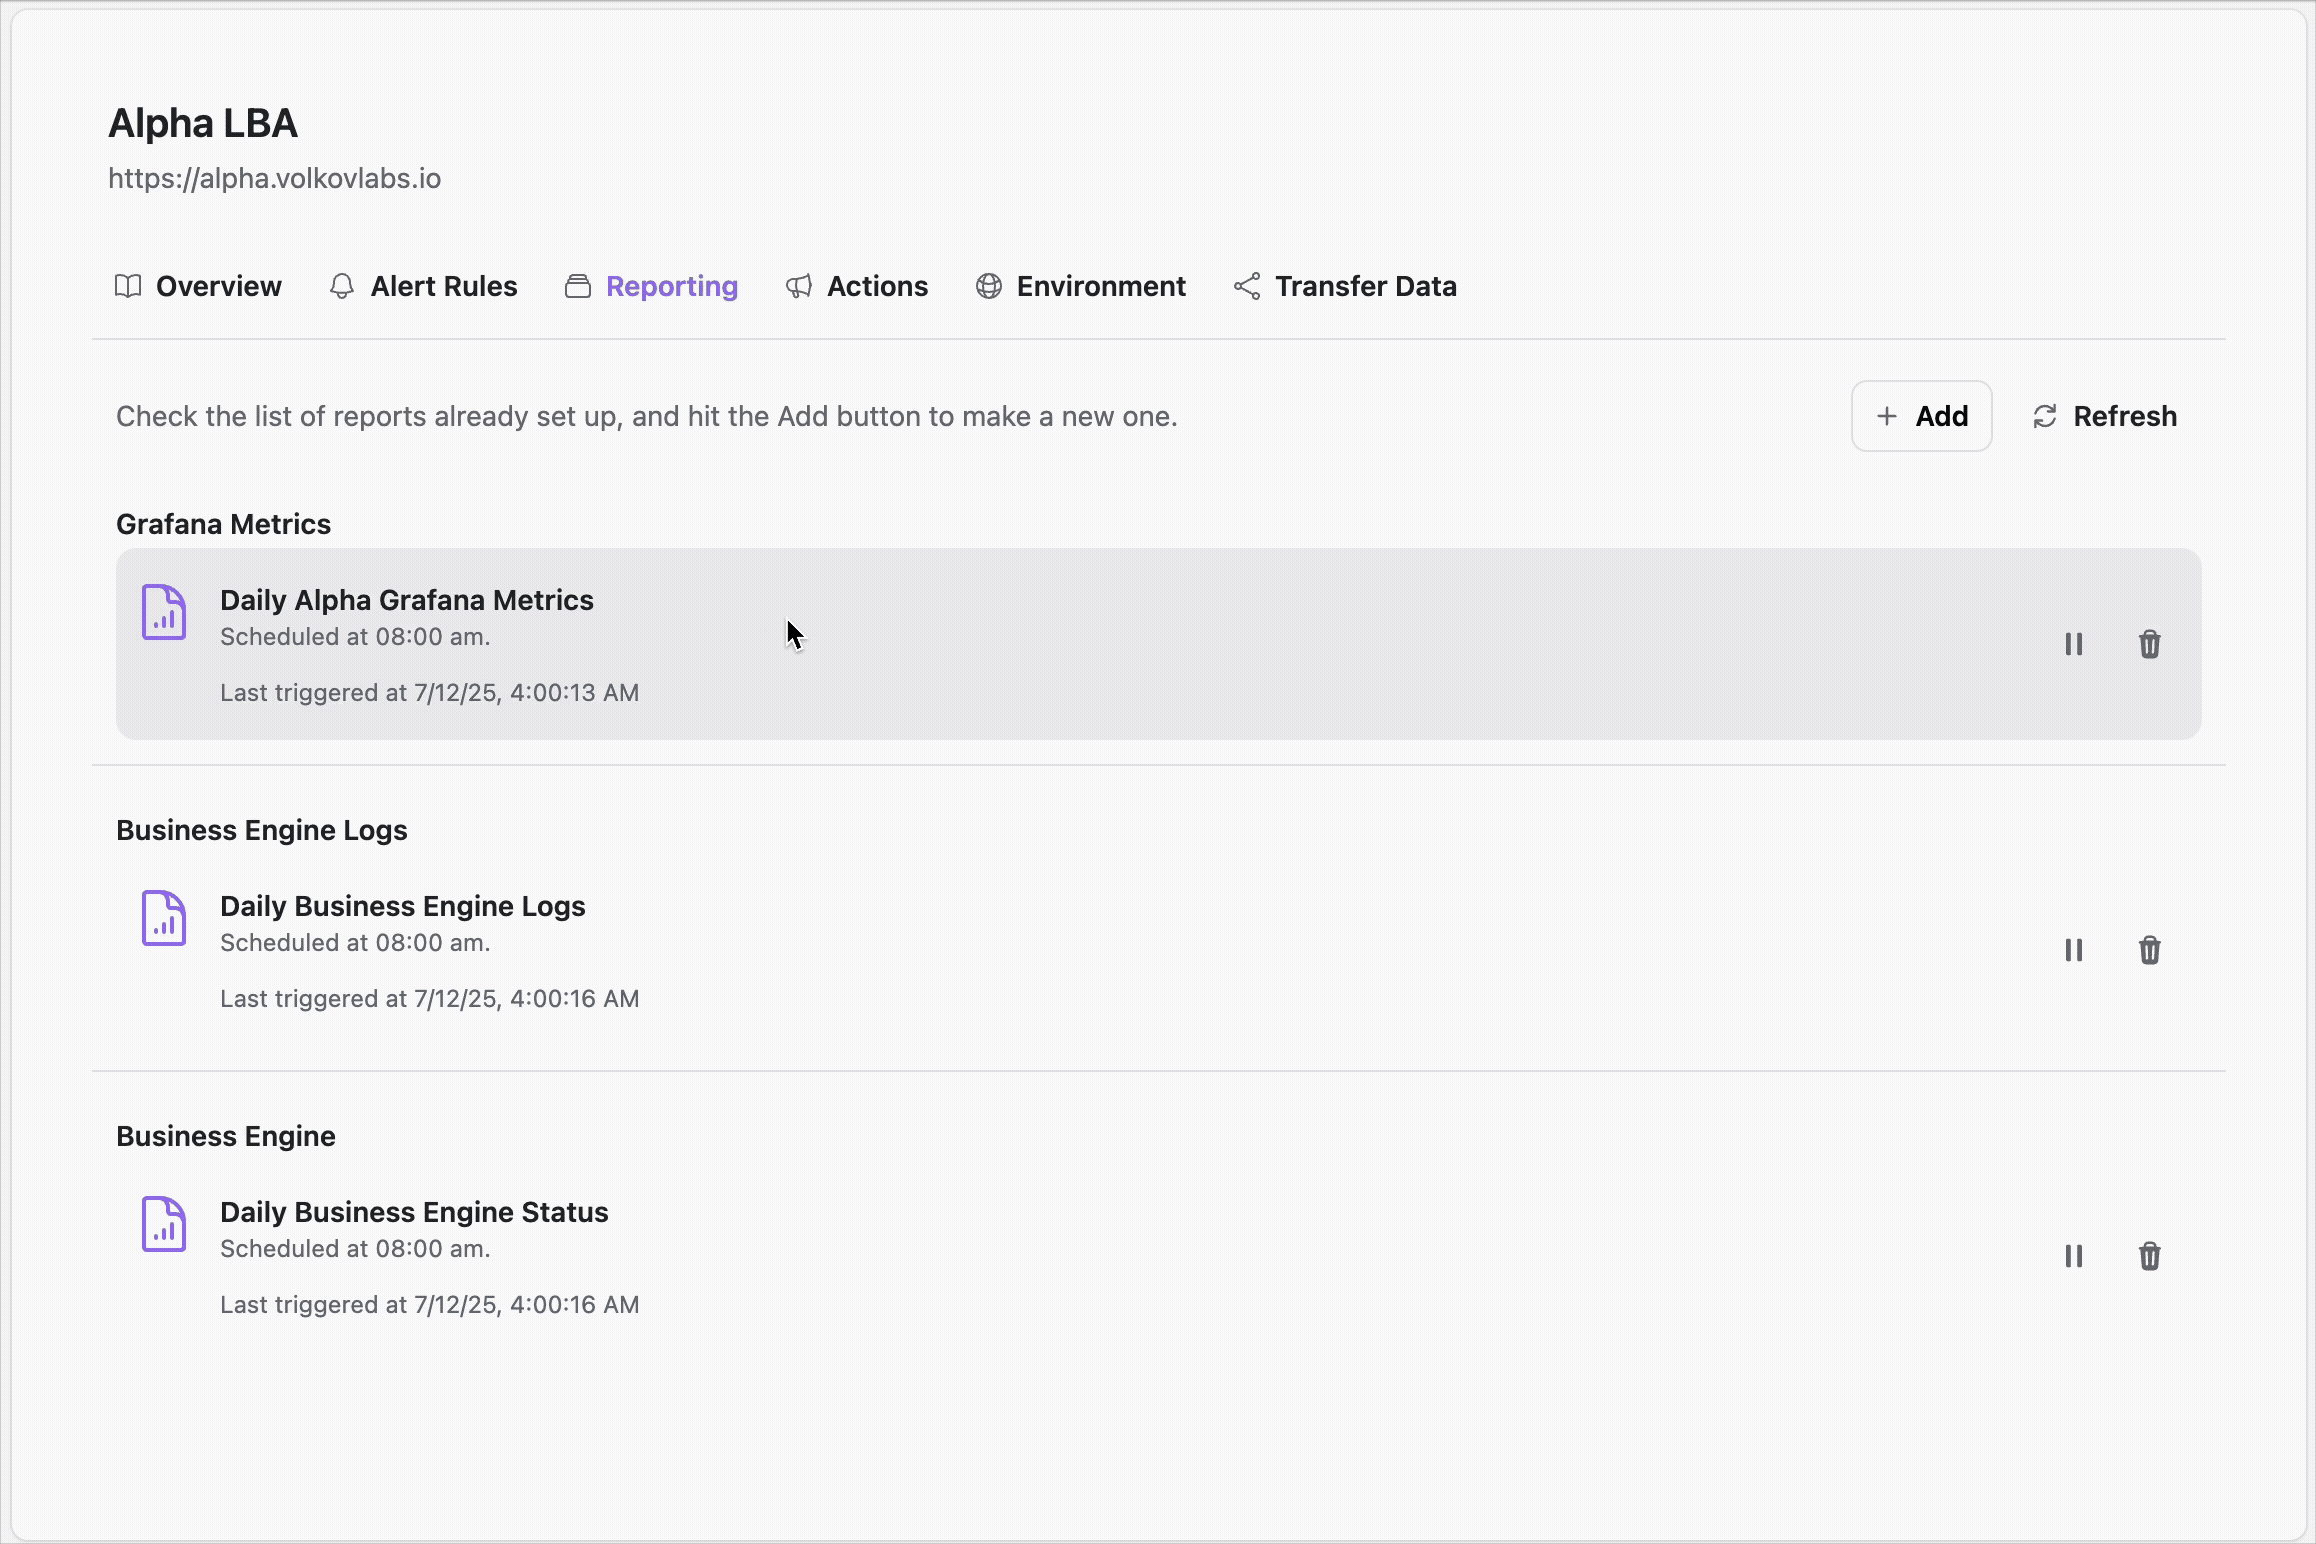
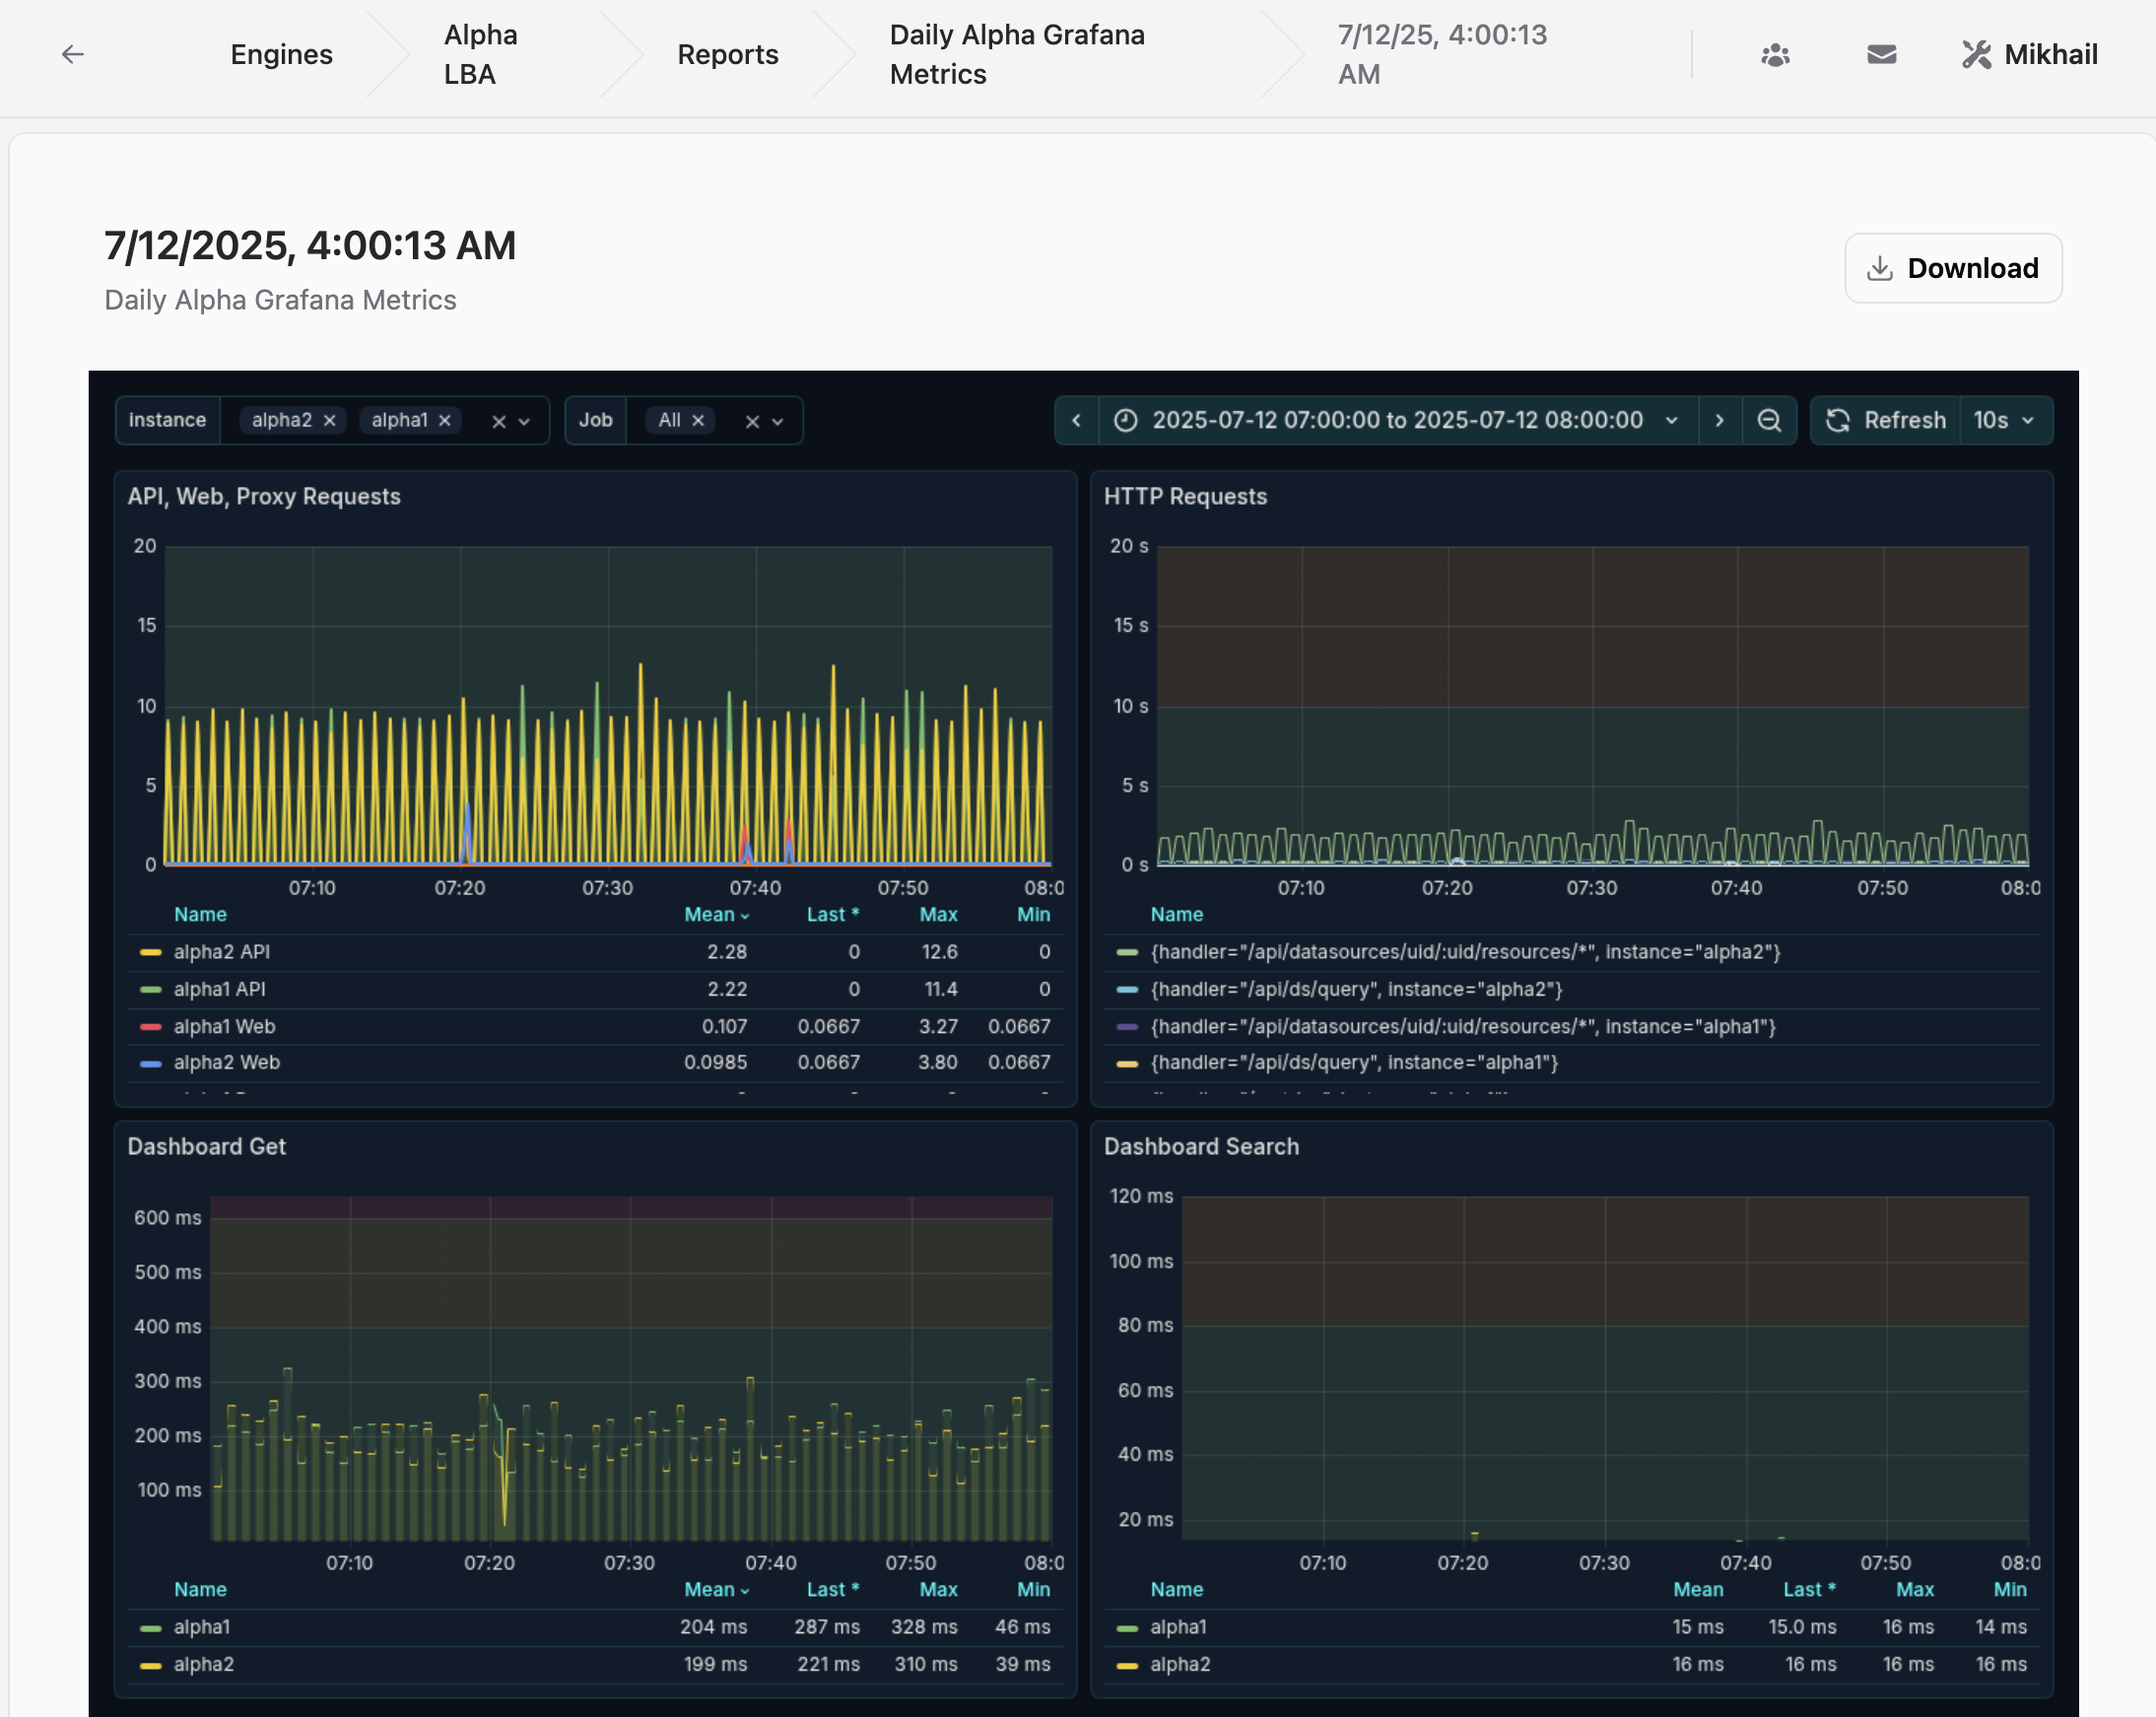
Automate Insights with Scheduled Dashboard Screenshots
Business Reporting enables you to automate dashboard snapshots at predefined intervals. Integrated with action workflows, this feature supports effortless reporting for daily summaries, weekly reviews, or compliance requirements.
- Why It Matters: Automation allows your team to focus on analysis rather than repetitive tasks.
- Ideal For: Ensuring consistent report delivery without manual intervention.
Harness Grafana OSS for Flexible Dashboards
Business Reporting fully supports Grafana Open Source Software (OSS), enabling you to leverage Grafana’s powerful visualization tools without licensing costs. Tailor dashboards to your organization’s needs while Business Reporting handles the distribution of insights.
- Why It Matters: Grafana OSS offers a cost-effective, open-source solution for robust data visualization.
- Ideal For: Organizations of all sizes seeking value-driven monitoring tools.
Distribute PNG Reports via Gmail with Node-RED Workflows
Sharing reports is now effortless. With Node-RED workflows, Business Reporting automatically sends dashboard screenshots as PNG files directly to Gmail. This ensures stakeholders receive updates in a familiar format without needing to access the platform.
- Why It Matters: Streamlined communication keeps everyone informed with minimal effort.
- Ideal For: Teams sharing insights with external partners or executives on the move.
Enhance Speed with GPU-Accelerated Image Renderer Microservice
Performance is critical for data-heavy dashboards. The Image Renderer Microservice within the Business Intelligence platform supports GPU acceleration, delivering exceptional speed for rendering screenshots. Even complex dashboards are captured and shared without delays.
- Why It Matters: Faster rendering ensures quicker access to insights, even under heavy workloads.
- Ideal For: High-frequency reporting or dashboards with intricate visualizations.
Future Vision: AI-Driven Analysis of Dashboard Screenshots
We’re excited to share our roadmap for Business Reporting. In future updates, we plan to introduce AI-driven analysis of dashboard screenshots. This cutting-edge feature will evaluate all panels in a screenshot, correlate data, and proactively identify potential issues or anomalies.
Imagine receiving not just a static report, but actionable insights that highlight concerns before they escalate!
- Why It Matters: AI will elevate static reports into dynamic tools for proactive problem-solving.
- Ideal For: Critical environments where early issue detection can prevent downtime or losses.
Why Choose Business Reporting in the Business Intelligence Platform?
Business Reporting is more than a tool—it’s a game-changer for managing and sharing data. By automating workflows, supporting Grafana OSS, and integrating with Node-RED for seamless distribution, it enables your team to focus on actionable insights.
Top Reasons to Adopt Business Reporting:
- Effortless Automation: Save time with scheduled screenshots and automated distribution.
- Grafana OSS Compatibility: Benefit from open-source flexibility for cost-effective solutions.
- Instant Sharing: Deliver PNG reports via Gmail using Node-RED for real-time updates.
- Superior Performance: GPU-accelerated rendering ensures speed and reliability.
- Future-Ready Innovation: Stay ahead with upcoming AI-driven analysis for smarter reporting.
Don’t wait—start revolutionizing your reporting workflows with Business Reporting in the Business Intelligence platform today!
Getting Started
Business Intelligence Platform is a powerful solution that harnesses Docker containers to deliver a modular, scalable, and user-friendly environment for alert-driven analytics. Whether you're just starting out or are an experienced user, our Quick Start Guide is designed to help you set up and deploy the platform effortlessly.
This guide provides a step-by-step walkthrough of the essential setup process, ensuring you can get up and running in no time. Key topics include:
- Configuring the Business Engine: Understand how to set up the core component that powers your analytics.
- Launching the Business Studio: Deploy and access the intuitive interface on your local machine for seamless management and visualization.
We’d Love to Hear From You!
Your feedback and ideas are invaluable to us! Here’s how you can get involved:
- Questions, Feature Requests, or Bugs: Submit a Zendesk ticket to receive a swift and personalized response from our dedicated support team.
- Join the Community: Subscribe to our YouTube Channel and share your thoughts or suggestions in the comments.
Your input is crucial in helping us grow and improve, so please don’t hesitate to reach out!