Render templates, JS context, and improved re-render in Business Text 4.3.0

We're excited to announce the release of the Business Text panel 4.3.0. This release includes the following updates:
- Extended the list of Render Templates.
- Simplified access to the panel data and the selected data frame along with some other features via a new object
context. - Added a new
variableValuehelper. - Improved re-render action.
- Added compatibility with Grafana 10.2.2 and upcoming 10.3.0.
Toward the end of this article, I included some fascinating use cases, thank you for submitting them (see credits below).
New Render Template
The Render template parameter instructs the plugin on how to apply the content template (the Content parameter) to the fetched data.
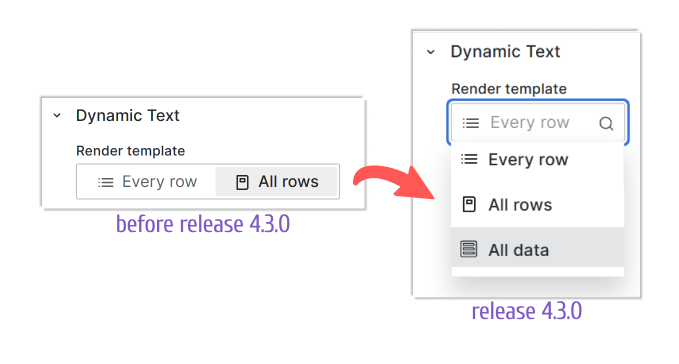
The existing previously templates:
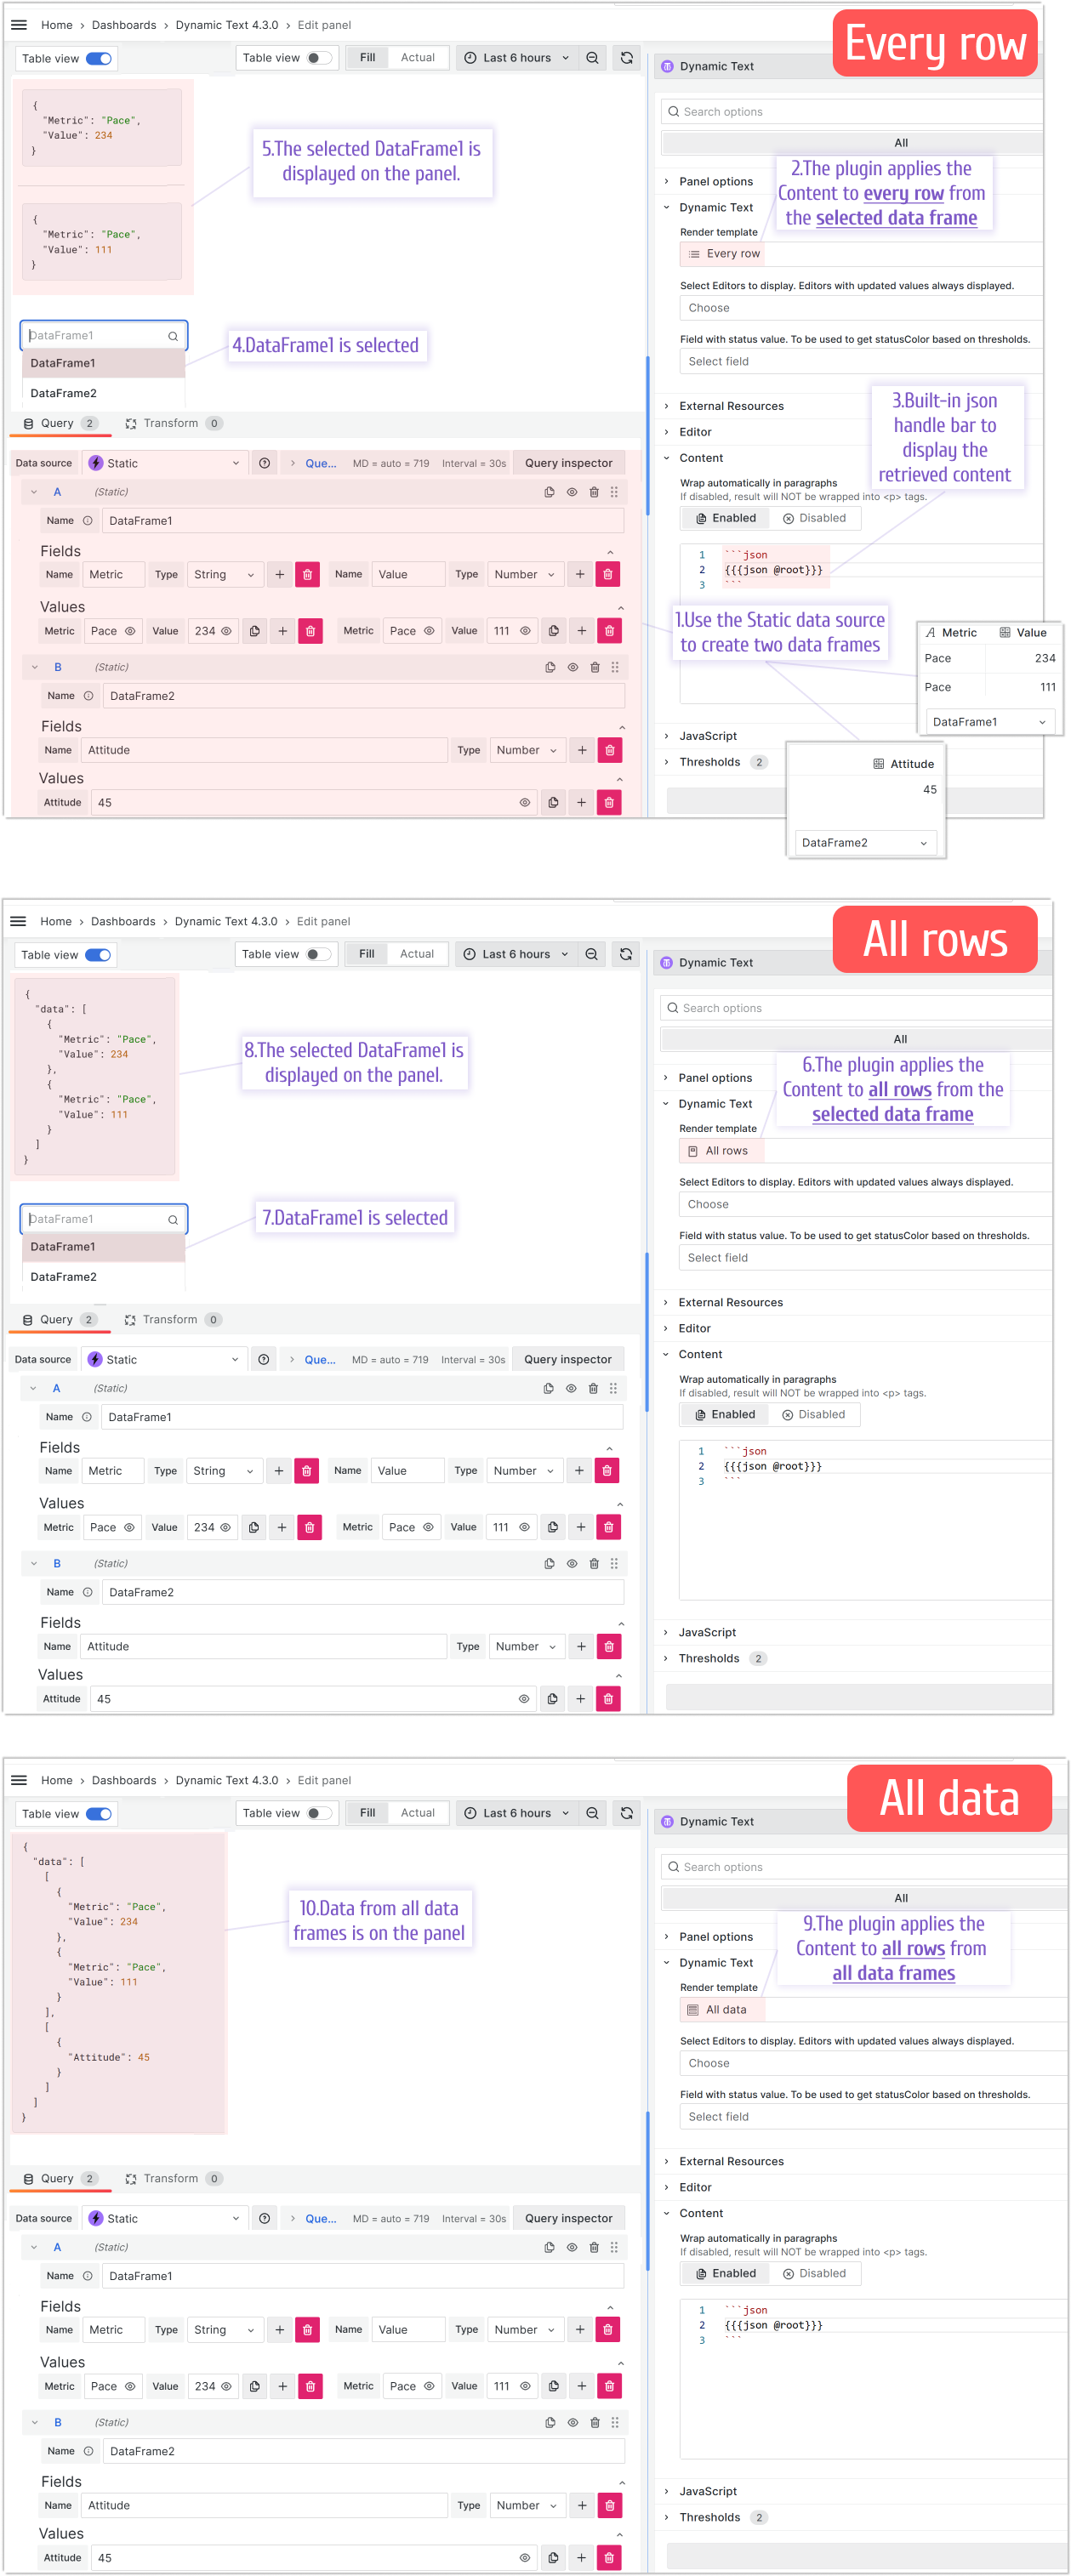
- Every row - the content template applies to every row from the fetched data of the selected data frame.
- All rows - the content template applies to all rows from the fetched data of the selected data frame.
The new template:
- All data - the content template applies to all rows from the fetched data of all specified data frames.
Below are the illustrations of all three Render templates created using data generated by the Static data source. Follow the order number in the comments, starting from 1.
Content
Referencing data in the All data template
Below is an example illustrating how you can reference data in the All data template.
If your data looks like this:
{
  "data": [
    [
      {
        "Metric": "Pace",
        "Values": 234
      },
      {
        "Metric": "Pace",
        "Values": 111
      }
    ],
    [
      {
        "Attitude": 45
      }
    ]
  ]
}
You can reference it using the following code:
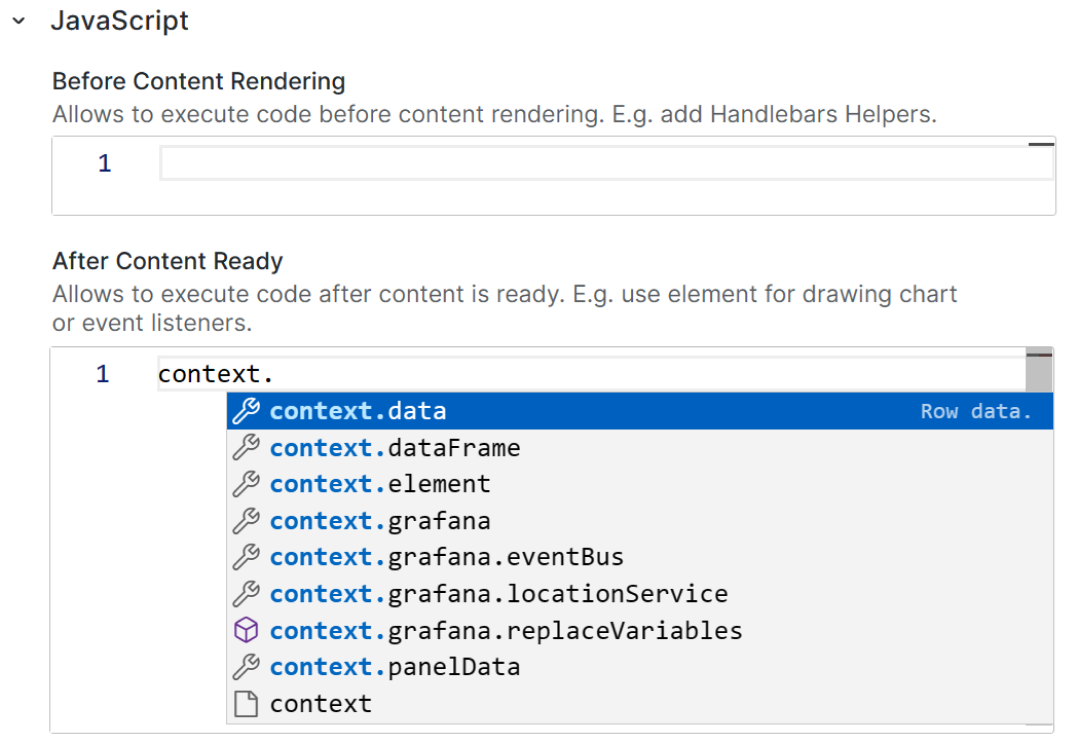
Simplified access via a new object context
Starting from this release, we allowed access to the panel data panelData and selected data frame data via a new object context.
In addition, we are actively working on refactoring existing JavaScript and Grafana parameters and made them a part of the context.
Start typing the context word in the Before Content Rendering or After Content Ready boxes and see the latest list of all available features.
New helper - variableValue
The existing helper variable supports only one format. The variableValue is a new helper implemented starting from this release. It works with all Grafana variable formats.
Below is an example for the queryparam type.
If example equal to ["value1", "value2"] then result will be:
<a href="/d/abc?var-example=value1&var-example=value2">Link</a>
Re-render on dashboard refresh
This feature adds refresh to the list of events triggering the Business Text panel re-render action.
Let's say, your Content contains a dashboard variable. Before this release, when the variable takes a new value (is updated by a user or API), the Business Text panel was not reacting. After this release, any variable change triggers the panel re-render action.

Community use-cases
Flowchart
Thank you Josiah Solomon for exploring an epic Flowchart.js return to Grafana! We are happy to share your example with the world.
Below you can find how the beloved by many Flowchart libraries can be implemented using the Dynamic Text plugin. Simply, add two external libraries and then write your code addressing the Flowchart libraries directly.
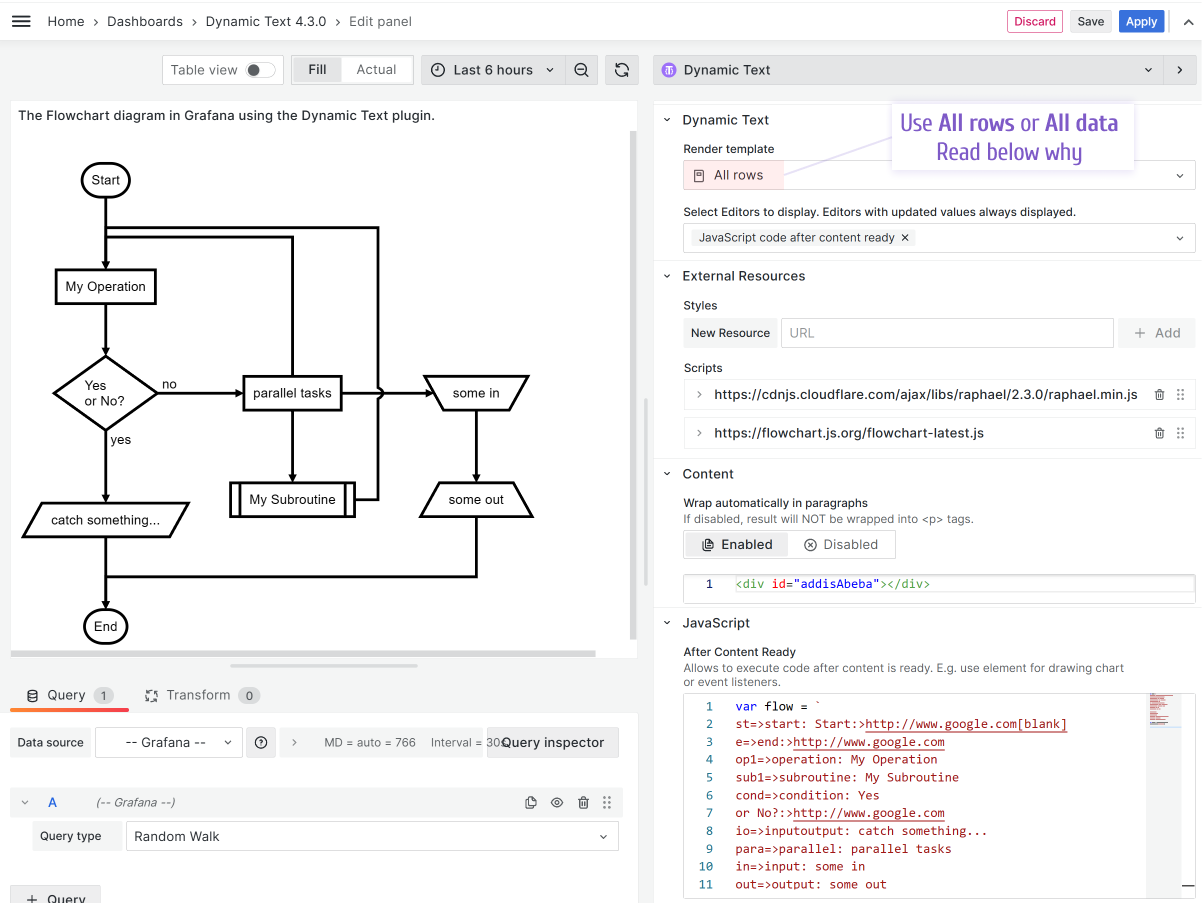
External Resources
https://flowchart.js.org/flowchart-latest.js
https://cdnjs.cloudflare.com/ajax/libs/raphael/2.3.0/raphael.min.js
Content
<div id="addisAbeba"></div>
JavaScript code
var flow = `
st=>start: Start:>http://www.google.com[blank]
e=>end:>http://www.google.com
op1=>operation: My Operation
sub1=>subroutine: My Subroutine
cond=>condition: Yes
or No?:>http://www.google.com
io=>inputoutput: catch something...
para=>parallel: parallel tasks
in=>input: some in
out=>output: some out

st->op1->cond
cond(yes)->io->e
cond(no)->para
para(path1, bottom)->sub1(right)->op1
para(path2, top)->op1
para(path3, right)->in->out->e`

var diagram = flowchart.parse(flow);
diagram.drawSVG('addisAbeba');
Use All rows or All data template to execute template only once. With Every row, the Content will be applied to every row of retrieved data. Even though the data frames of the specified data source are not used, still the plugin runs the code as many times as the number of rows is retrieved.
Table styling
Here I have a simple, yet amazing styling approach. For instance, you can display the status of your devices/servers as green or red dots in a table.
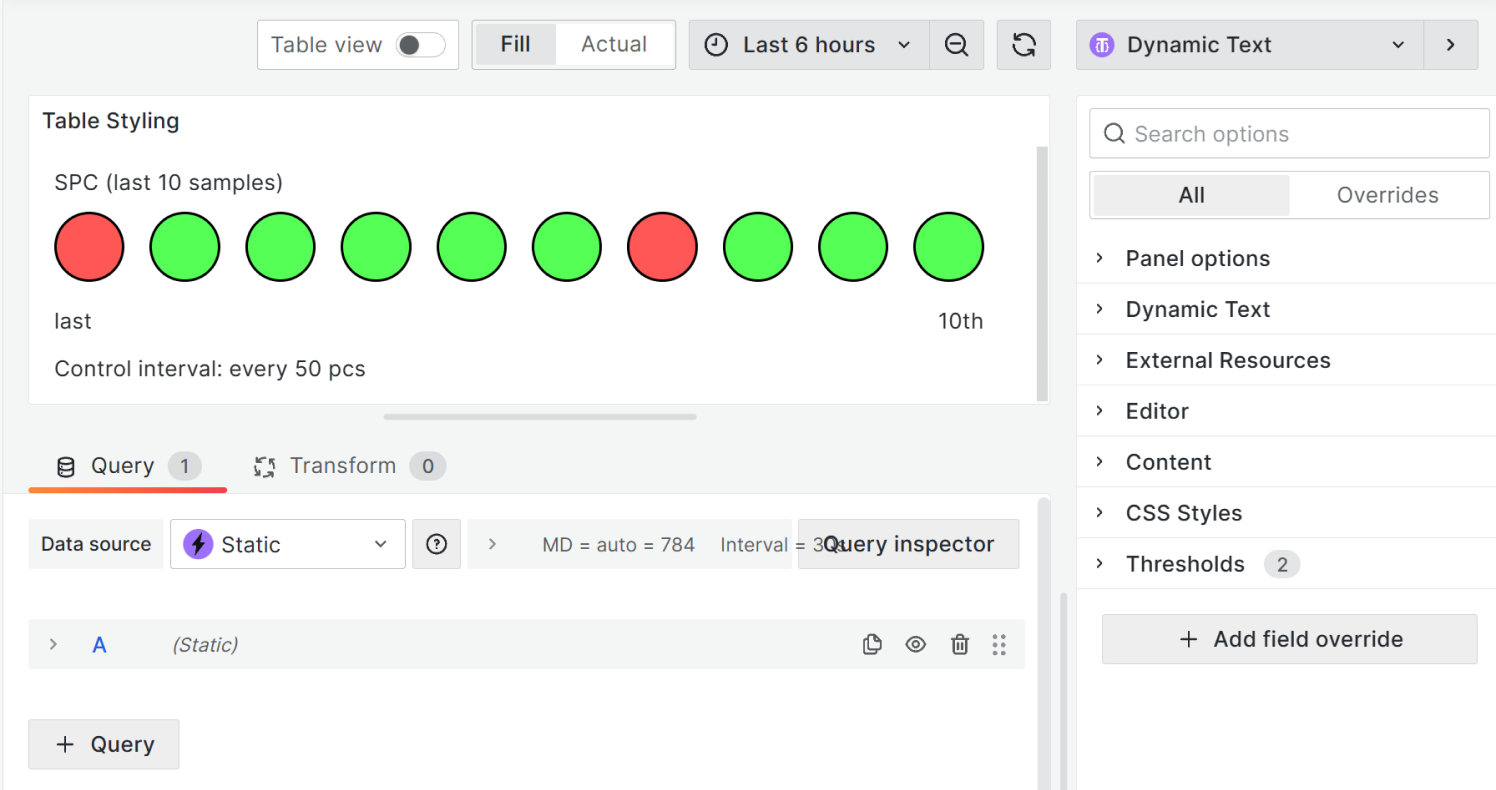
To have this on your dashboard, copy the Content and CSS Styles parameters from below.
Content
<table>
  <tbody>
    <tr>
      <td style="width: 10%;" colspan="10" class="header">
        SPC (last 10 samples)
      </td>
    </tr>
    <tr>
      <td style="width: 10%;"><span class="dot_niO"></span></td>
      <td style="width: 10%;"><span class="dot_iO"></span></td>
      <td style="width: 10%;"><span class="dot_iO"></span></td>
      <td style="width: 10%;"><span class="dot_iO"></span></td>
      <td style="width: 10%;"><span class="dot_iO"></span></td>
      <td style="width: 10%;"><span class="dot_iO"></span></td>
      <td style="width: 10%;"><span class="dot_niO"></span></td>
      <td style="width: 10%;"><span class="dot_iO"></span></td>
      <td style="width: 10%;"><span class="dot_iO"></span></td>
      <td style="width: 10%;"><span class="dot_iO"></span></td>
    </tr>
    <tr>
      <td style="text-align: left;" colspan="5">last</td>
      <td style="text-align: right;" colspan="5">10th</td>
    </tr>
    <tr>
      <td style="width: 10%;" colspan="5" class="down">
        Control interval: every 50 pcs
      </td>
      <td style="text-align: right;" colspan="5"></td>
    </tr>
  </tbody>
</table>
CSS Styles
.dot_iO {
  height: 45px;
  width: 45px;
  background-color: #56ff56;
  border-radius: 50%;
  border: 2px solid black;
  display: inline-block;
}

.dot_niO {
  height: 45px;
  width: 45px;
  background-color: #ff5656;
  border-radius: 50%;
  border: 2px solid black;
  display: inline-block;
}

table {
  border-style: unset !important;
}

tr td {
  border-style: unset !important;
}
JSON parsing
The community member havedill asked how to parse a JSON data format in the case when the transformation Convert field type is not available.
We believe the solution might be helpful for many, so here is how you can do it.
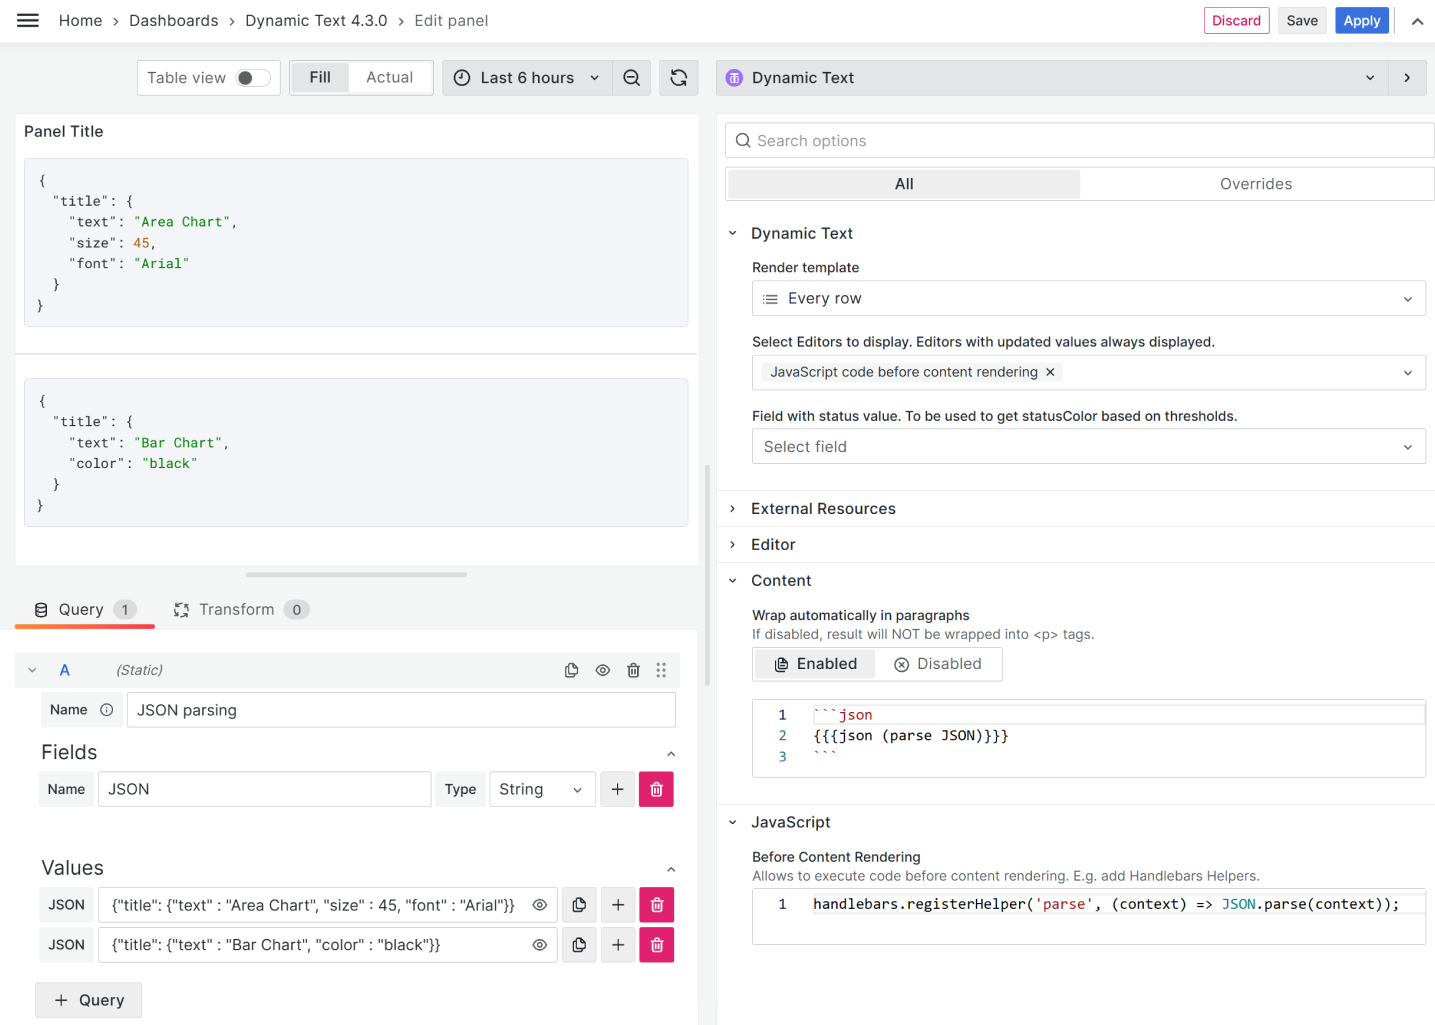
JSON example
{ "title": { "text": "Area Chart", "size": 45, "font": "Arial" } }
{ "title": { "text": "Bar Chart", "color": "black" } }
Content
{{{json (parse JSON)}}}
JavaScript
handlebars.registerHelper("parse", (context) => JSON.parse(context));
Getting Started
You can install the Business Text panel from the Grafana Plugins catalog or using the Grafana command line tool.
For the latter, please use the following command:
grafana cli plugins install marcusolsson-dynamictext-panel
Tutorial
The video reviews the major latest release including the data flow, predefined helpers and numerous examples of the external JavaScript libraries.
We have many other tutorials that you can find helpful. You can review all related to this plugin tutorials here.
Release Notes
Features / Enhancements
- Update ESLint configuration and refactor (#239)
- Update Collapse from @volkovlabs/components (#239)
- Update Introduction video in README (#240)
- Add data render mode and passing selected data frame (#246)
- Update to Grafana 10.2.2 and Volkov labs packages (#247)
- Add variableValue helper (#252)
- Add re-render on dashboard refresh (#252)
Bug fixes
- Fix draggable icon in Grafana 10.3 (#249)
We're Always Happy to Hear From You!
We value your feedback and are eager to connect with our community and partners. Whether you have a question, an idea, or an issue to report, here’s how you can reach out:
- Community Members: Have a question, want to suggest a new feature, or found a bug? We’d love to hear from you! Please create a GitHub issue to start the conversation.
- Enterprise Partners: Need assistance or have an urgent request? Open a Zendesk ticket for a prompt and dedicated response from our team.
- Join the Conversation: Stay updated and share your thoughts! Subscribe to our YouTube Channel and leave your comments—we can’t wait to hear what you think.
Your input helps us improve, so don’t hesitate to get in touch!