Using Query and Data Sources in the Data Manipulation plugin for Grafana


In recent months, the Data Manipulation panel plugin has received a lot of attention from the community. With over 500 daily downloads, we were swamped with requests and great enhancement ideas for quite some time.
Many thanks to everyone who took part in the creative thinking feast!
We knew the functionality provided by this plugin had been long awaited, but we did not expect such an outpouring of interest.
Grafana is well-known for its unrivaled data visualization capabilities. The Data Manipulation panel plugin is praised for adding data manipulation capability to Grafana's expansive visualization toolset.
In other words, Data Manipulation panel transforms a one-way data street into a two-way data street, allowing users to add and modify data in the database.
The REST API is the first method the Data Manipulation panel plugin started with. Now, in addition to the REST API, you can use queries and data sources. We also have a fully custom method available for use cases dealing with the most unusual requirements.
The query utilizes the standard Grafana data retrieval functionality, which limits this method to exist only in the initial request data flow.
The final product
This article describes the steps to complete a basic Grafana project where the central requirement is the user's ability to update a device setting stored in an external database.
Below, you can see a Grafana dashboard with the Data Manipulation panel plugin. It provides two similar examples with the difference in the initial request type. In the first example, I use the query and in the other, I use the data source with the initial request type.
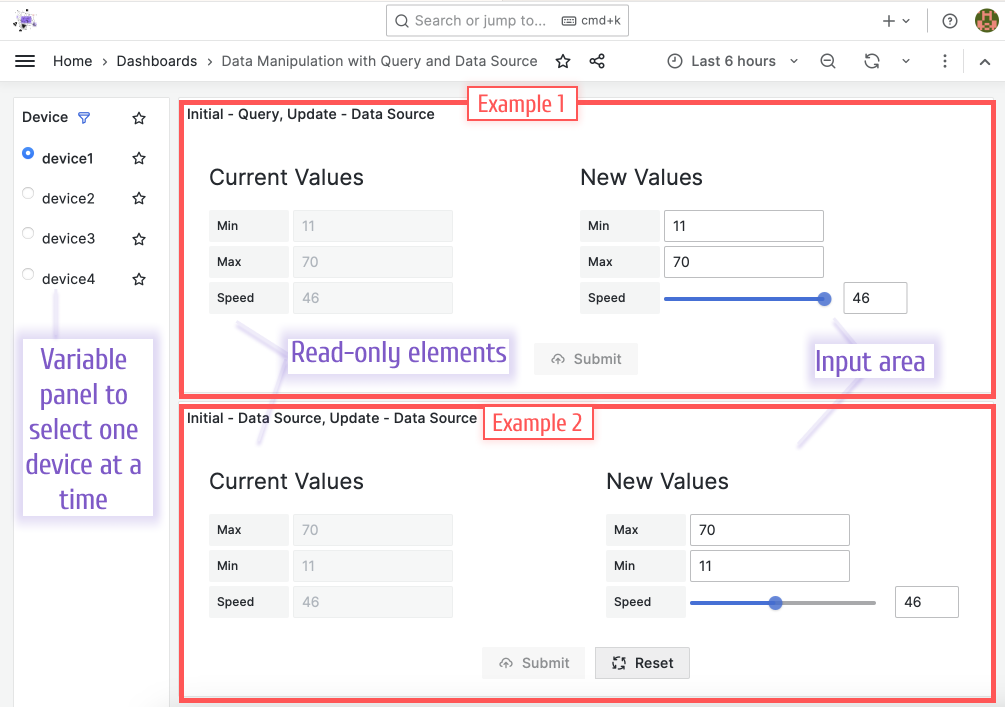
For switching between devices, I choose to use the Business Variable panel. It is optional for data manipulation, but I needed a filter located on the side of the users' forms, so that's what I went with.
Database
PostgreSQL is our go-to database for most dummy and production projects, including this one. The following table demonstrates the basic data structure for Data Manipulation panel.
The name column captures the device name, and the remaining columns are for corresponding device metrics.
CREATE TABLE configuration (
    name text,
    max integer not null,
    min integer not null,
    speed integer not null
);

insert into configuration values ('device1', 100, 10, 54);
insert into configuration values ('device2', 60, 0, 10);
insert into configuration values ('device3', 60, 30, 40);
insert into configuration values ('device4', 34, 10, 20);
Initial Request
In the initial request, you can choose among the following:
- Custom[-]
- Data Source
- Query
- REST API (GET)
Query
For the first example, I used the query type. This method relates to Grafana's standard fetching mechanism. That implies you must have a Grafana data source configured and choose it from the drop-down box on the left. All Grafana data sources are supported by Data Manipulation panel.
The following step is to define a query. In my example, I get min, max, and speed metrics from a configuration table for all devices using a simple SQL expression.
Then, I created three read-only form elements. Every element is mapped to the corresponding field from the query.
When the Highlight Changes feature is enabled, the updated values are highlighted with a specific color.
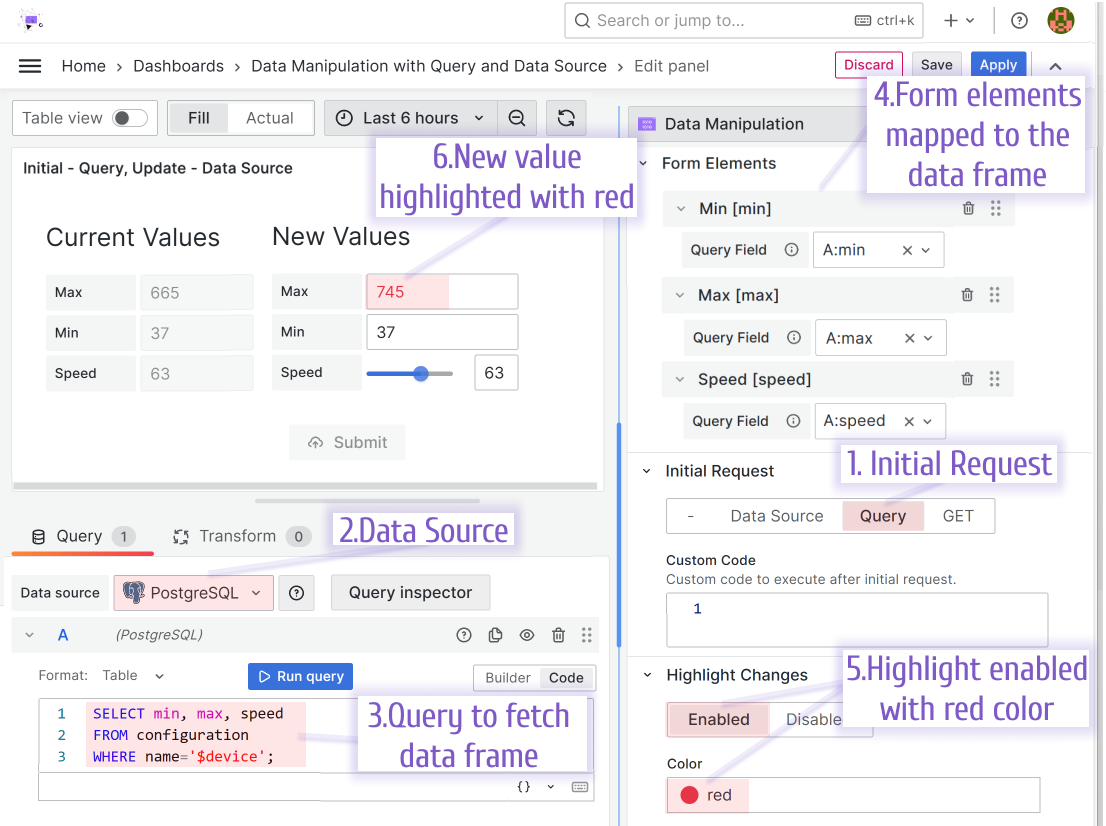
The SQL query from the screenshot above:
SELECT min, max, speed
FROM configuration
WHERE name = '$device';
Query is only available as an initial request type, not as an update request type. This solution relied on Grafana's standard retrieval mechanism, which is one-way at its core and hence limited to the initial request.
Data Source
When you select a data source as your initial request type, the standard query settings on the left become irrelevant.
On the right, I specified PostgreSQL as a data source and the SQL query in the Create Payload box within the Initial Request Payload category.
To use the highlighting of changes for the data source type, you need to execute the SetInitial() function in the post-process stage. In the screenshot below, I provide an example of such code with the SetInitial() function.
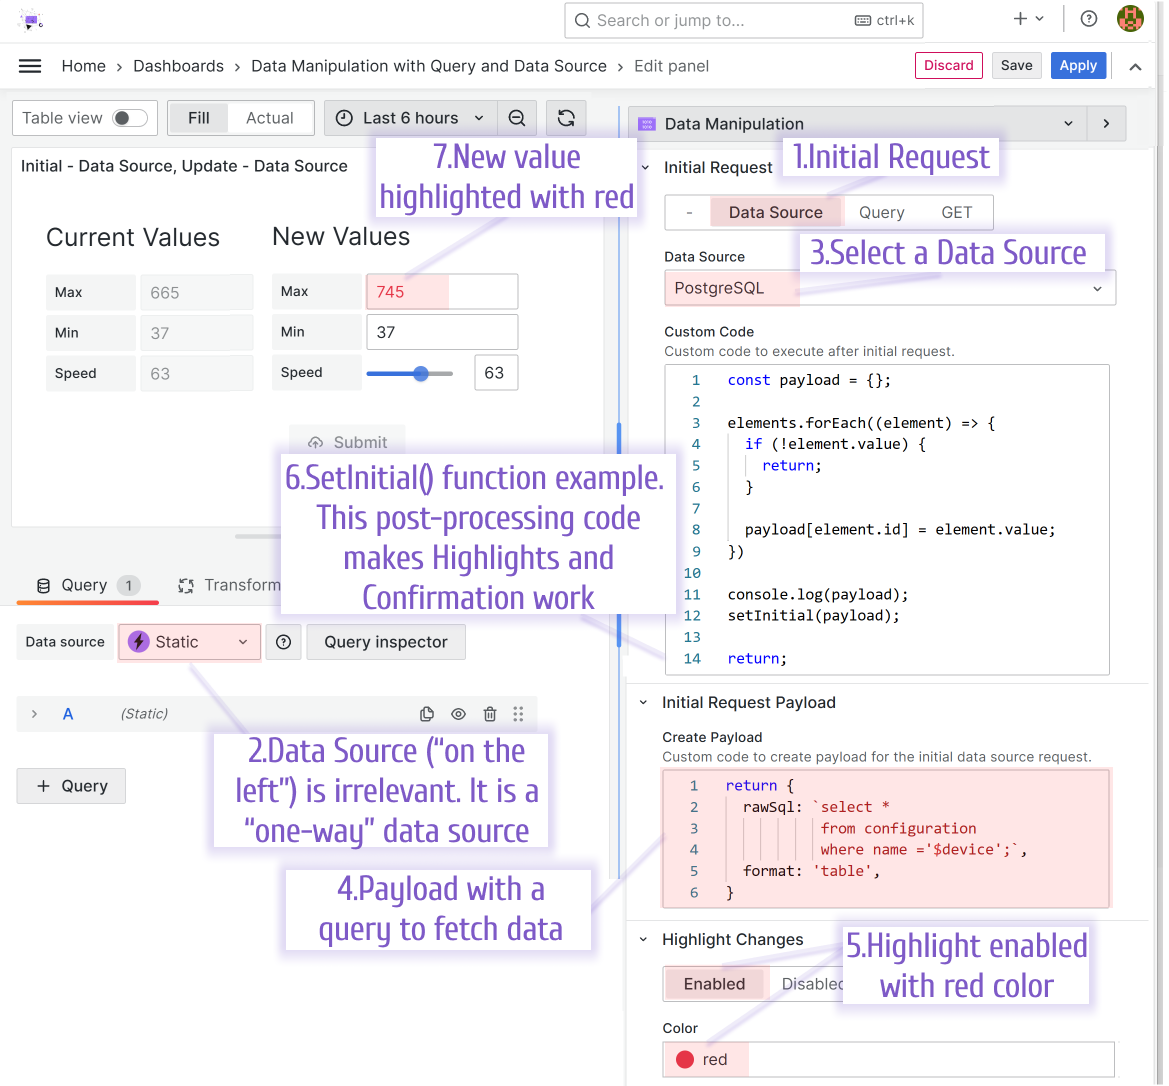
Initial Request payload
Dashboard variables will be replaced automatically. The payload data should be inserted with string interpolation.
return {
  rawSql: "select * from configuration where name ='$device';",
  format: "table",
};
Initial Request Custom Code
const payload = {};

elements.forEach((element) => {
  if (!element.value) {
    return;
  }

  payload[element.id] = element.value;
});

setInitial(payload);
Update Request
In my example, I decided to have an identical update request for both examples. My configuration is in the screenshot below.
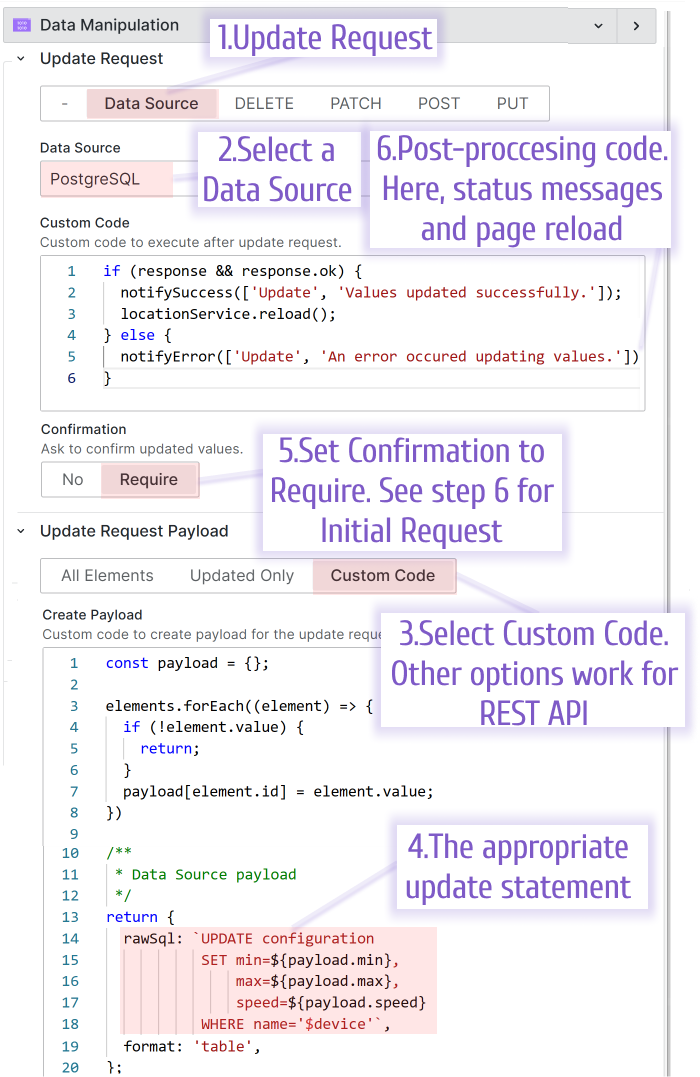
Update Request Payload
const payload = {};

elements.forEach((element) => {
  if (!element.value) {
    return;
  }

  payload[element.id] = element.value;
});

/**
 * Data Source payload.
 * Dashboard variables will be replaced automatically.
 * The payload data should be inserted with string interpolation.
 */
return {
  rawSql: `update configuration set min=${payload.min}, max=${payload.max}, speed=${payload.speed} where name='$device'`,
  format: "table",
};
Update Request Custom Code
if (response && response.ok) {
  notifySuccess(["Update", "Values updated successfully."]);
  initialRequest();
} else {
  notifyError(["Update", "An error occurred updating values."]);
}
Tutorial
In this video, I reviewed all the new features of Data Manipulation panel for Grafana.
We're Always Happy to Hear From You!
We value your feedback and are eager to connect with our community and partners. Whether you have a question, an idea, or an issue to report, here’s how you can reach out:
- Community Members: Have a question, want to suggest a new feature, or found a bug? We’d love to hear from you! Please create a GitHub issue to start the conversation.
- Enterprise Partners: Need assistance or have an urgent request? Open a Zendesk ticket for a prompt and dedicated response from our team.
- Join the Conversation: Stay updated and share your thoughts! Subscribe to our YouTube Channel and leave your comments—we can’t wait to hear what you think.
Your input helps us improve, so don’t hesitate to get in touch!