Grafana 101 - What, Why, Who?

The Grafana community is constantly growing, and we are happy to welcome new professionals onboard this flexible and powerful tool. Grafana has been of interest to deep technology experts in the recent past. Although, lately, more and more people from different backgrounds and skill sets are turning heads toward it.
This article answers basic questions about Grafana and is designed to be the first step in your from zero to hero Grafana adventure. Let's discover together what made Grafana to be installed over 700.000 times across the world.
What is Grafana? After researching publications, and documentation, and picking the brains of the renowned Grafana experts, it turned out it was a million-dollar question. This tool has so many facets that there is no one definite straightforward answer in the community. I took some liberty and came up with my definition and the basic explanations of Grafana architecture.
All key concepts to know
Grafana is open source software that allows you to combine many different data sources converting your data into graphical visualizations for observability. Observability is a new buzzword that means visualizations to help with answering ambiguously defined questions, providing enough analysis to make critical decisions quickly.
In its nutshell, Grafana consists of 3 logical components or layers
- Grafana Platform
- Data Source
- Visualization
Data Sources and Visualizations are also widely called plugins. You can have Data Sources and Visualizations forged together into one plugin. In that case, it is called an Application plugin.
Grafana Platform
The Grafana Platform takes care of user authentication, authorization, and deployment on various operations systems and provides you with a venue where any number of plugins can be installed, managed, and shared with users according to your security policies.
Data Source
Data Source allows the Grafana Platform to talk with your data storage. For example, the PostgreSQL plugin allows the Grafana Platform to retrieve data from the PostgreSQL database and send it to Visualization components.
Watch the video where I explain why PostgreSQL is the ultimate storage partner for Grafana.
Supported Data Sources can be categorized:
- Time-series: Prometheus, Graphite, OpenTSDB, InfluxDB
- Logging & Document: Loki, Elasticsearch
- Distributed Tracing: Jaeger, Zipkin, Tempo
- SQL: MySQL, PostgreSQL, Microsoft SQL Server
- Cloud: AWS CloudWatch, Azure Monitor, Google Cloud Monitoring
Visualizations
Visualizations convert retrieved data frames into dynamic graphical representations such as histograms, geo maps, bars, and candlestick charts, to name a few.
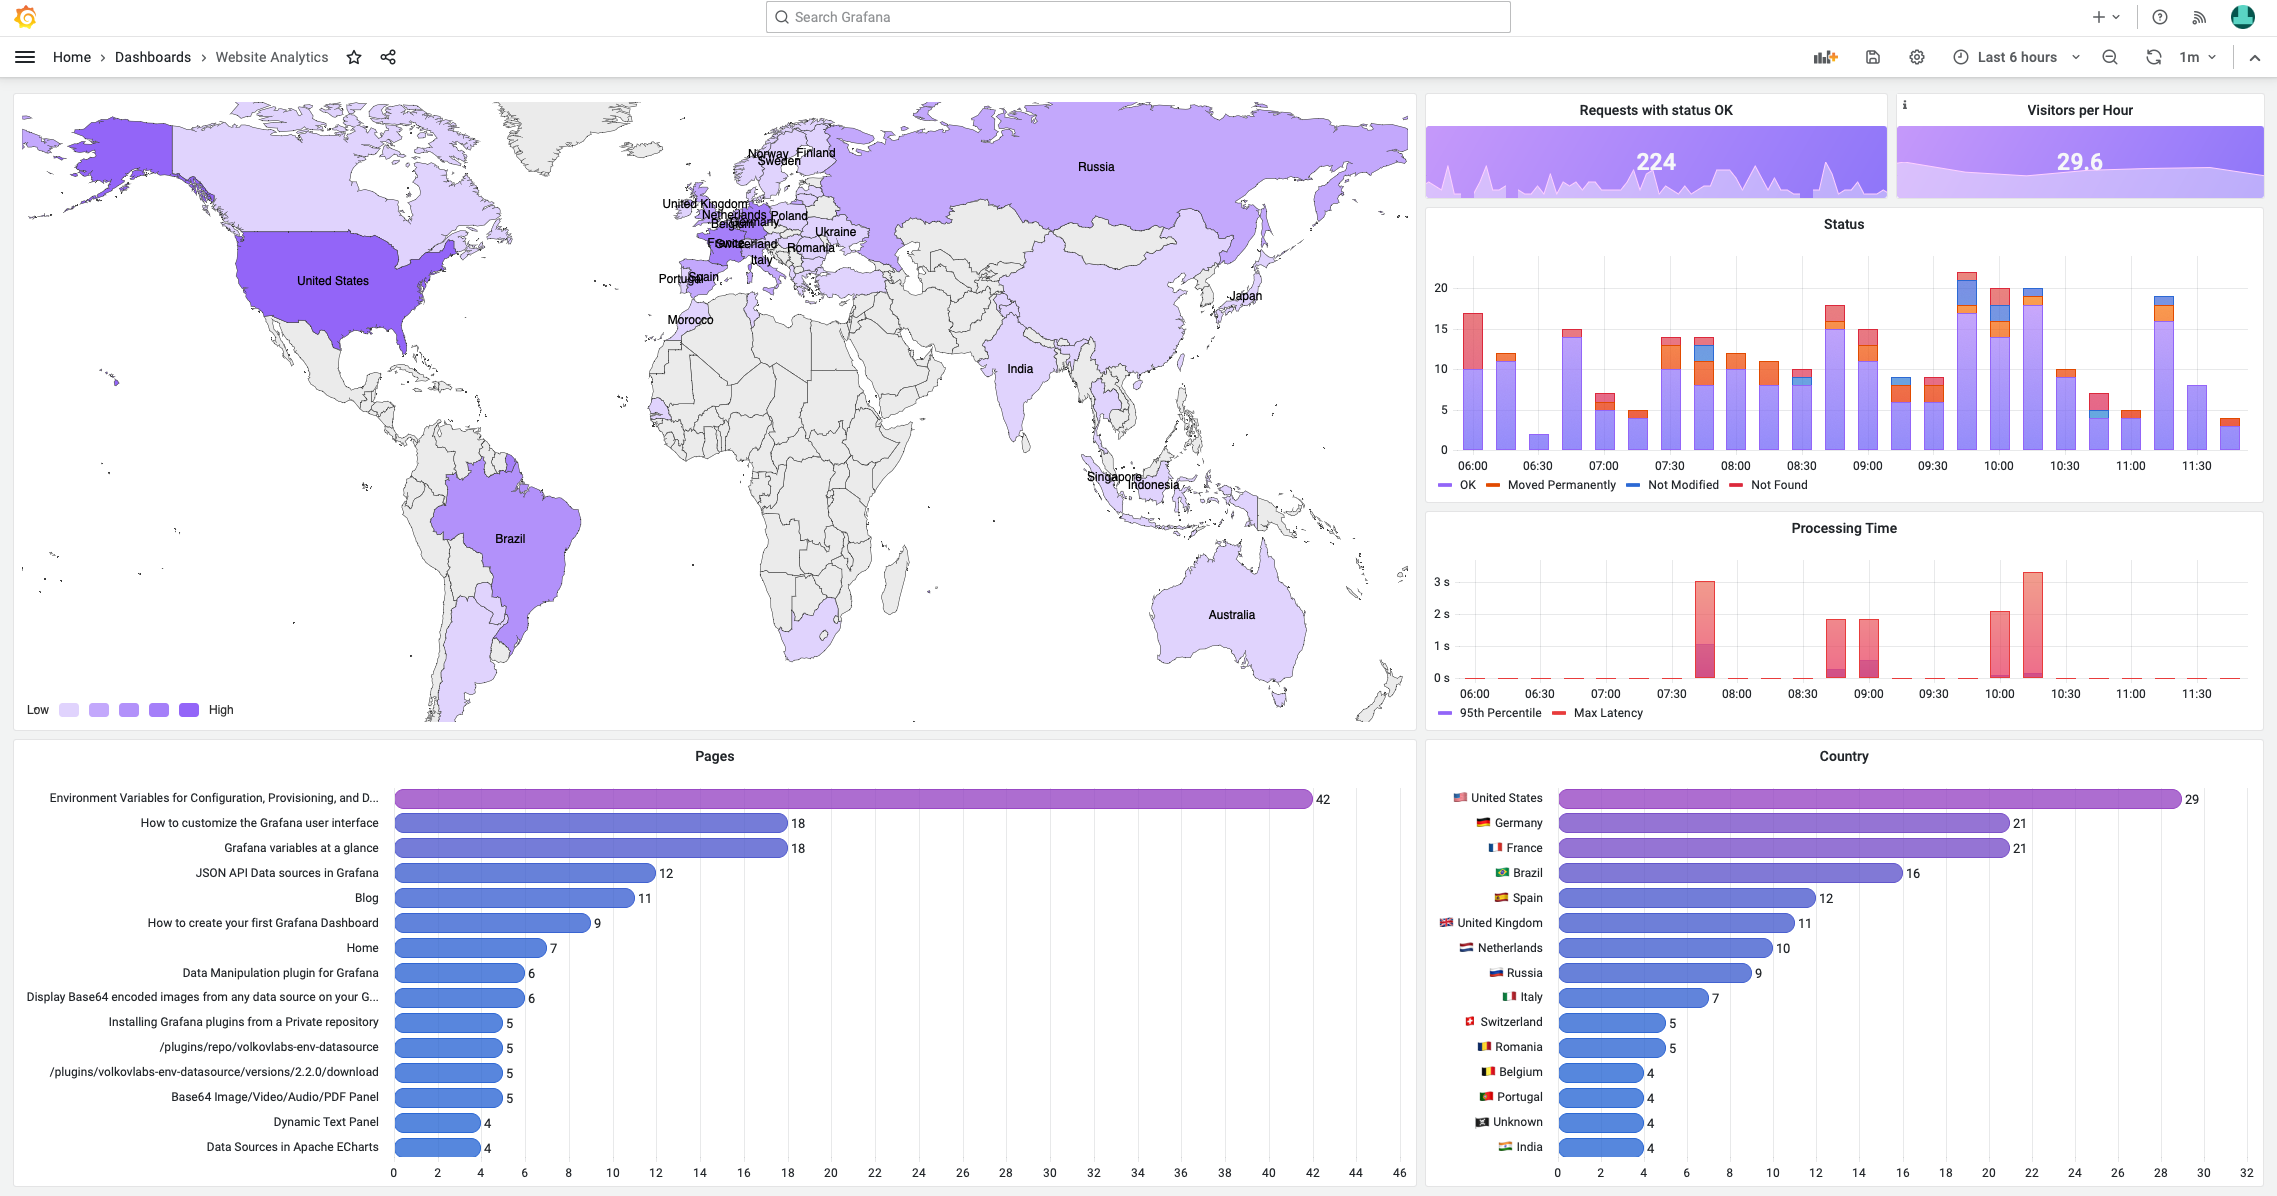
Two more key Grafana concepts are panels and dashboards. To me, they are the easiest of all. A Grafana panel is a working visualization connected to your data source. A Grafana Dashboard is a combination of panels.
Plugins Dashboard
Enthusiasts of the Grafana Community create new Data Sources and Visualizations every day. We at Volkov Labs created an information dashboard with the number of downloads for all Grafana plugins.
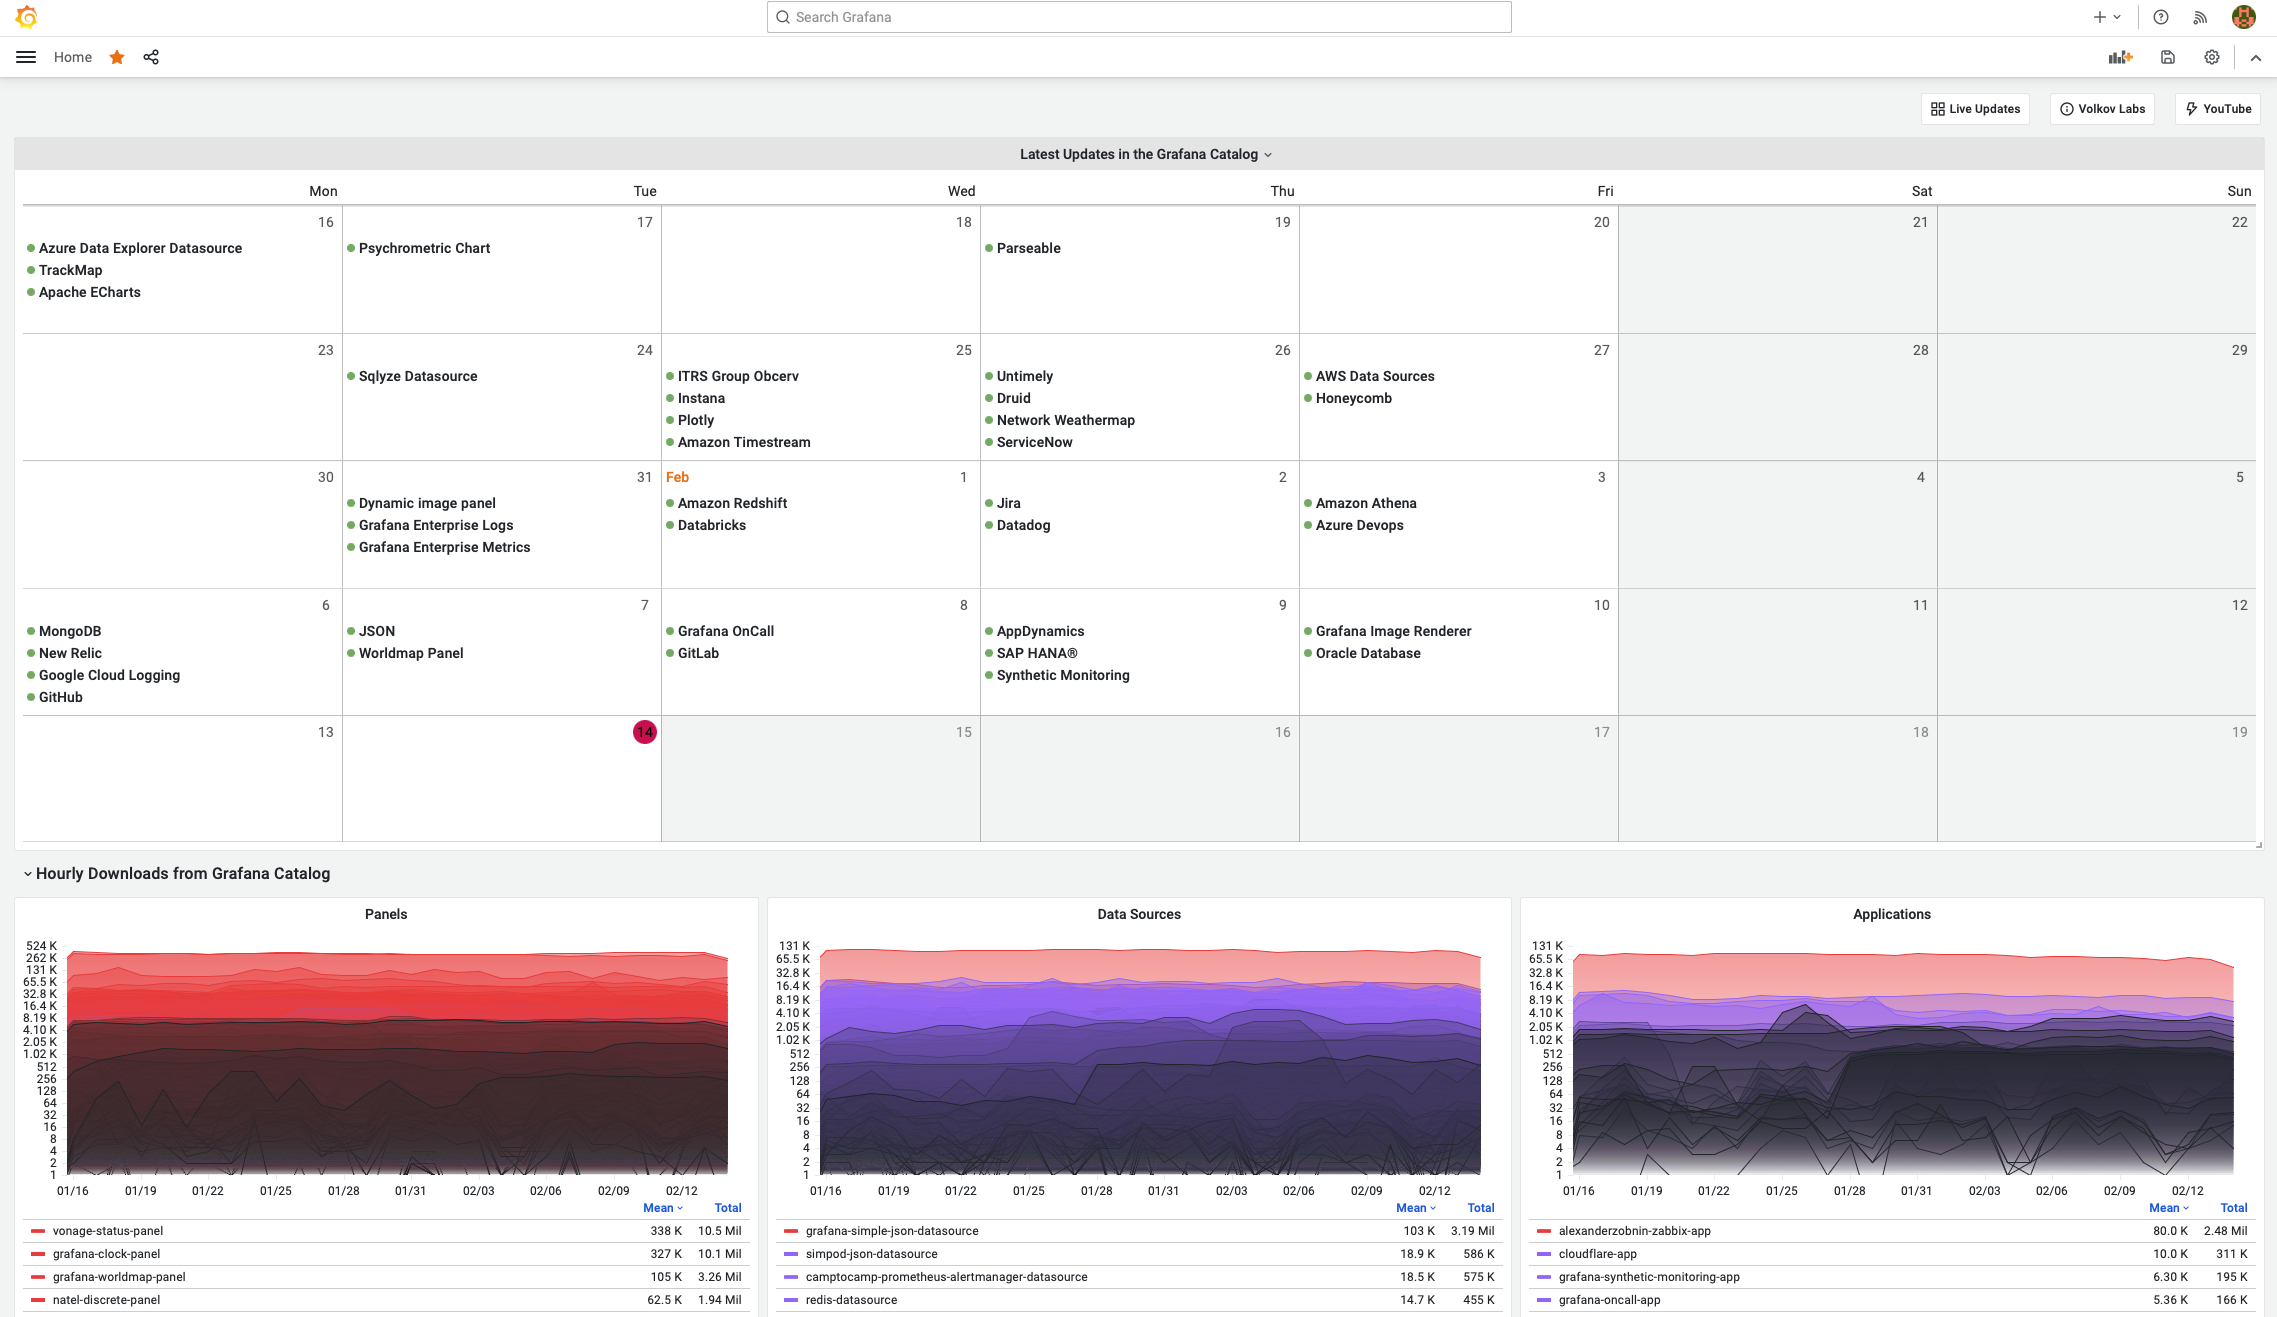
It is a one-stop listing to simplify your Grafana plugin search. Such a simple solution made a big difference, especially given that there are no equivalents out there.
You can download any plugin as a code from GitHub or install it from the Grafana Catalog and easily mount it on top of the preinstalled Grafana. All plugins have been verified and went through rigorous peer review. This dashboard updates in real time.
How to get started with Grafana
If we sum up all key concepts in one workflow, here is what we get. You install the Grafana Platform and add the Grafana plugins for your data storage if it is not yet installed by default.
Next, you create a dashboard, add a panel, connect it to the Data Source, choose a Visualization, configure it by composing your queries, adjust visuals (colors, sizes, title, etc.), save it and share the link with your peers. Boom! You can get as creative as humanely possible. This is the outstanding beauty of Grafana.
Quick facts to complete the picture
- Super light-weighted software.
- Presently, Grafana is primarily a read-only tool. Yet, that might change in the future. Check out the Business Forms panel.
- The visualizations could be refreshed as often as every 100 milliseconds. That, in particular, makes Grafana the ideal tool for monitoring any processes in real time.
- Grafana does not store any data. Instead, it provides a secure path from your database and data storage to the visualization directly.
- Grafana allows the dashboard creators to utilize the languages they are already familiar with. The queries that are used by the Grafana dashboards are transmitted to the databases in their native semantics.
Grafana Use Cases
Grafana dashboards could be placed:
- Locally. For instance, that could be a screen attached to a wall in the office or laboratory.
- In Intranet. For internal use of the company's employees to display important KPIs like performance metrics, the progress of the current sprint, and real-time sales volumes for the just-launched merchandise.
- On the Internet. To provide analytical services to the company's clients or share real-time analytics with fellow researchers in scientific communities.
Let’s Stay Connected!
Join the Conversation: Stay updated and share your thoughts! Subscribe to our YouTube Channel and leave your comments—we can’t wait to hear what you think.
Your input helps us improve, so don’t hesitate to get in touch!