Monitoring Grafana OSS Metrics with Grafana Alloy and Automating Alerts in Business Intelligence Platform


In this tutorial, we’ll walk you through a comprehensive setup for monitoring Grafana Open Source Software (OSS) metrics using Grafana Alloy, forwarding them to Grafana Cloud, and creating actionable alerts within our Business Intelligence platform. Additionally, we’ll demonstrate how to automate incident creation in Grafana Incident using a Node-RED workflow.
This guide is based on a specific Grafana dashboard configuration available in the Business Intelligence GitHub repository. Whether you're managing a single Grafana instance or a distributed environment, this end-to-end solution will help you ensure operational efficiency and rapid incident response.
Overview of the Monitoring Workflow
Our objective is to establish a robust system for monitoring Grafana OSS metrics, enabling proactive incident management, and validating data through an external platform. Here’s the high-level workflow we’ll implement:
- Collect Metrics with Grafana Alloy: Scrape metrics from Grafana OSS using Grafana Alloy.
- Forward Metrics to Grafana Cloud: Configure Alloy to send metrics to Grafana Cloud for centralized storage and analysis.
- Visualize Metrics with a Custom Dashboard: Use a pre-configured dashboard to monitor Grafana key performance indicators.
- Create Alerts in a Business Intelligence Platform: Set up alert rules based on dashboard metrics to detect anomalies or threshold breaches.
- Automate Incident Creation with Node-RED: Implement a Node-RED workflow to automatically create incidents in Grafana Incident when alerts are triggered.
Let’s explore each step in detail to build this powerful monitoring solution.
Collecting Metrics with Grafana Alloy
Grafana Alloy is a versatile, vendor-agnostic telemetry collector designed to scrape metrics from various sources, including Grafana OSS. Follow these steps to set it up:
- Install Grafana Alloy: Refer to the official documentation to install Alloy on the server or environment hosting your Grafana OSS instance.
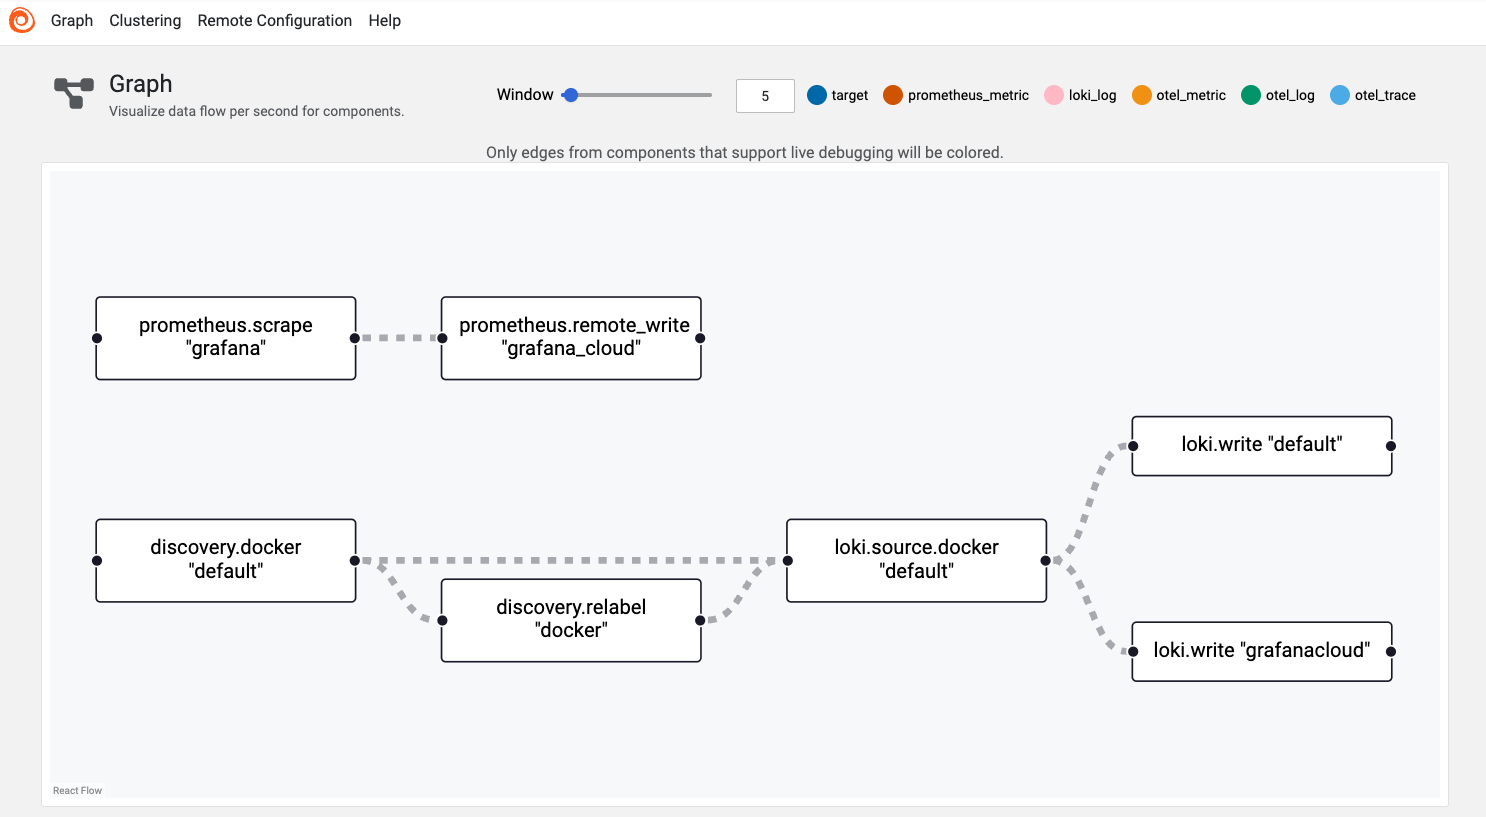
- Configure Alloy for Grafana OSS: Create a configuration file to scrape metrics from Grafana’s Prometheus endpoint (typically exposed on port 3000). Below is a sample configuration:
prometheus.scrape "grafana" {
  targets = [
    { __address__ = "grafana:3000" },
  ]
  scrape_interval = "15s"
  forward_to = [prometheus.remote_write.grafana_cloud.receiver]
}

prometheus.remote_write "grafana_cloud" {
  endpoint {
    url = "https://prometheus-prod-01-grafana-cloud.grafana.net/api/prom/push"
    basic_auth {
      username = "your_username"
      password = "your_api_key"
    }
  }
}
This configuration directs Alloy to collect metrics from Grafana every 15 seconds and forward them to Grafana Cloud.
- Run Grafana Alloy: Start the Alloy service with your configuration file as outlined in the Alloy setup guide.
Sending Metrics to Grafana Cloud
With Alloy configured, metrics are automatically forwarded to Grafana Cloud. Ensure you have a Grafana Cloud account and an API key for authentication, as specified in the prometheus.remote_write component of the Alloy configuration.
To verify that metrics are being received, navigate to the Prometheus data source in Grafana Cloud and query for Grafana-specific metrics, such as grafana_process_cpu_seconds_total.
Visualizing Metrics with a Custom Dashboard
We’ve developed a comprehensive dashboard for Grafana OSS metrics, available in the Business Intelligence repository. This dashboard features panels for:
- API, Web, and Proxy Requests: Tracks request rates across Grafana components.
- HTTP Requests: Monitors request rates by handler and instance.
- Dashboard Get/Search Latency: Measures response times for dashboard operations.
- CPU and Memory Usage: Displays resource consumption metrics.
- In-Flight HTTP Requests and Open File Descriptors: Provides insights into system load and resource utilization.
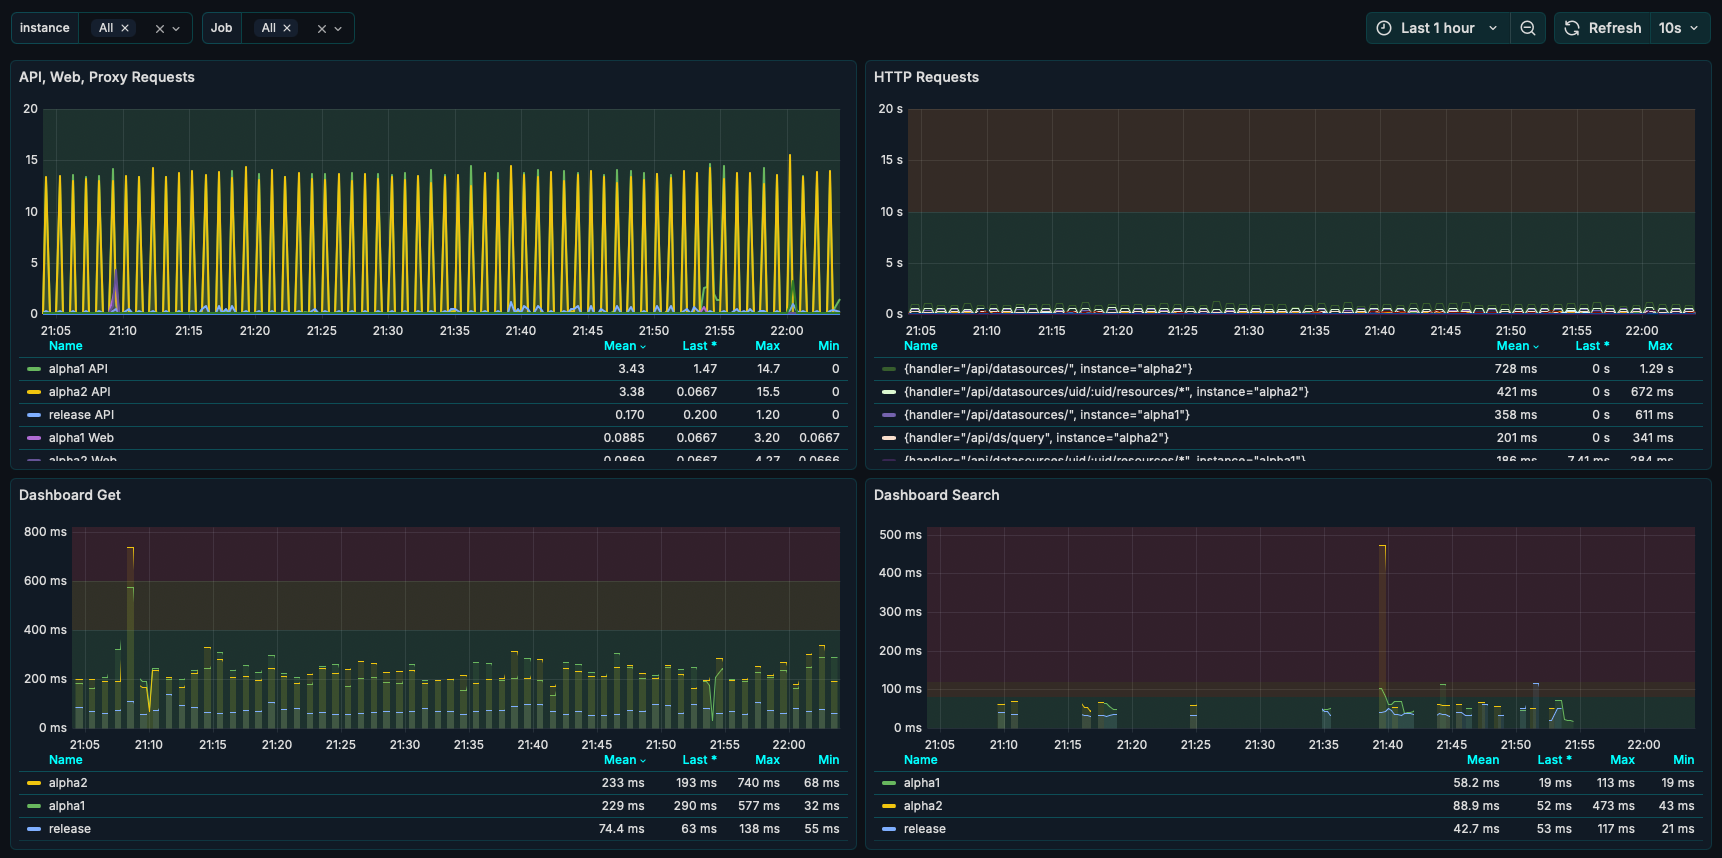
To implement this dashboard, import the JSON file into Grafana Cloud. It includes dynamic variables like instance and job for filtering, enabling effective monitoring across multiple Grafana instances.
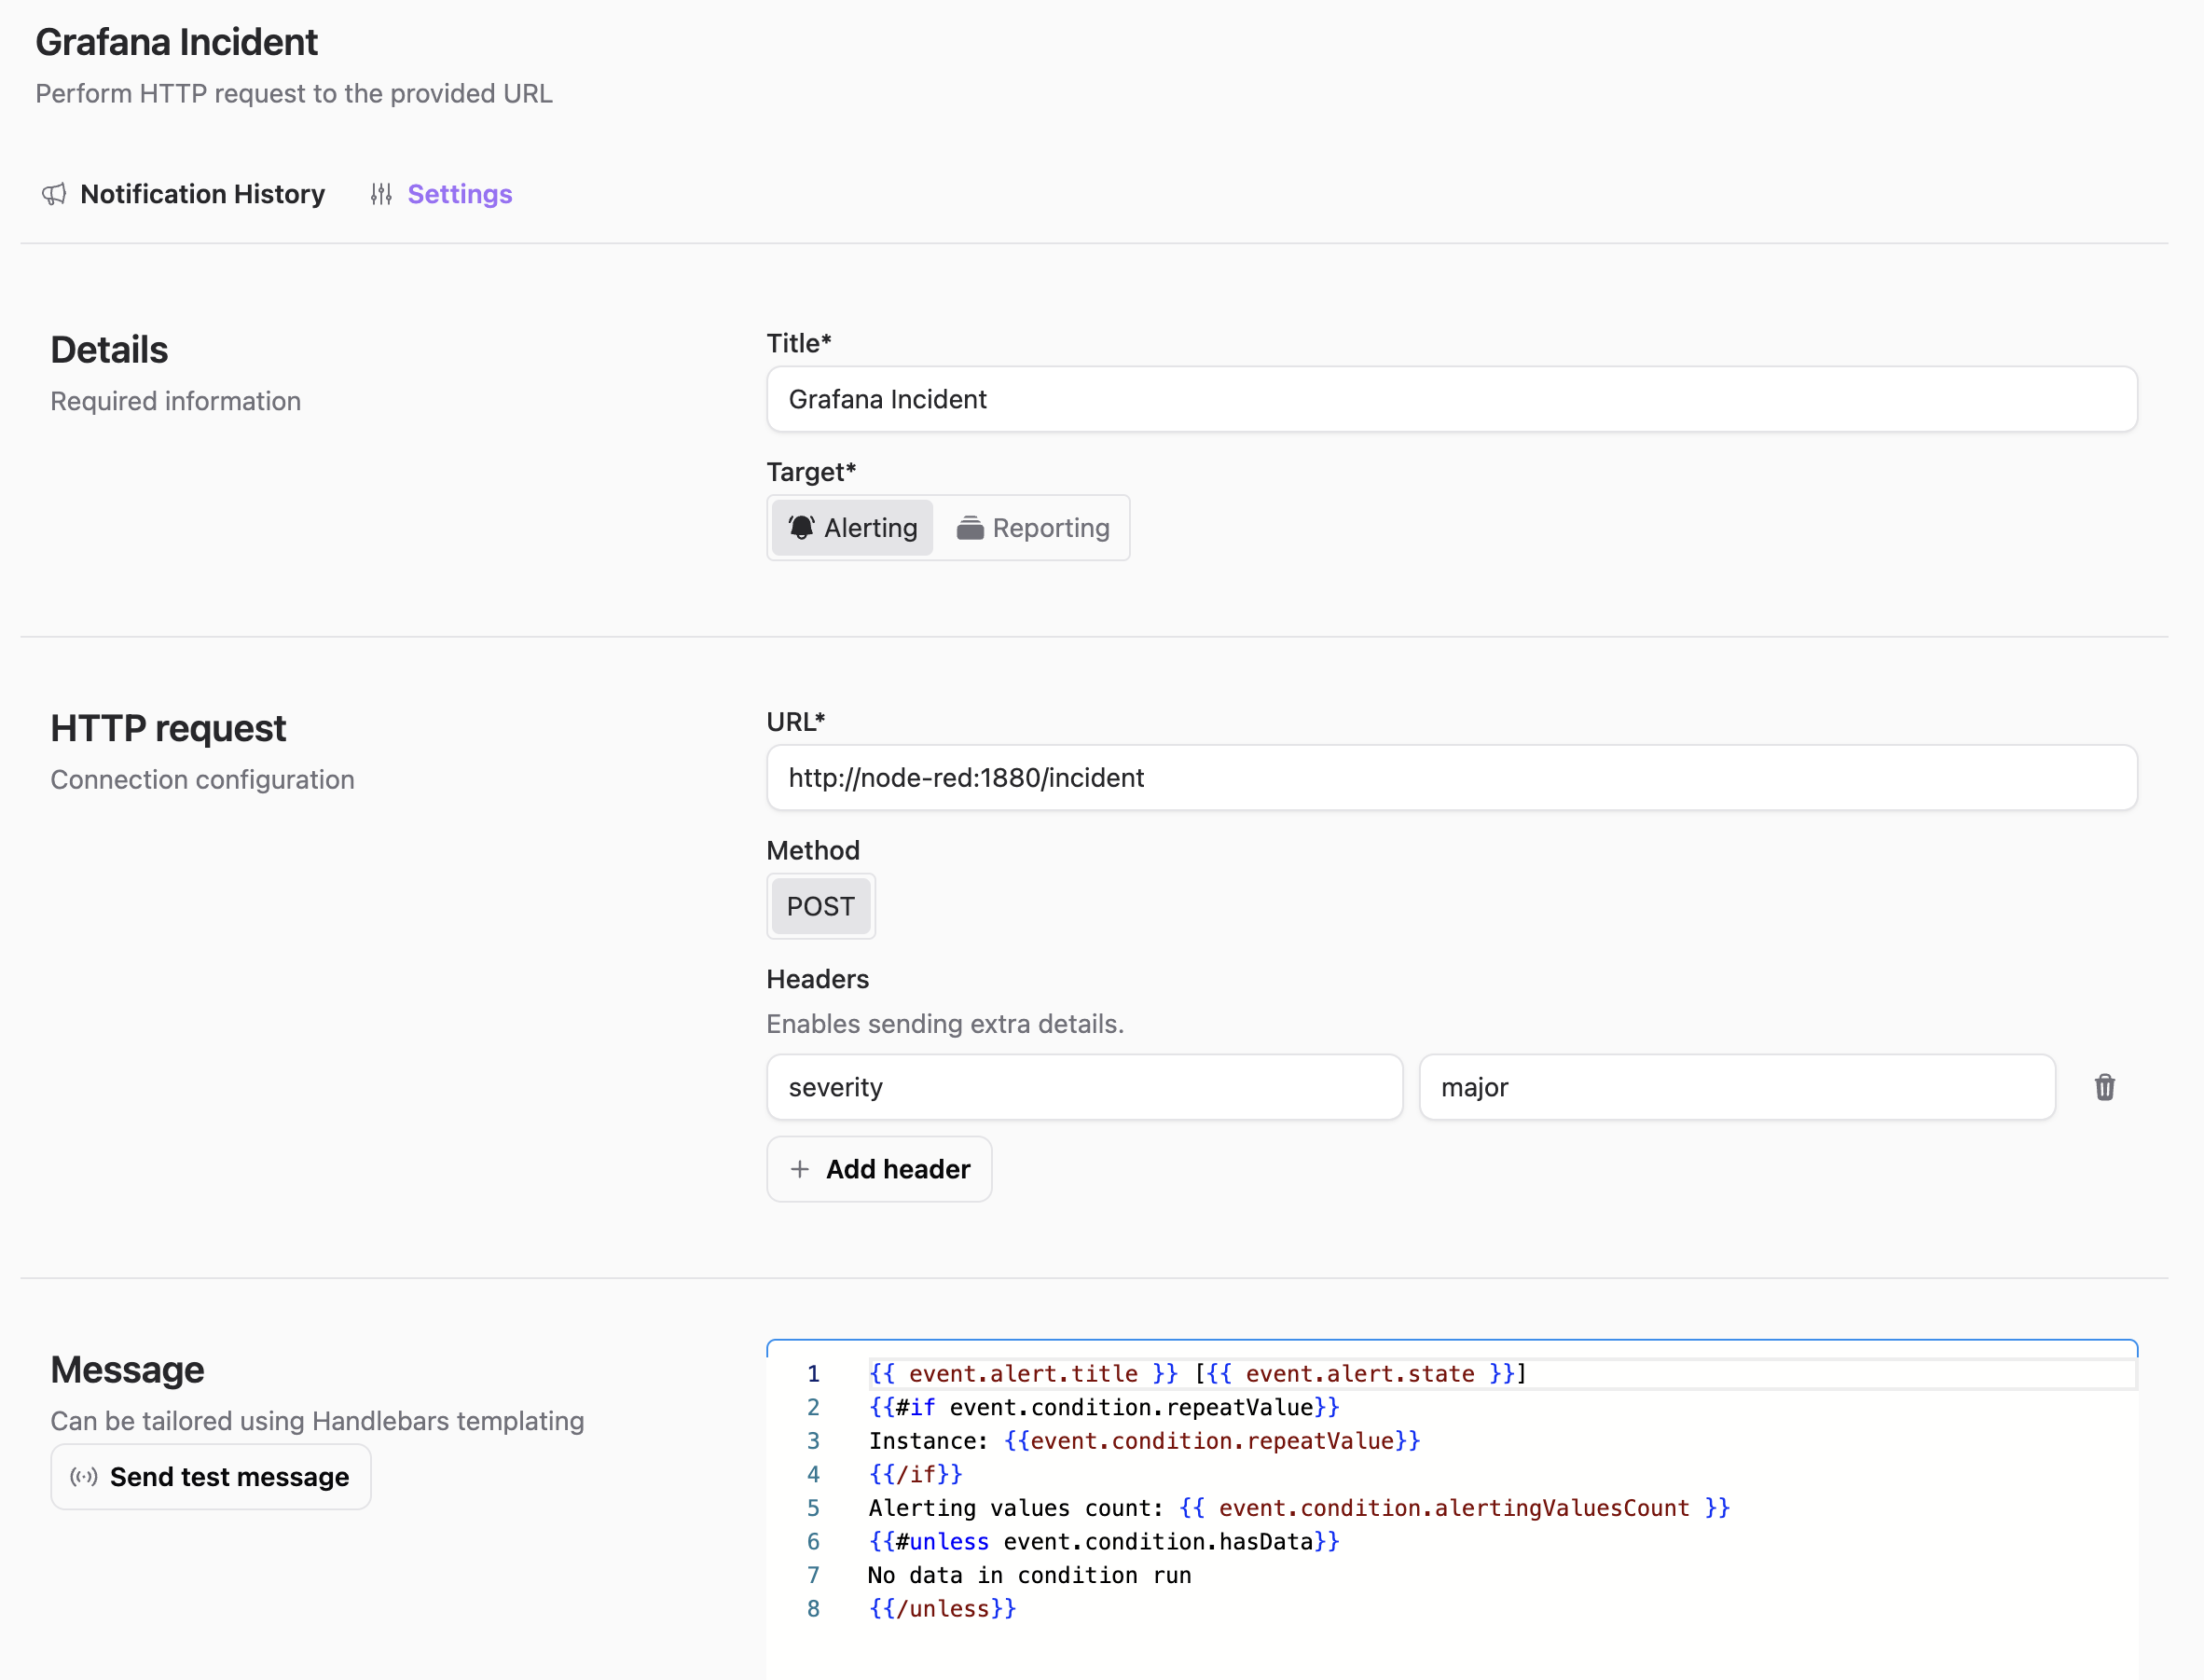
Setting Up Alerts in a Business Intelligence Platform
Our Business Intelligence platform integrates seamlessly with Grafana to provide advanced alerting capabilities. Using the metrics visualized in the dashboard, you can create alert rules to monitor critical thresholds. Here’s how:
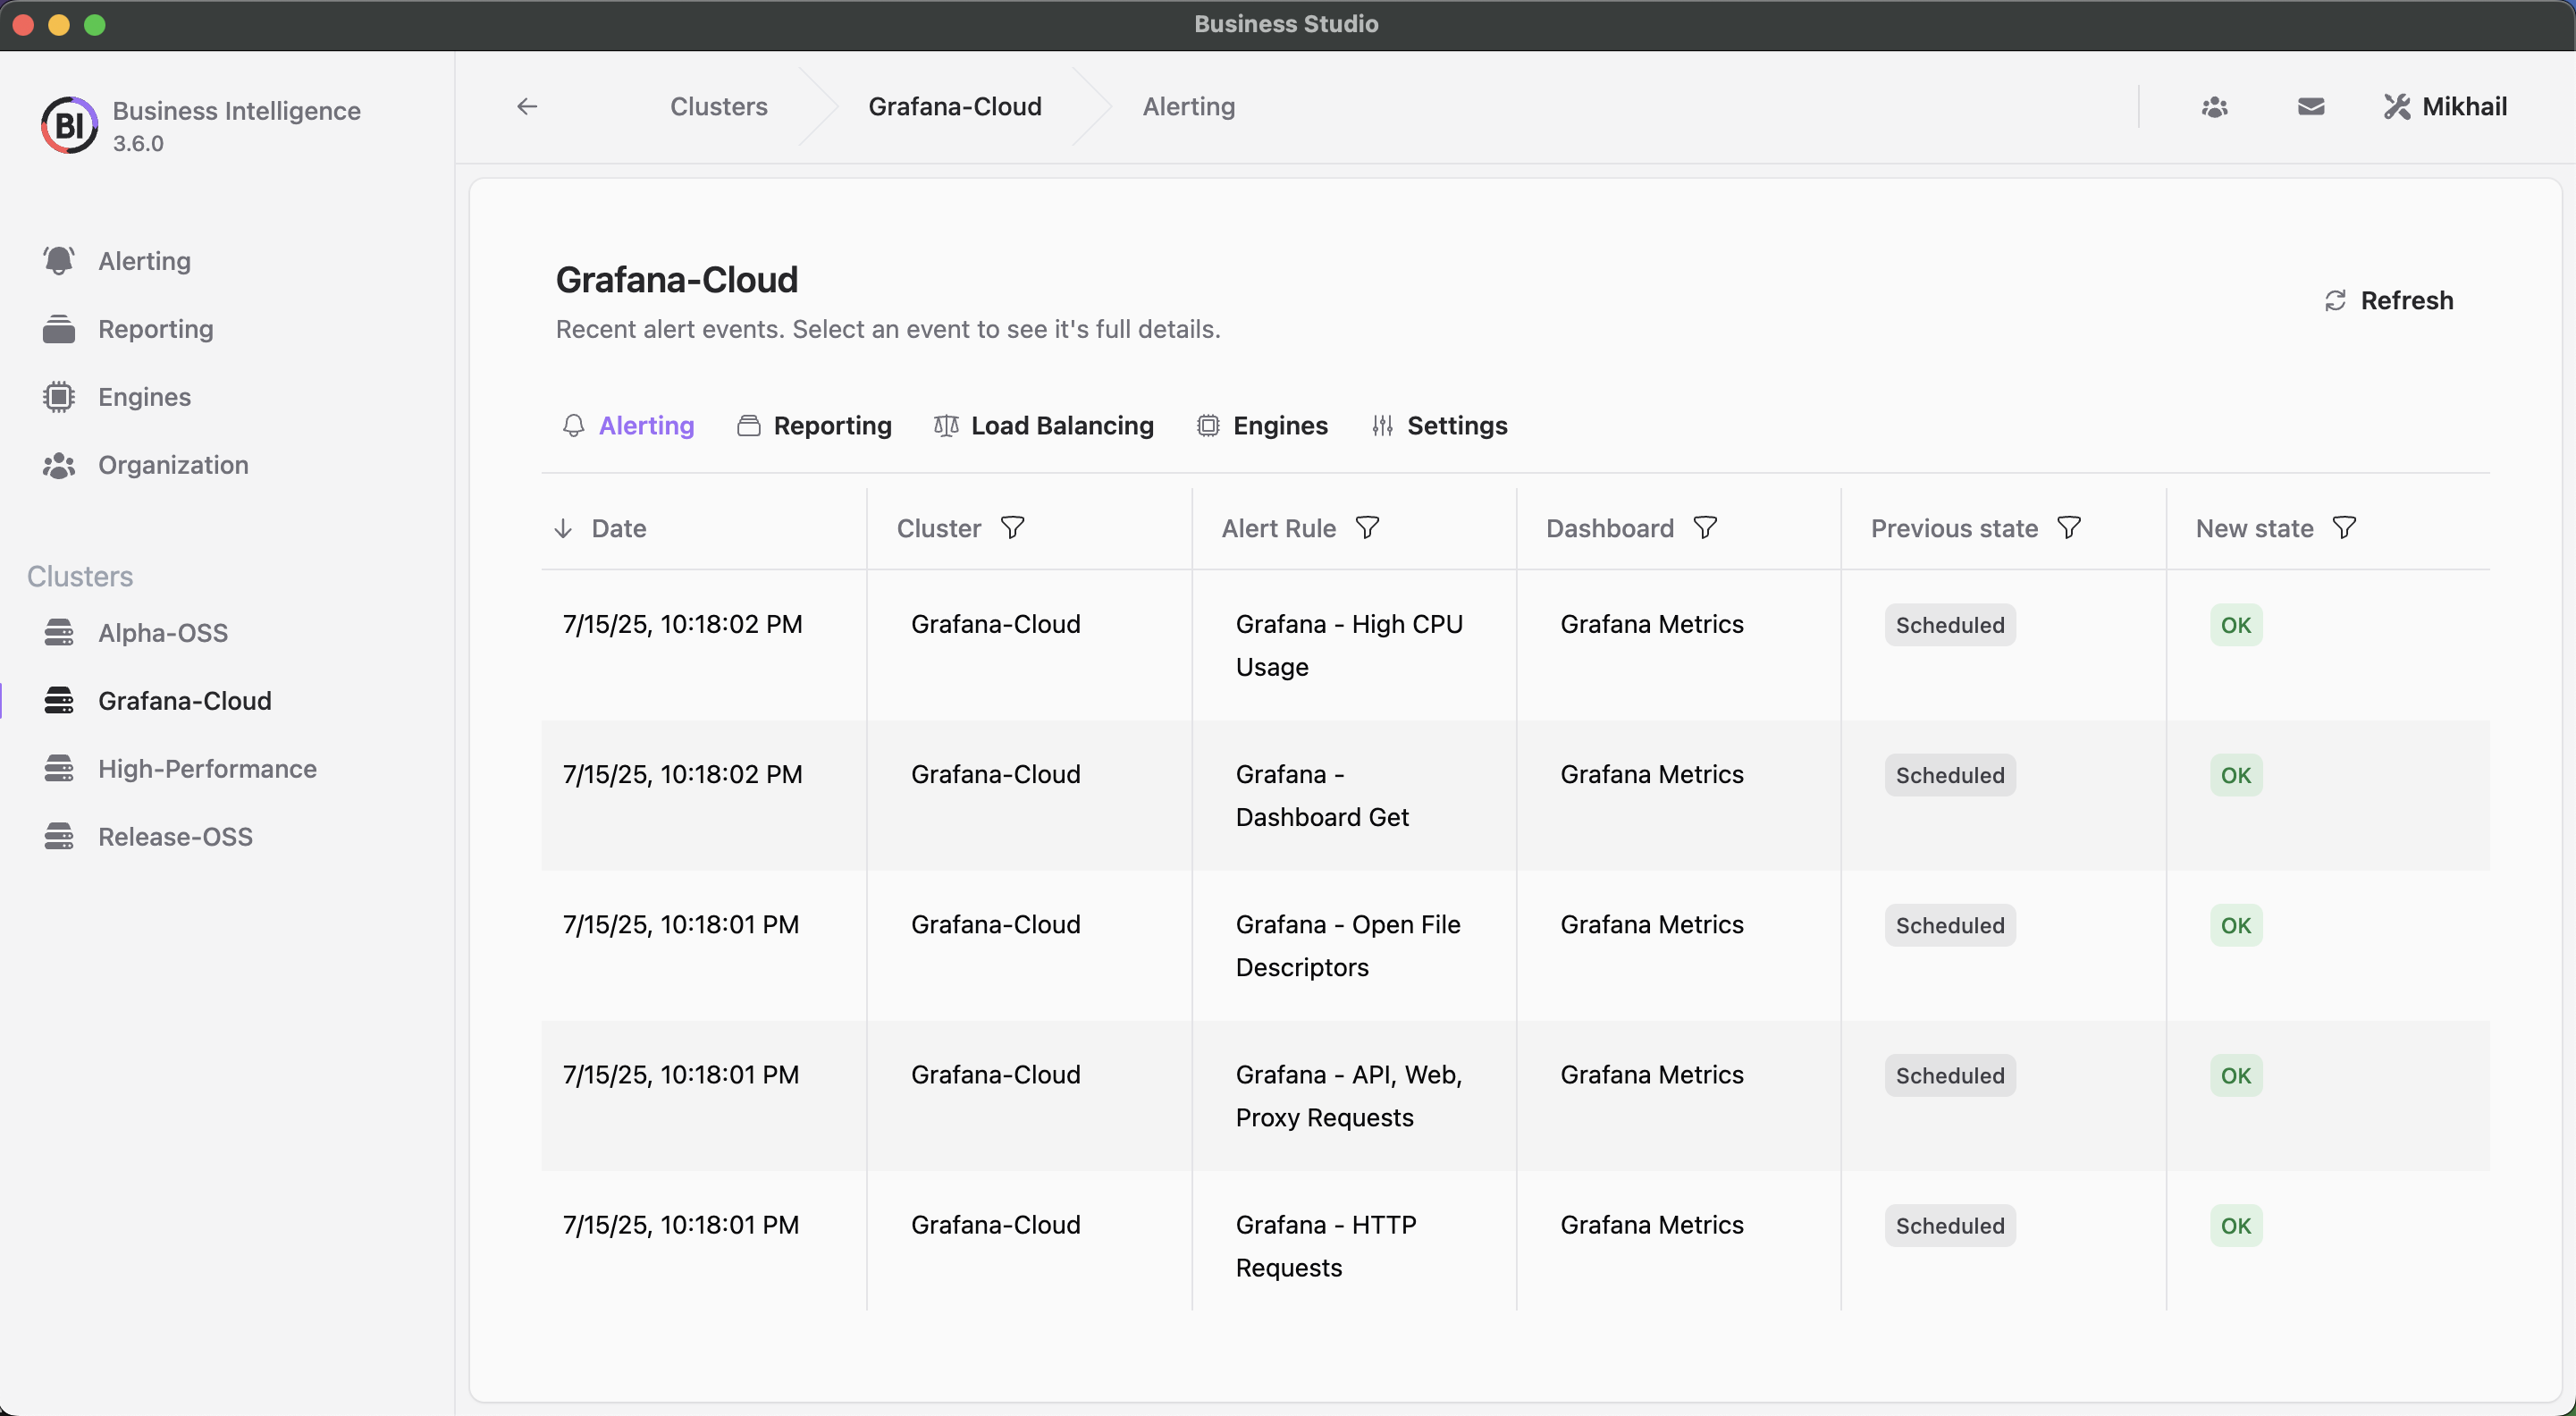
- Access Business Studio: Connect to the Business Engine linked to your Grafana Cloud instance.
- Define Alert Rules: In Business Studio, create rules based on the Grafana Metrics dashboard to monitor key performance indicators.
- Configure Notification Actions: Set up notifications to trigger incidents in Grafana Incident when an alert condition is met.
These alert rules align with the color-coded thresholds (green, orange, red) in the dashboard panels, ensuring consistency between visualization and alerting logic.
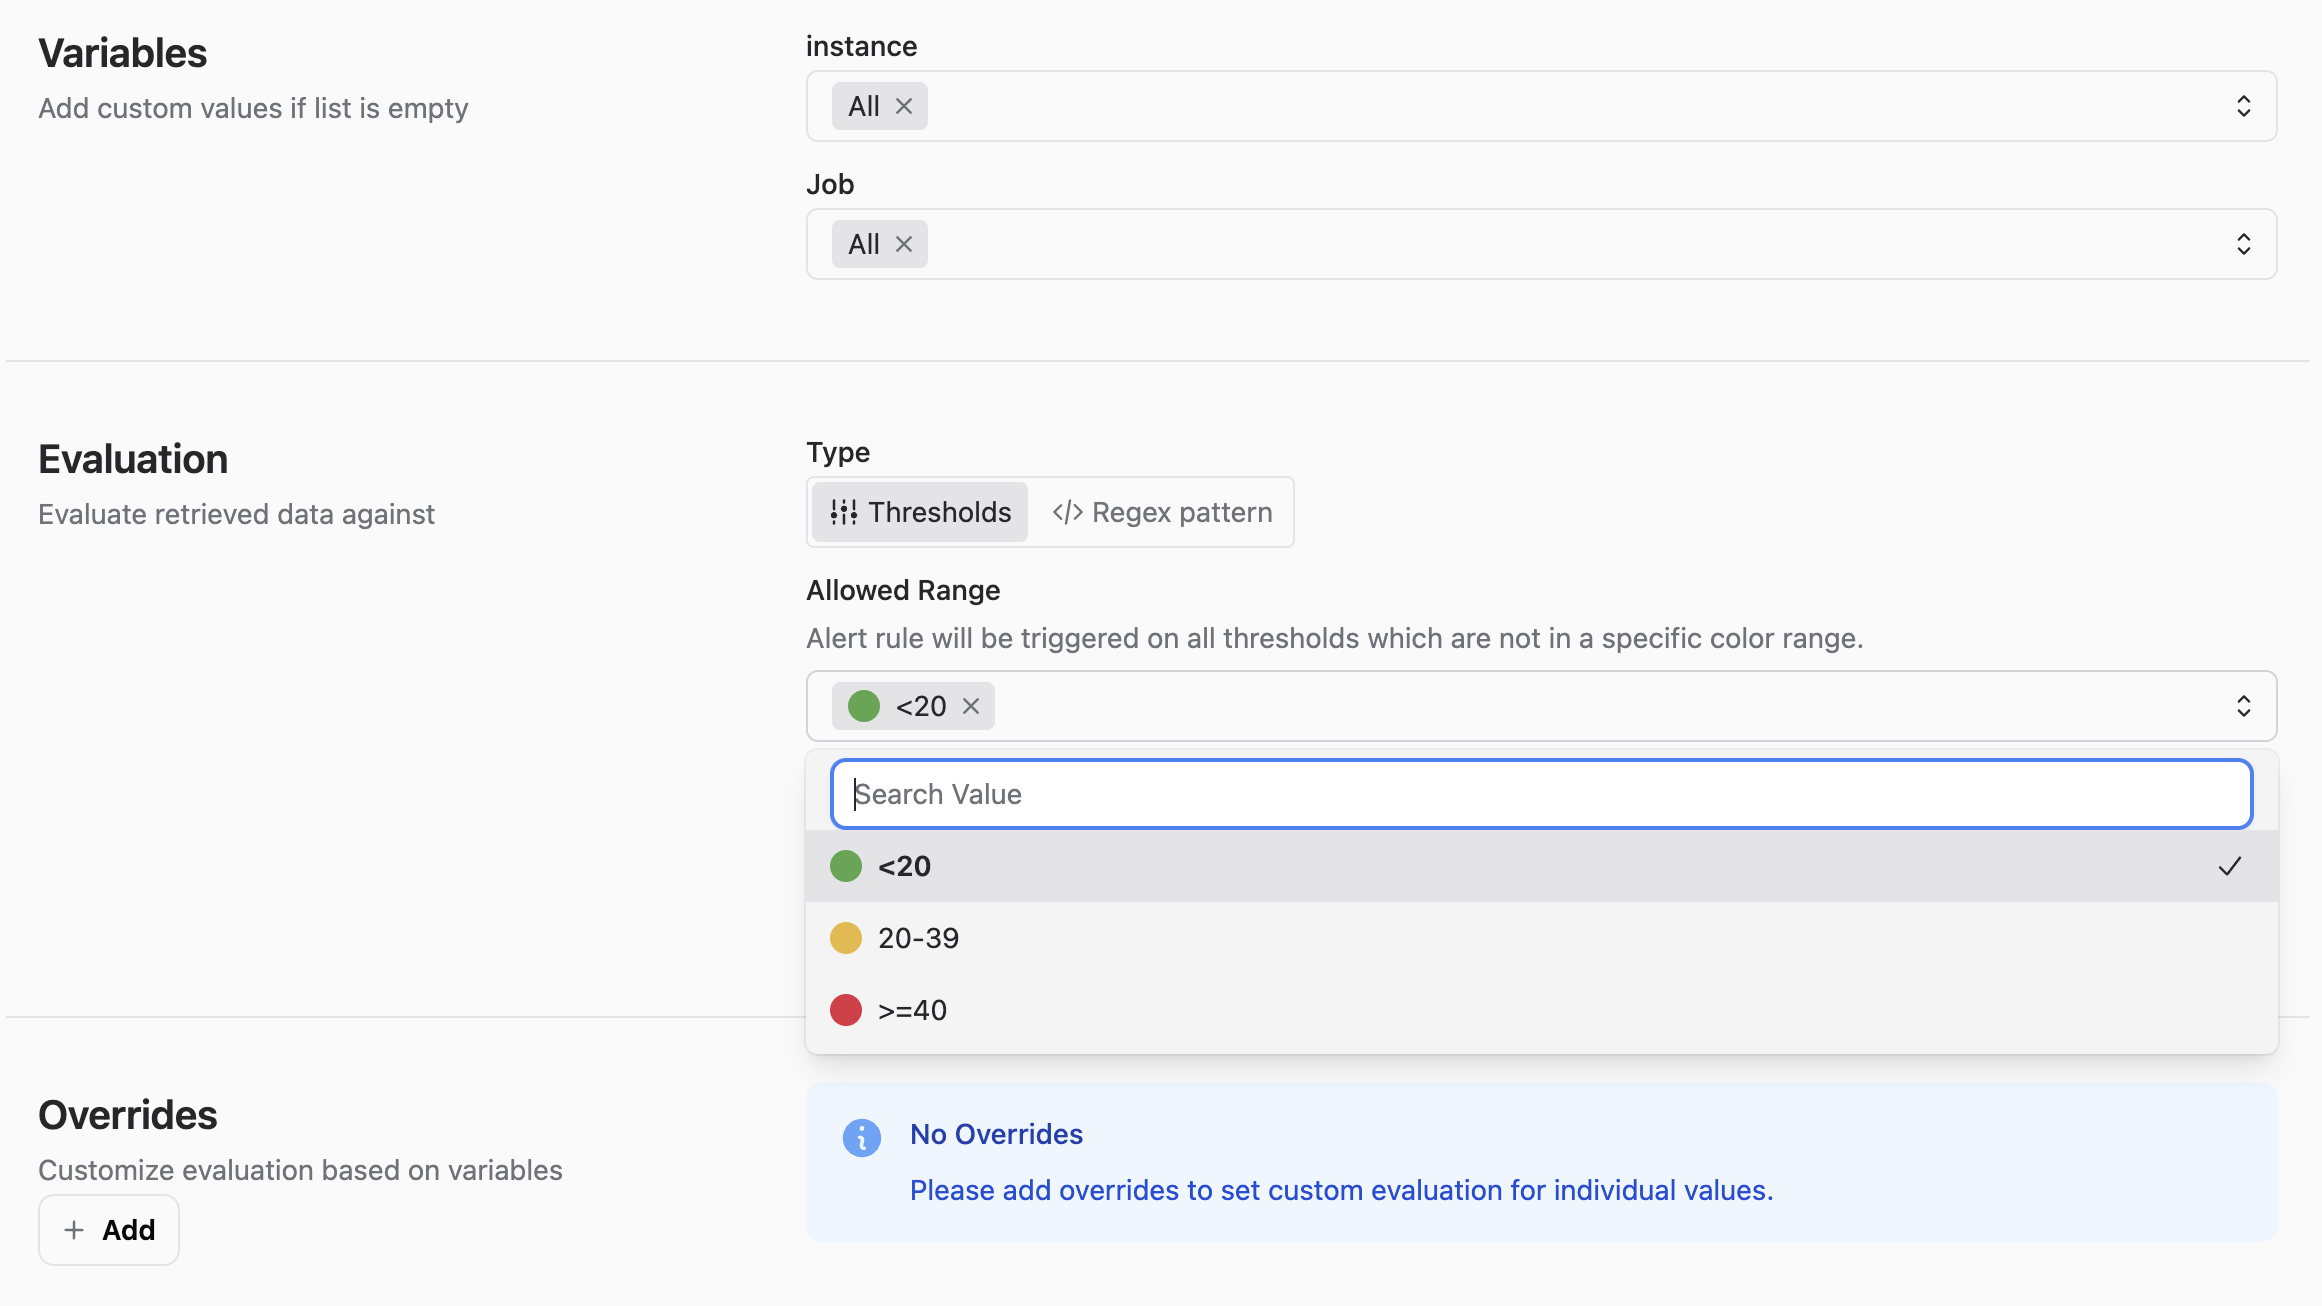
In the upcoming version 3.7.0, thresholds will be determined automatically for even greater ease of use.
Automating Incident Creation with Node-RED
To streamline incident management, we’ll automate the creation of incidents in Grafana Incident using a Node-RED workflow. Node-RED is a flow-based development tool ideal for integrating alerts with incident management systems.
- Install Node-RED: Follow the installation guide to set up Node-RED on a server or use a cloud-hosted instance. Ensure it can access your Grafana instance and Grafana Cloud API.
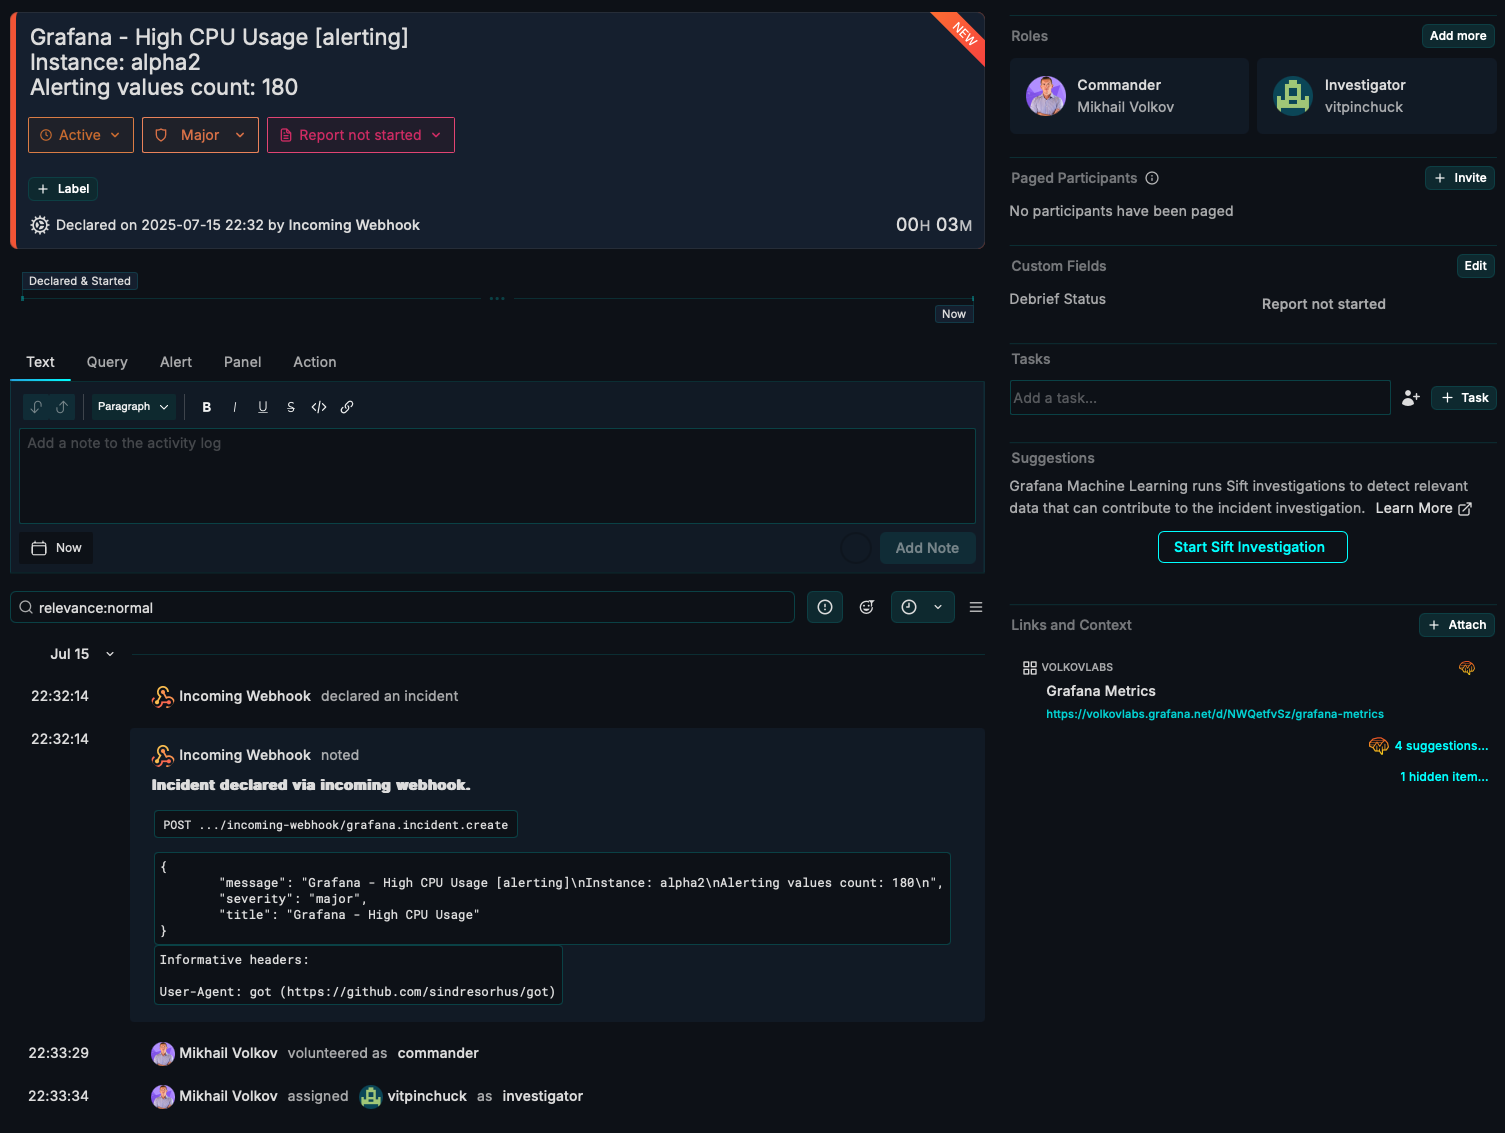
- Build a Workflow for Alerts: Create a flow in Node-RED to listen for alerts from the Business Intelligence platform and create corresponding incidents in Grafana Incident.
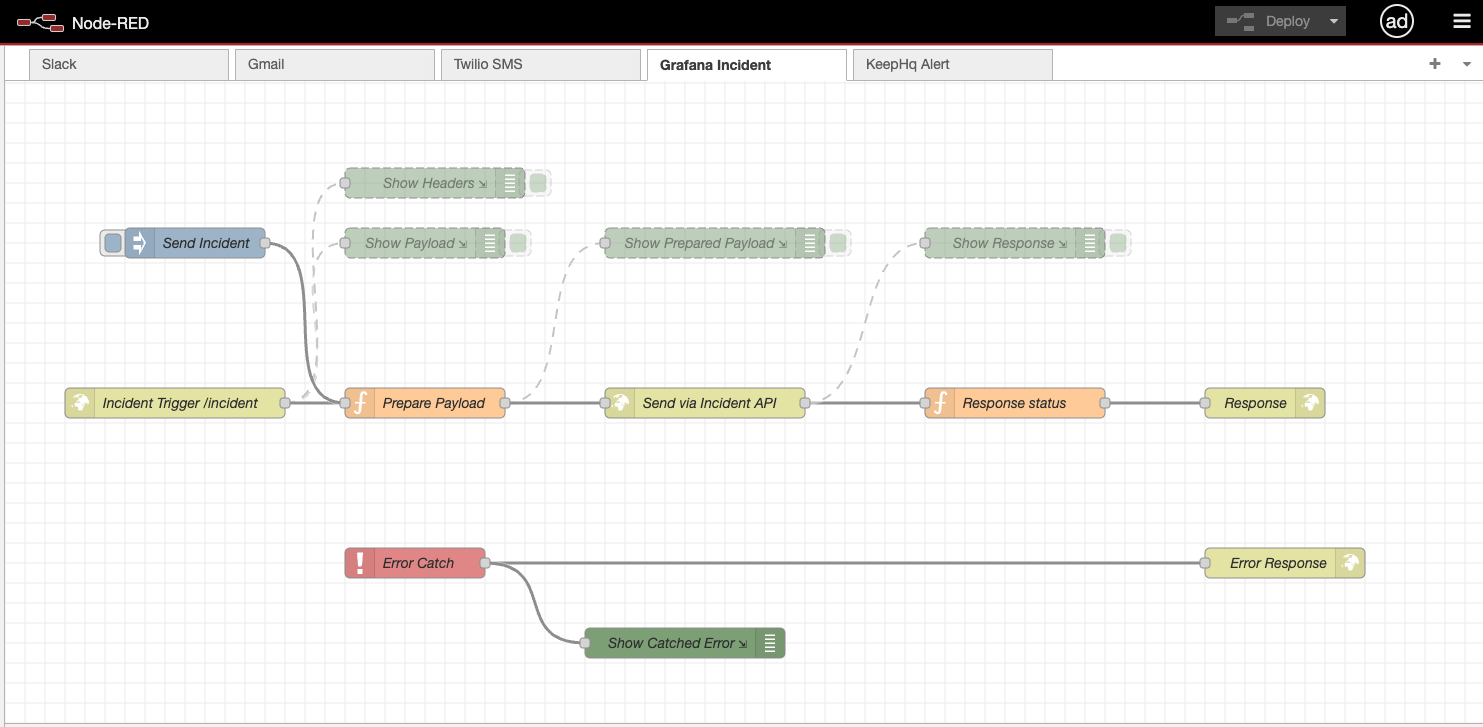
- Configure Grafana Incident API: Use Grafana Cloud credentials to authenticate API calls from Node-RED, ensuring the correct endpoint for incident creation is specified in the HTTP Request node.
- Test the Workflow: Trigger a test alert from the Business Intelligence platform and confirm that an incident is created in Grafana Incident with accurate details.
This workflow is included in the Business Intelligence repository alongside other resources for this setup.
Enhancing Monitoring with an Business Intelligence Platform
While Grafana Cloud offers robust monitoring capabilities, integrating a Business Intelligence (BI) platform provides an additional layer of validation and oversight. This multi-layered approach enhances data integrity and monitoring reliability. Here’s how to implement it:
- Configure Independent Alerts: Set up alerts in the BI platform to detect anomalies not captured by Grafana Cloud.
- Establish a Feedback Loop to Grafana Incident: Use APIs or Node-RED workflows to integrate the BI platform with Grafana Incident, ensuring issues detected outside Grafana Cloud are escalated automatically for unified incident management.
By incorporating a BI platform, you create a resilient monitoring strategy that minimizes blind spots and supports informed decision-making. This is especially valuable for organizations managing complex, distributed systems.
Conclusion
This guide has equipped you with a powerful end-to-end monitoring system for Grafana OSS. By leveraging Grafana Alloy and Grafana Cloud, you’ve enabled seamless metric collection and visualization through a custom dashboard. Proactive alerts in the Business Intelligence platform, combined with automated incident creation via Node-RED and Grafana Incident, ensure rapid detection and response to issues.
Integrating a BI platform adds a critical layer of data validation and cross-source monitoring, enhancing reliability and reducing operational risks.
This solution minimizes downtime, improves operational efficiency, and provides a scalable framework for monitoring complex environments. Whether managing a single Grafana instance or a distributed system, these tools and workflows enable you to stay ahead of potential issues and maintain optimal performance.
Getting Started
Business Intelligence Platform is a powerful solution that harnesses Docker containers to deliver a modular, scalable, and user-friendly environment for alert-driven analytics. Whether you're just starting out or are an experienced user, our Quick Start Guide is designed to help you set up and deploy the platform effortlessly.
This guide provides a step-by-step walkthrough of the essential setup process, ensuring you can get up and running in no time. Key topics include:
- Configuring the Business Engine: Understand how to set up the core component that powers your analytics.
- Launching the Business Studio: Deploy and access the intuitive interface on your local machine for seamless management and visualization.
We’d Love to Hear From You!
Your feedback and ideas are invaluable to us! Here’s how you can get involved:
- Questions, Feature Requests, or Bugs: Submit a Zendesk ticket to receive a swift and personalized response from our dedicated support team.
- Join the Community: Subscribe to our YouTube Channel and share your thoughts or suggestions in the comments.
Your input is crucial in helping us grow and improve, so please don’t hesitate to reach out!