Connect Data Manipulation panel for Grafana to API Server


We acknowledge the risks of data manipulation and consider security concerns seriously. This blog post explores three secure ways to connect Data Manipulation panel to an API server.
Our recent post and YouTube tutorial showcased various use cases to bring your Grafana dashboard to the next level using Data Manipulation panel. This plugin can insert and update application data, as well as modify configuration directly from your Grafana dashboard.
Before moving forward, we recommend reading the introductory article to become familiar with the Data Manipulation panel and its capabilities.
Architecture
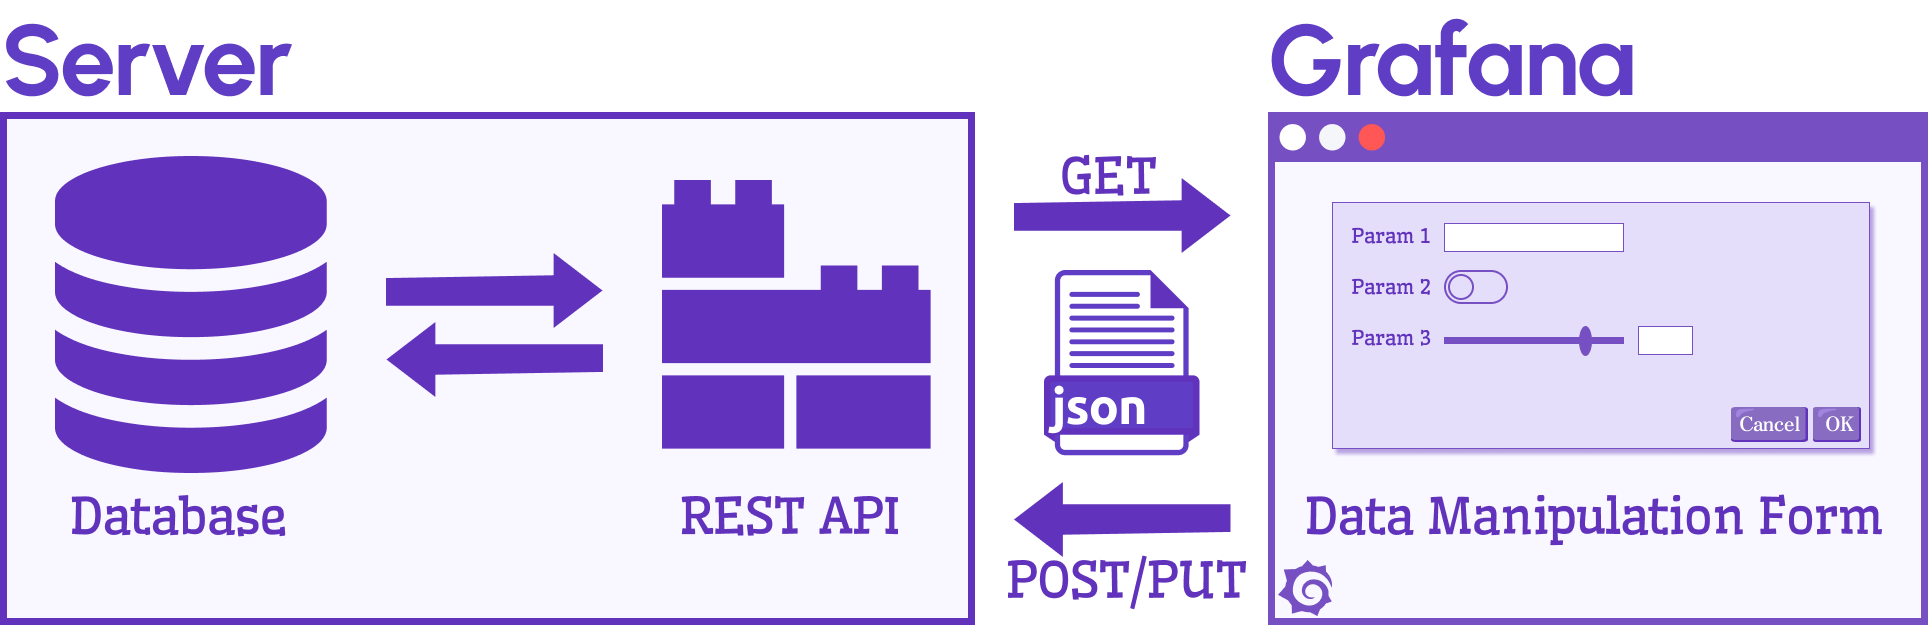
Data Manipulation panel options allow you to specify the URL for the GET requests to receive initial values and the POST, PUT, or PATCH requests to update values sent in the JSON format.
You can use any of the three methods to connect the plugin to an API server:
- Publicly available server with additional header parameters (CORS restrictions).
- API served using NGINX in the same domain as the Grafana server (CORS ready).
- Custom data source using an HTTP proxy.
Let's take a look at each of them closely.
Publicly available server
If your server is publicly available or resides within a private network, the simplest and easiest way is to directly connect it to the API server. Header parameters can be added to secure your REST API calls.
The disadvantage of this method is that API requests are visible to end-users. The REST API server should allow Cross-Origin Resource Sharing (CORS).
Cross-Origin Resource Sharing (CORS) is an HTTP-header-based method that enables a server to specify any origins (domain, scheme, or port) other than its own from which a browser should allow the loading of resources.
Example
We already explained how to configure the plugin in the video mentioned above. If this method works for your use case, you can find server code examples in the plugin's GitHub repository.
loading...
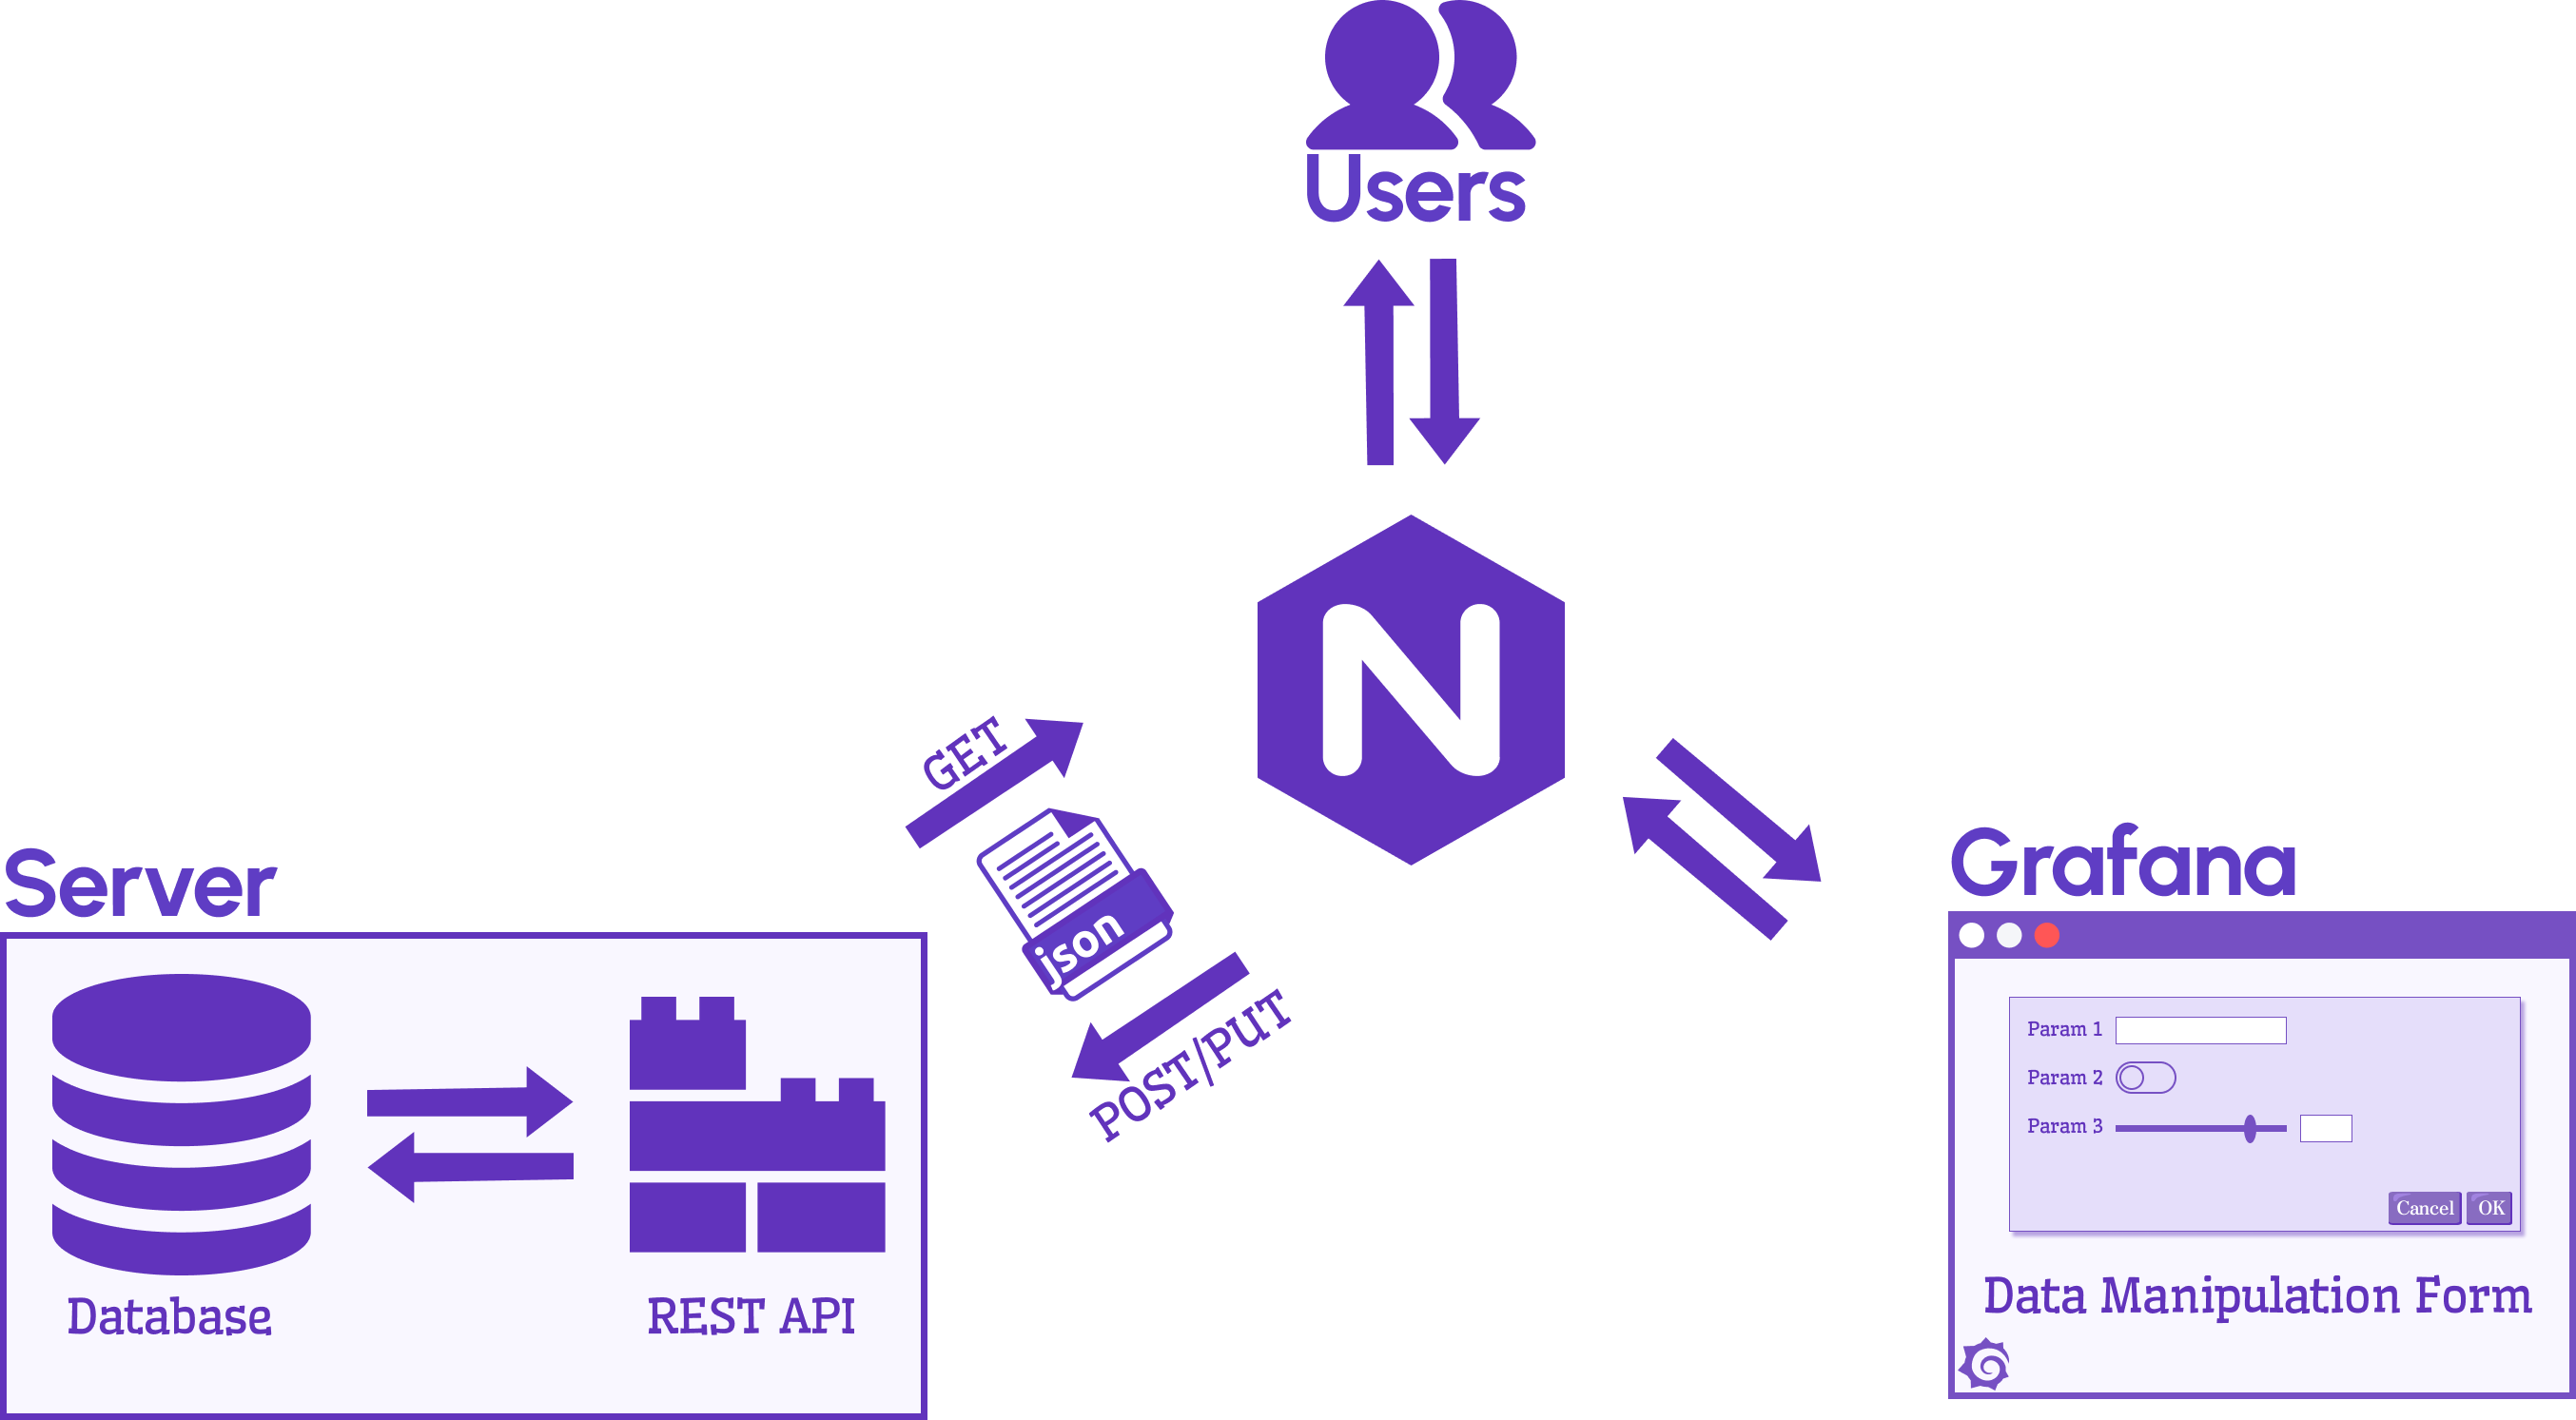
NGINX reverse proxy
We recommend that you run Grafana behind an NGINX reverse proxy for an additional security layer. The reverse proxy also allows you to provision additional API endpoints and static files in the same domain, which makes it CORS-ready.
To learn how to configure Grafana to run behind a reverse proxy, take a look at the Grafana tutorial Run Grafana behind a reverse proxy.
Configuration
You can add a section to redirect requests /api/data-form to the Docker container or server process in the NGINX configuration file. The rest of the requests should be redirected to Grafana.
The API server operates on the specific IP address and port accessible by NGINX, and end-users have no direct access to it.
server {
  listen 443 ssl;

  include /etc/nginx/conf.d/http_headers.conf;

  ssl_certificate /etc/nginx/ssl.crt;
  ssl_certificate_key /etc/nginx/ssl.key;

  ssl_session_cache builtin:1000 shared:SSL:10m;
  ssl_protocols TLSv1.2;
  ssl_ciphers EECDH+AESGCM:EDH+AESGCM:AES256+EECDH:AES256+EDH;
  ssl_prefer_server_ciphers on;

  location / {
    proxy_pass http://${GRAFANA_HOST}:${GRAFANA_PORT};
    include /etc/nginx/conf.d/proxy.conf;
  }

  location /api/data-form {
   proxy_pass http://${API_HOST}:${API_PORT};
   include /etc/nginx/conf.d/proxy.conf;
  }
}
This option is CORS-ready as an endpoint is a part of the same domain, and API can be secured using Grafana or any other authentication method.
Custom Data Source
The last method is to use a custom data source with an HTTP proxy, which you can create following the Grafana tutorial Add authentication for data source plugins and our data source template.
Grafana sends the proxy route to the server, where the data source proxy decrypts any sensitive data and interpolates the template variables with the decrypted data before making a request.
HTTP Proxy
Data sources with an HTTP proxy keep authentication information hidden from an end-user performing server-side requests.
To retrieve and update data using the HTTP Proxy, the required endpoint should be defined in the routes section of the plugin.json configuration file.
{
  "method": "GET",
  "path": "feedback",
  "reqRole": "Viewer",
  "url": "{{ .JsonData.url }}/api/feedback"
},
{
  "method": "POST",
  "path": "feedback",
  "reqRole": "Viewer",
  "url": "{{ .JsonData.url }}/api/feedback"
},
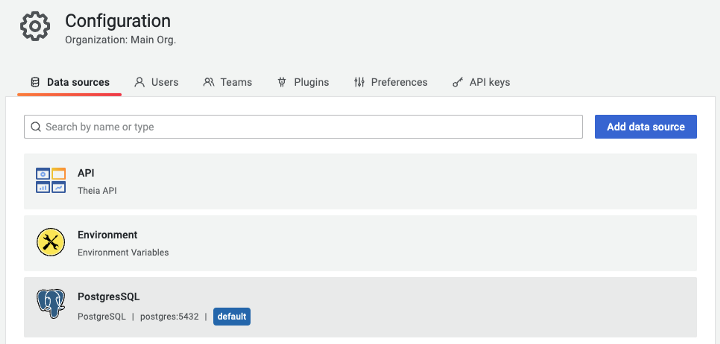
Configuration
Every data source configured in Grafana has a sequential number and unique string identifiers. In our case, the API has an identifier 2 which we will use for proxying requests.
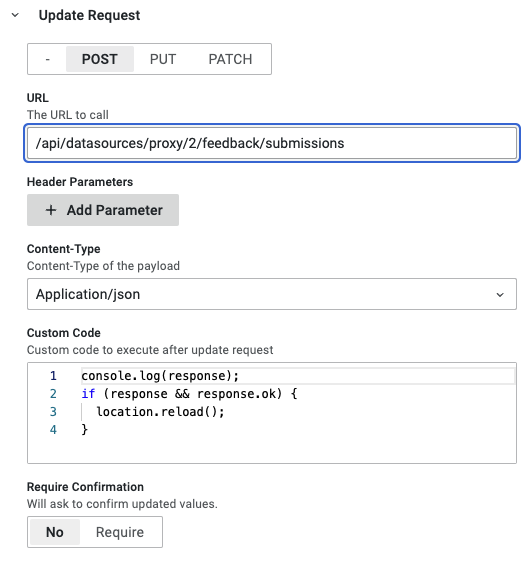
Let's set up the Update Request options for the Data Manipulation panel. We set the URL /api/datasources/proxy/2/feedback/submissions to proxy requests to the API server instead of accessing directly.
We keep enhancing the Data Manipulation panel and collecting user feedback in search of fresh and challenging use cases.
The upcoming version of the plugin will be based on the Grafana 9 toolkit but will still preserve support for Grafana 8.5+.
We're Always Happy to Hear From You!
We value your feedback and are eager to connect with our community and partners. Whether you have a question, an idea, or an issue to report, here’s how you can reach out:
- Community Members: Have a question, want to suggest a new feature, or found a bug? We’d love to hear from you! Please create a GitHub issue to start the conversation.
- Enterprise Partners: Need assistance or have an urgent request? Open a Zendesk ticket for a prompt and dedicated response from our team.
- Join the Conversation: Stay updated and share your thoughts! Subscribe to our YouTube Channel and leave your comments—we can’t wait to hear what you think.
Your input helps us improve, so don’t hesitate to get in touch!