JSON API Data sources in Grafana

Grafana is a powerful visualization tool with all the bells and whistles you can imagine. However, Grafana does not operate as a standalone application. It displays data, but neither generates or stores it (with some exceptions, like Business Input data source, storage function). Grafana always communicates with external systems, most commonly a data storage, regardless of the type or architecture it uses.
Access via API is one method by which a visualization tool can connect to data storages. In this article, I want to share my evaluation of the existing API data sources that Grafana can work with.
What is an API data source?
Let's start with the basics to ensure we're all on the same page.
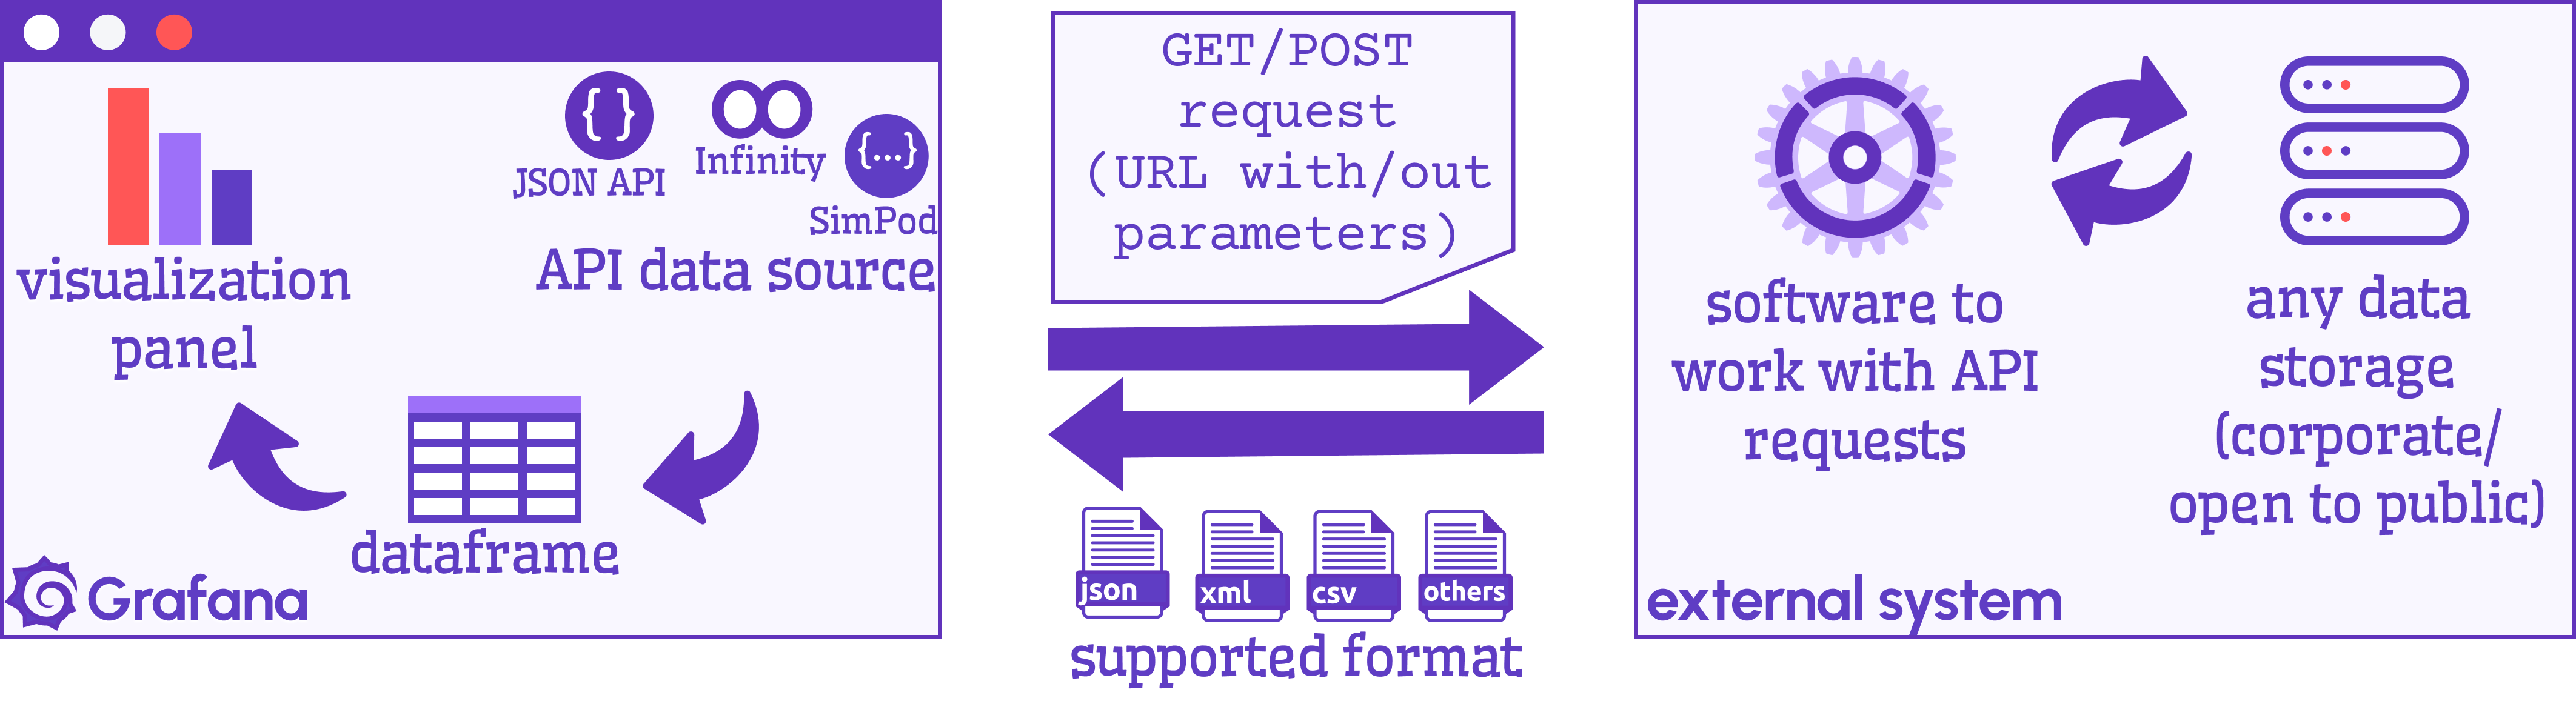
In Grafana, the data source acts as an interpreter between the data storage format and a Grafana data frame.
The Grafana data frame is a table-like data structure that you can refer to using column names when configuring your Grafana visualization panel or any other Grafana aspects. You can think of the Grafana data frame as a data table within Grafana.
API (Application Programming Interface) is a widely used term in computer technologies, but for an inexperienced person its definition may see too vague and mysterious. Without ever trying API, you could feel some frustration and disorientation, but it's not so complicated as one can imagine.
API is a technique that allows two systems to communicate data between each other (I know, it still sounds like a mystery). In terms of Grafana as a visualization tool, the API retrieves a file generated by another program (often a database extract) and then displays it on the Grafana dashboard.
Basically, you tell Grafana to take a file created somewhere else (typically a URL) and read it according to the provided rules (generally by specifying the names of columns and/or data components).
All of this brings us to the API data source definition. In Grafana, an API data source is a plugin that downloads a file from a supplied link, reads it, and, finally, transforms it into a Grafana data frame by following the appropriate instructions.
Voila! That was your API 101 crash course.
The most popular API data sources
I have them on my schema above. They include
- JSON API
- Infinity
- SimPod
Let's explore them one by one.
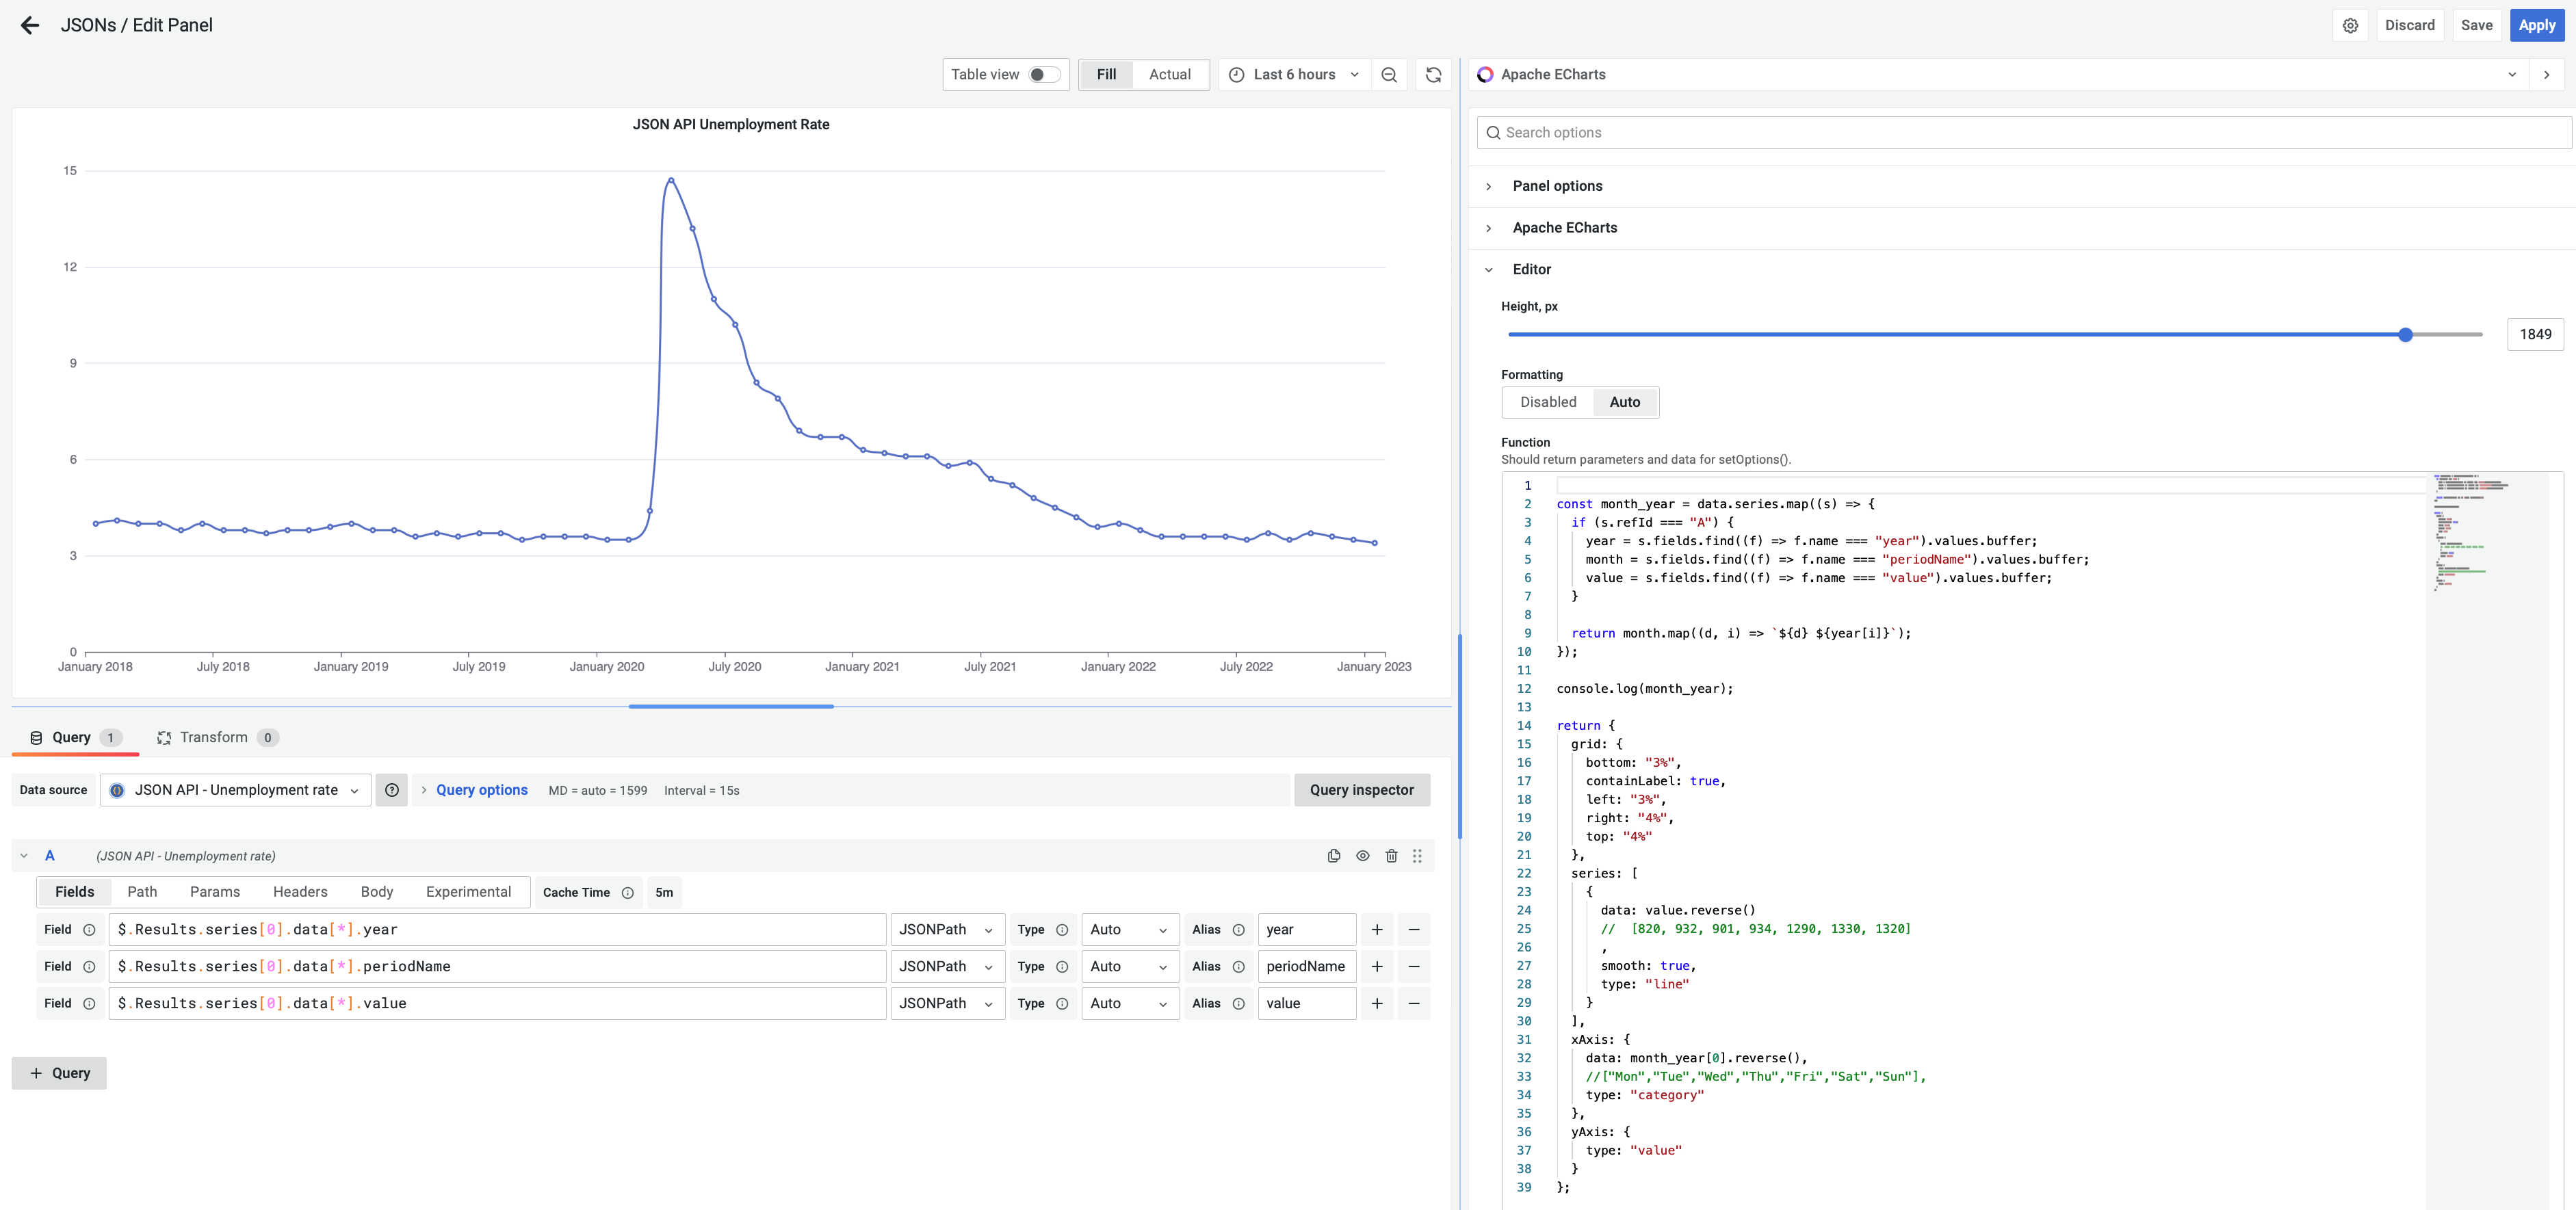
JSON API Data source
Yeah, that's what it's called. It would be much simpler if it had a more unique name. Arugula seems like a good name for a data source, so why not go with that? However, we're stuck with two excessively used words combined together. So brilliant. Needless to say, it does not aid in online searches, but that's beside the point.
Marcus Olsson is an author of this plugin. Grafana Labs acquired it a while ago and now controls and maintains it. Unfortunately, no new features are in the horizon.
Supported formats
The JSON API data source only supports the JSON format. So, without exceptions, the system from which you want to retrieve this file must generate a JSON file for you.
Access
If you're new to API, I have good news for you: we will skip over the topics of access and CORS restrictions. However, I must mention them because Grafana does not explicitly warn you when an external system rejects your request due to CORS restrictions. This can leave you in a compete state of disorientation as Grafana will act as if nothing is happening.
Open data sets, by definition, do not have CORS restrictions, which is why the JSON API data source is an excellent choice to work with them. This is especially true considering that the JSON API data source has fewer parameters and uses a straightforward interface.
There are various open datasets available to anyone looking for free data. Here are a few examples:
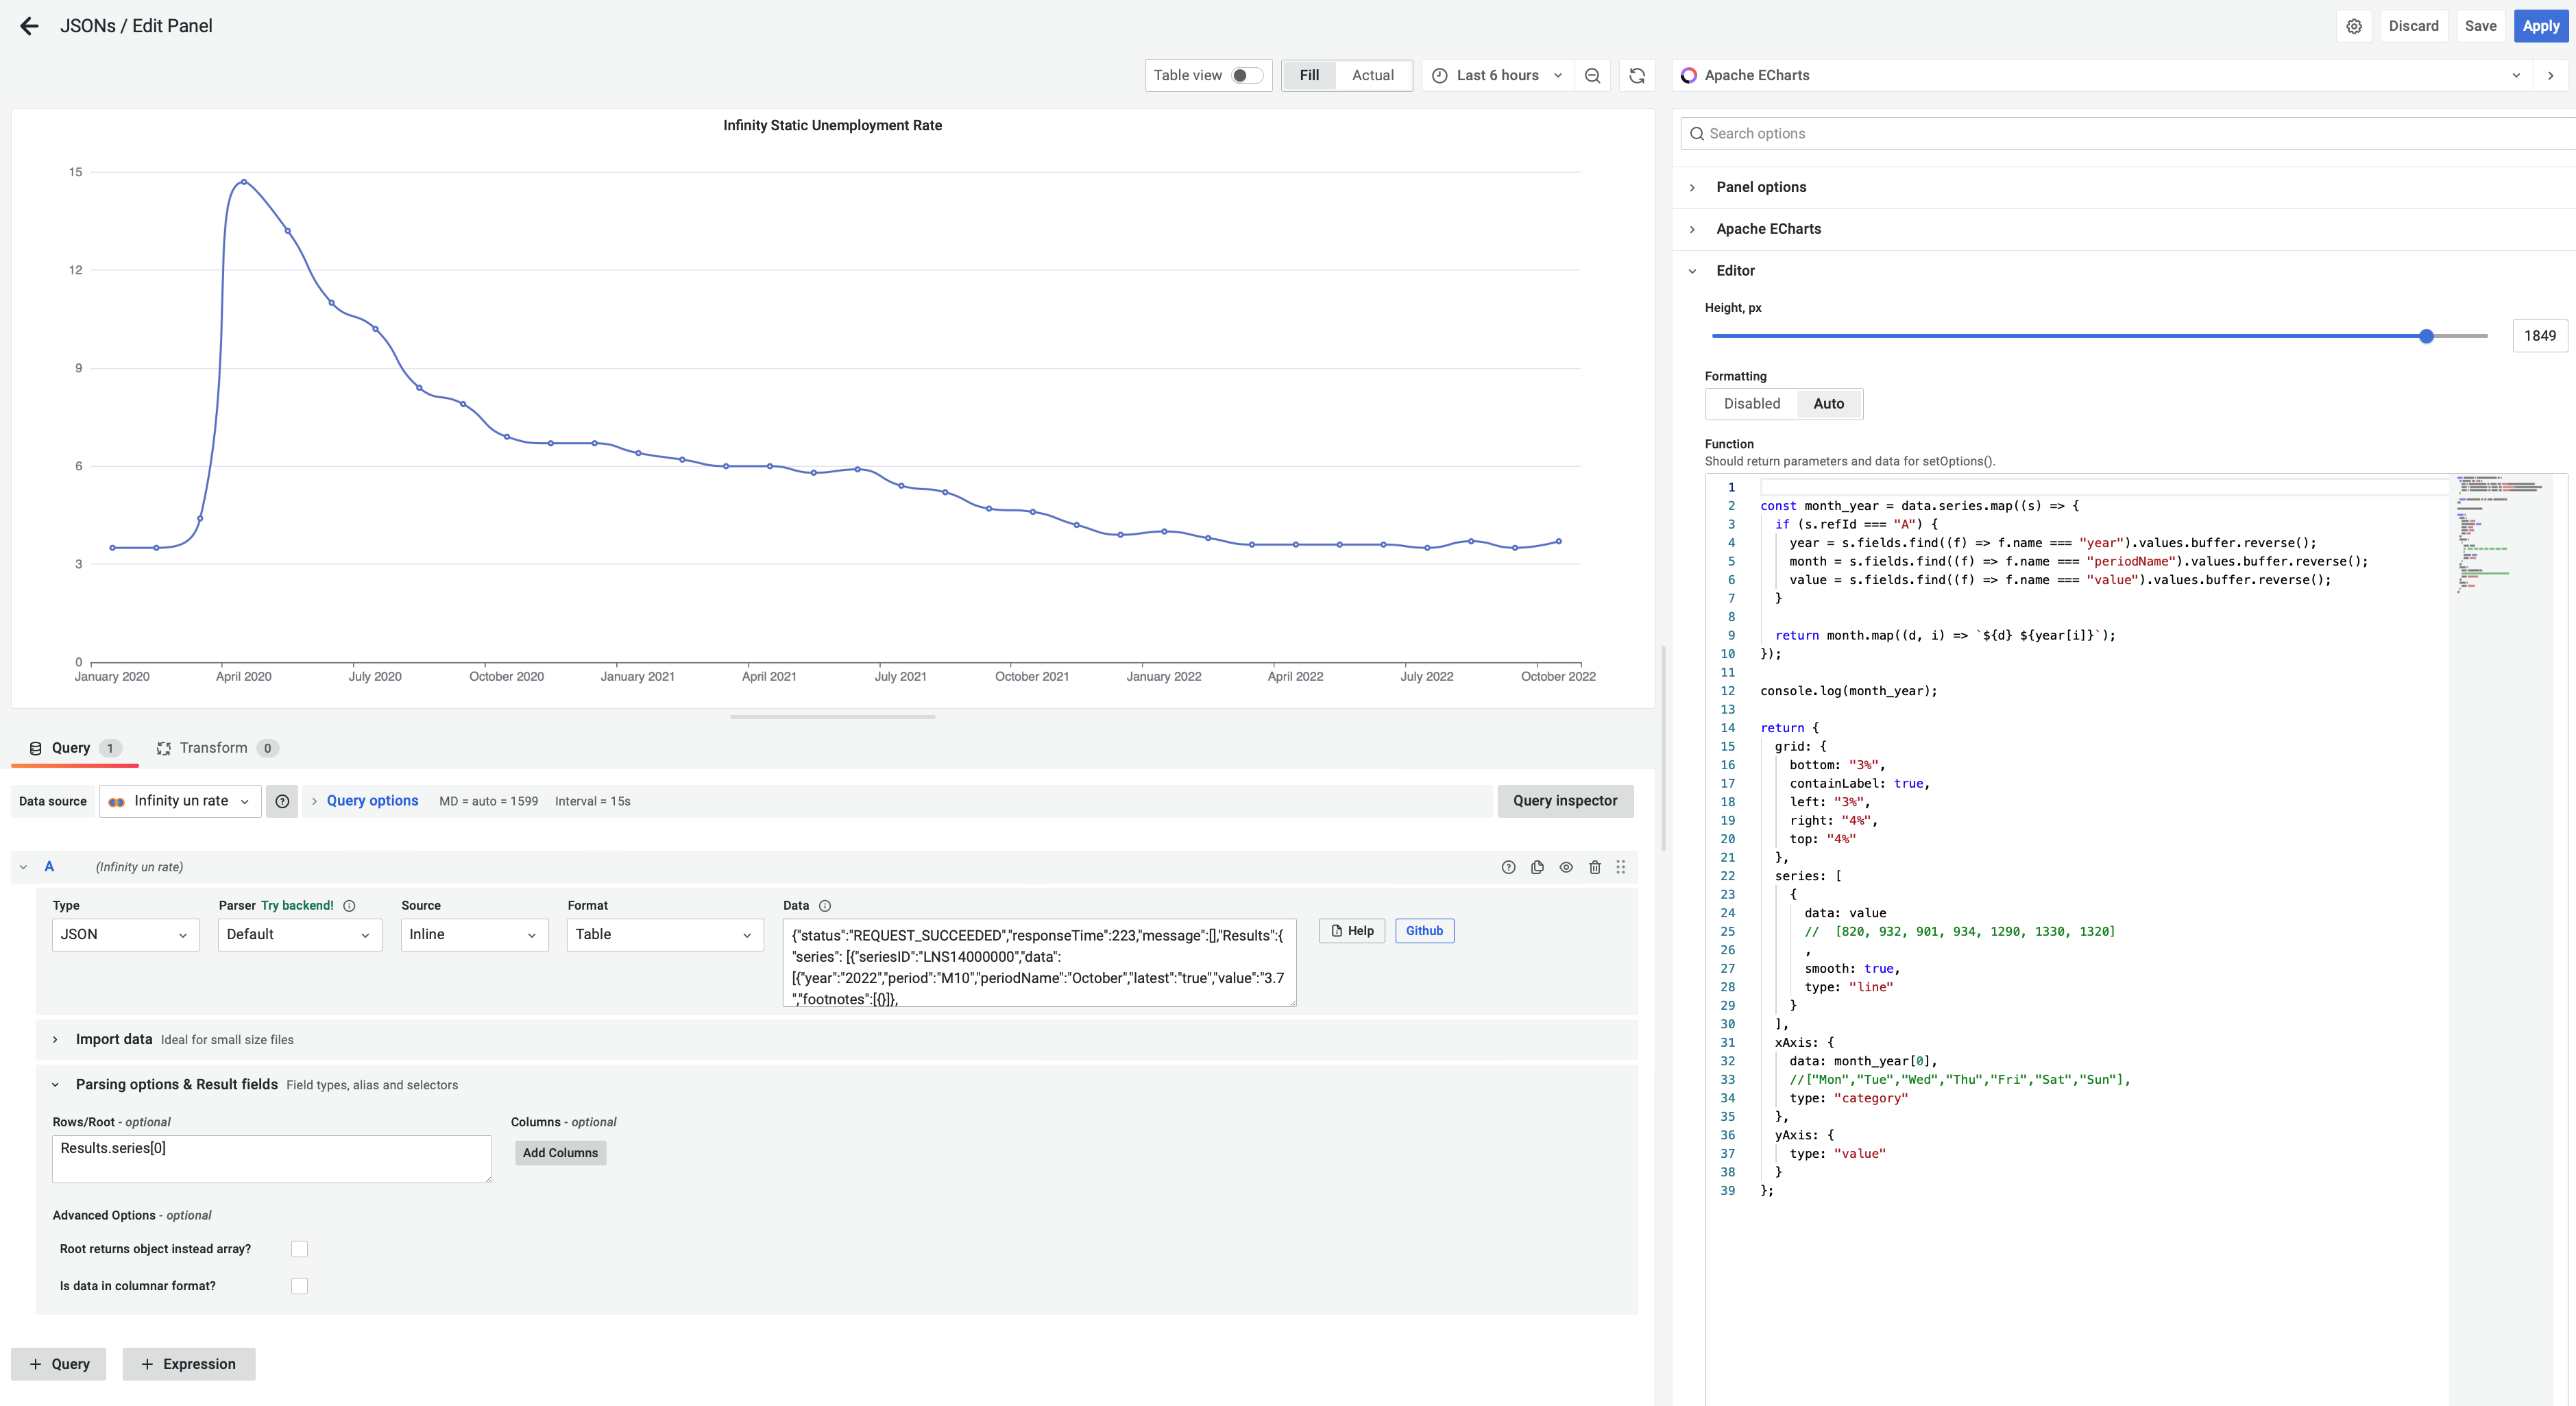
Infinity API data source
It has a fantastic name. It is one-of-a-kind, unforgettable, and meaningful.
Sriramajeyam Sugumaran created this plugin. He still maintains and supports it to this day.
Supported formats
This data source's name, I believe, stems from the idea of supporting an infinite variety of interchange file types. Let's make a data source that can function with any data structure, the author reasoned. That is purely speculative.
It supports a variety of formats, including JSON, CSV, XML, GraphQL, HTML, UQL, RSS, ATOM, and some others.
Access
Infinity API, like the JSON API data source, may work with open data sets (no CORS constraints are applied). When CORS restrictions are enabled, Infinity API can sometimes circumvent them. And now, let's get a bit technical and dive a little deeper into Internet security.
To gain a better understanding of CORS, let's begin with the following concepts:
Same-Origin is a policy that strictly restricts interaction with resources solely to the same domain, host, and port. For example, the abc.com domain can retrieve data from abc.com/page1, but cannot access any other domain such as anyotherdomain.com.
Cross-Origin Resource Sharing (CORS) policy offers more flexibility by allowing interactions between different domains. When CORS restrictions are disabled, any domain can freely request data. On the other hand, when CORS restrictions are enabled, only certain domains designated in its allow list are permitted.
However, there is a potential way to bypass this restriction using the Infinity API data source. Since CORS operates on the frontend layer, specifically within browsers, the Infinity API data source can access data from other domains through the backend.
To check for any rejection errors, you can monitor the Console tab of your browser.
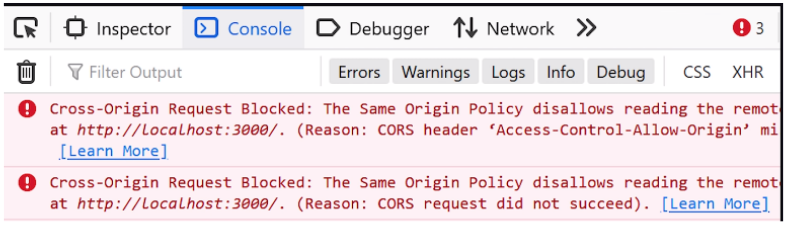
Grafana, unfortunately, will remain silent. Nothing will hint to the error with CORS restrictions.
SimPod API data source
This API data source is designed for advanced users and is closely integrated with the core functionality of Grafana, including tags, variables, range filters, and so on. To make all the cogwheels rotate properly, SimPod requires a specific data format. Therefore, it is necessary to set up an API server that can interact with external resources and retrieve data in its original format before converting it into the proprietary SimPod format.
The plugin was written by Šimon Podlipský, who still maintains and supports it.
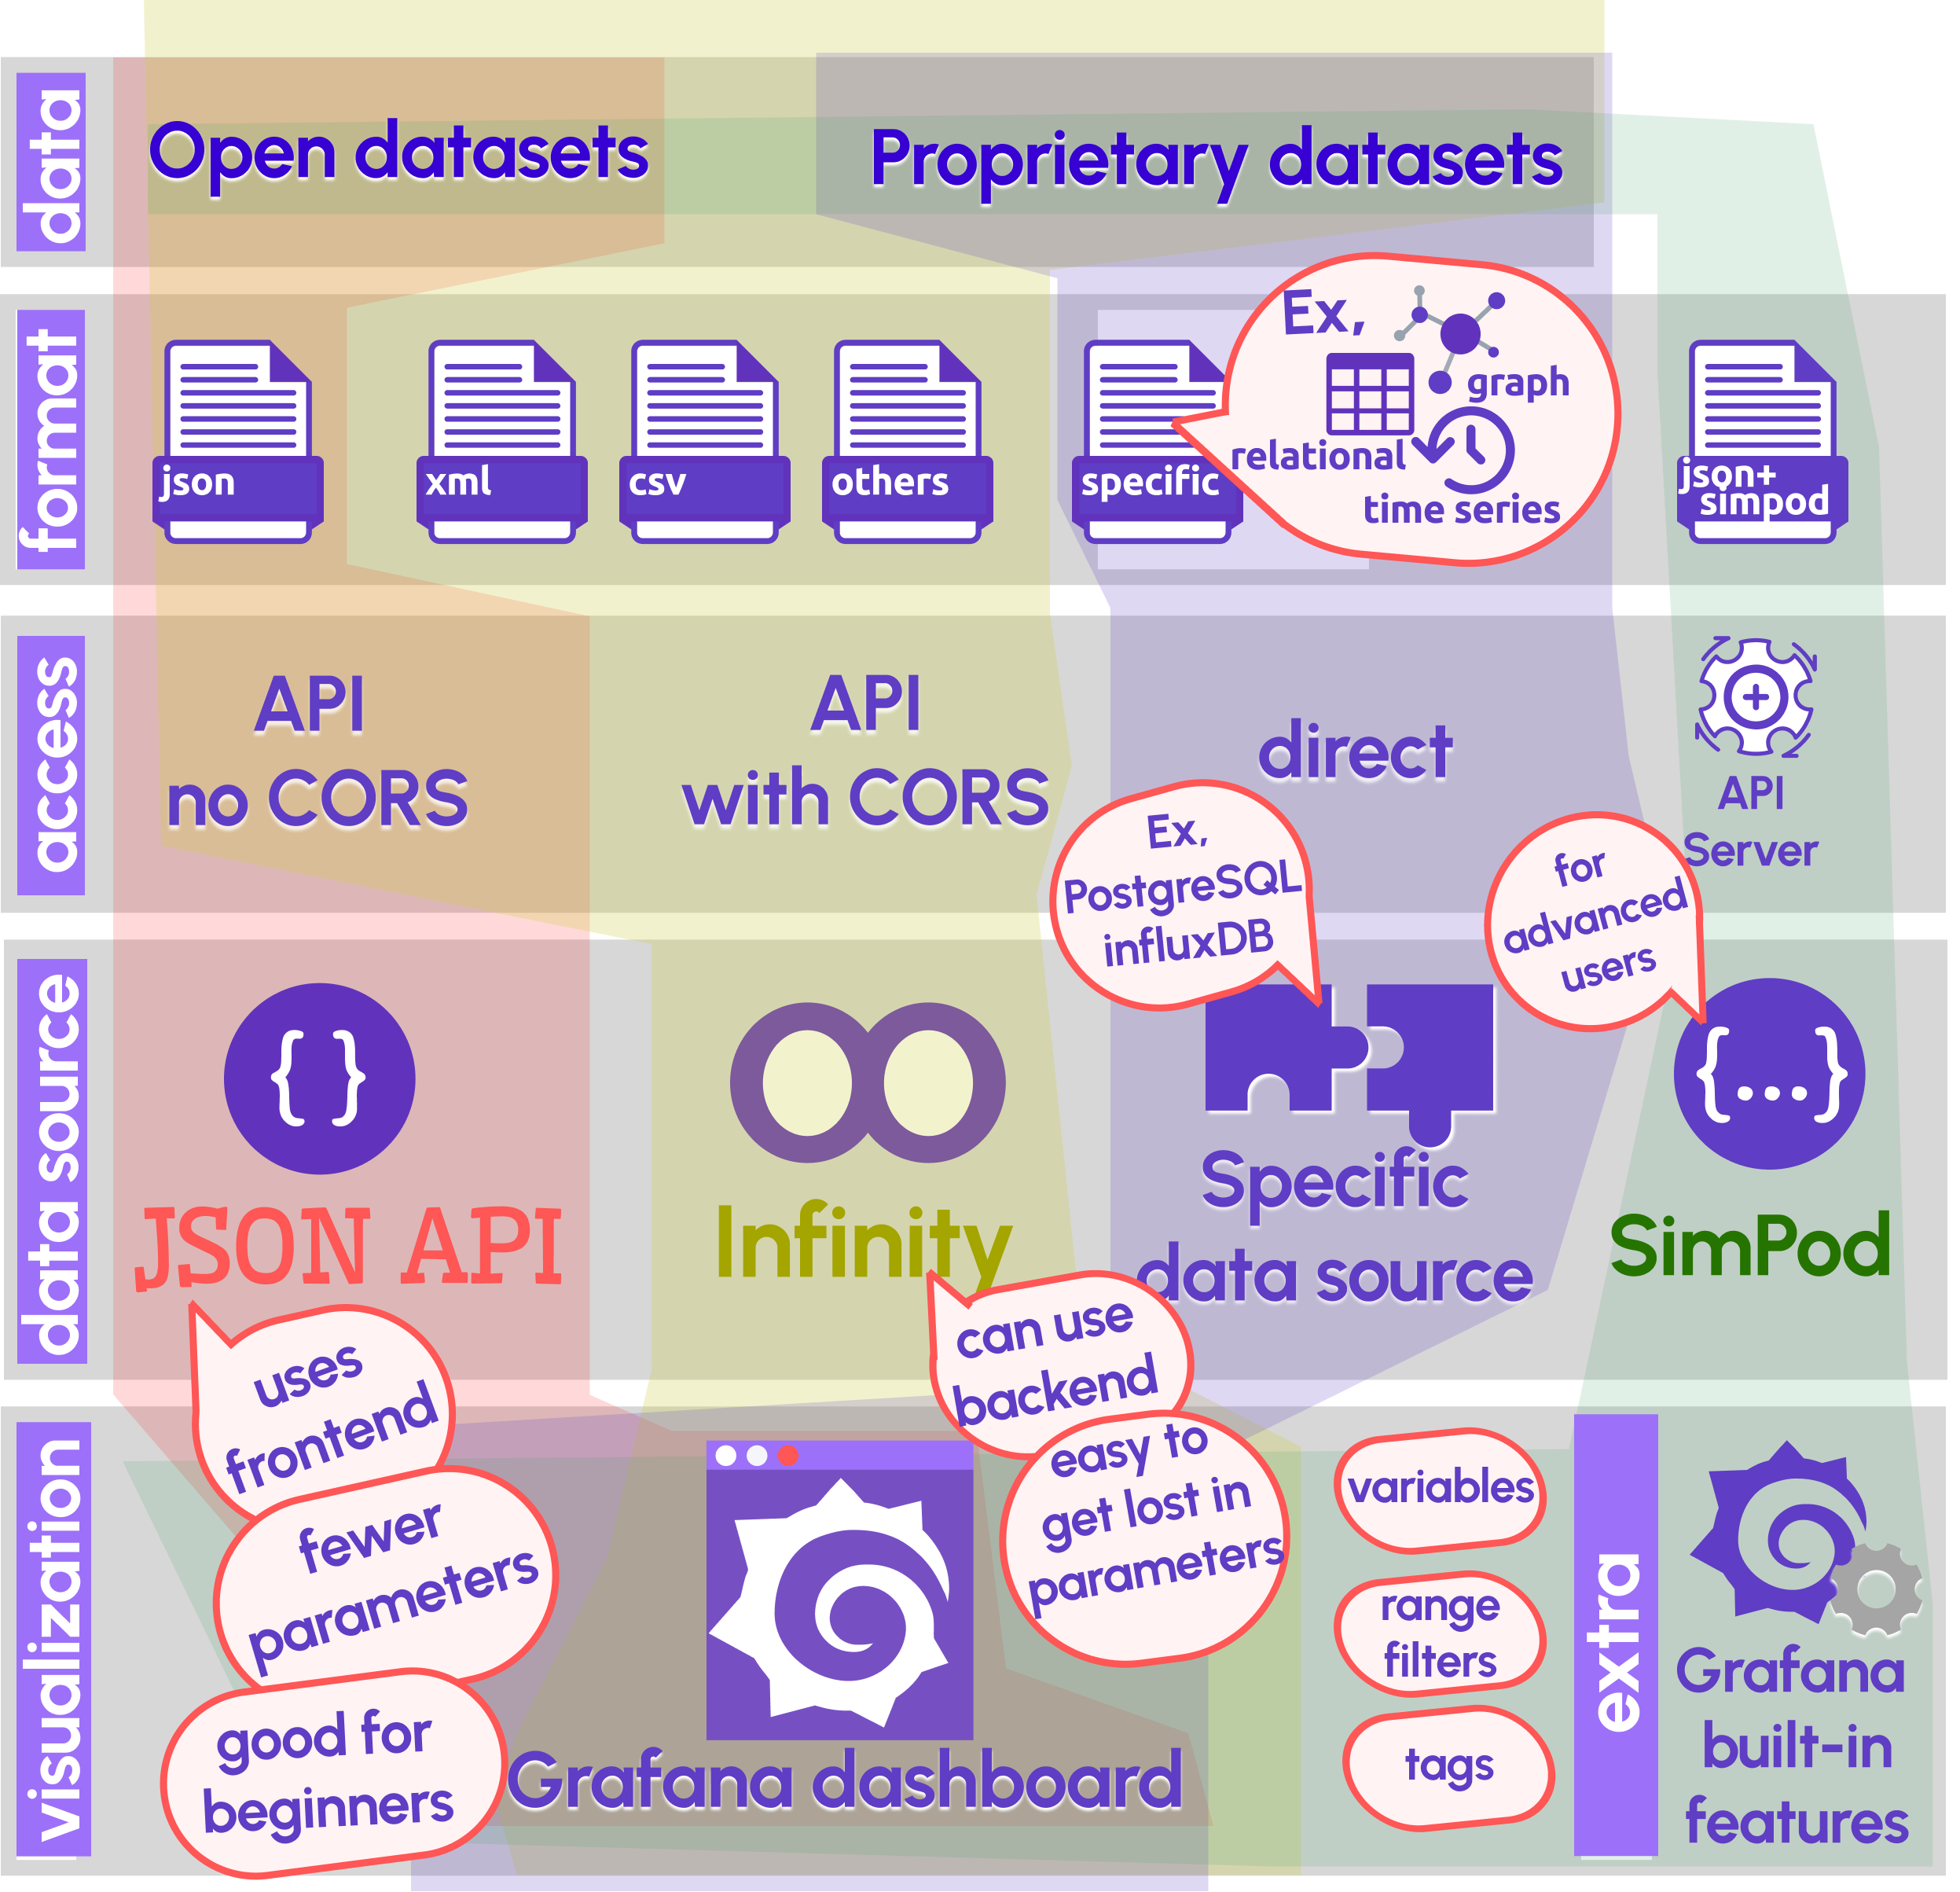
Summary schema
The schema below compares the four data sources: JSON API, Infinity, SimPod, and all other specific data sources grouped within the specific data source category. Each data source is represented by a distinct color, indicating different scenarios.
Red highlights the JSON API data source, showing that
- This data source is fantastic for beginners.
- Operates in an environment with no CORS constraints.
- Only supports one format (JSON).
- Excellent for working with public datasets.
Yellow highlights the Infinity API data source, showing that
- Infinity can operate in both CORS and non-CORS environments (since it can access data domains from the frontend and backend).
- Supports a variety of formats.
- Great to work with both open and corporate datasets.
SimPod, shown as Green, offers additional features on top of the primary Grafana dashboard but requires your API server to deliver a specific data format (in my schema, I named it as JSON+simpod).
With Purple, we represent all business scenarios that allow direct access to the database.
How to display the unemployment rate
Watch this video to discover how to display data on your Grafana dashboard using the JSON API and Infinity API data sources.
Let’s Stay Connected!
Join the Conversation: Stay updated and share your thoughts! Subscribe to our YouTube Channel and leave your comments—we can’t wait to hear what you think.
Your input helps us improve, so don’t hesitate to get in touch!