Hey, it is time for spring cleaning your Grafana

In this article, I explain how to remove unnecessary native Grafana plugins from your build. It is an easy way to avoid clutter in the Grafana UI. Moreover, as a tempting bonus for keeping only operating parts, you will end up with a lighter package attuned to your needs only.
This approach involves stripping a design down to its bare essentials and casting aside any elements that do not contribute to the pure beauty or function of an object or space.
The default Grafana package includes many data sources and visualizations panels, such as Timeseries, Logging, Traces, etc. Having it all installed at the beginning of the Grafana journey is no doubt impressive and convenient.
Scrolling through a long list of available plugins is a simple way to discover what is within immediate reach. However, the list of essential plugins is relatively laconic for functioning applications. Searching for that one plugin in the list should not be a hefty task worthy of blocking your calendar.
The obvious question for any production environment is:
- How to remove unused native plugins from the Grafana installation package and, therefore, get rid of unwanted weight?
Grafana Customization
The customization topic is among the most frequently looked at and asked questions on the Grafana Forum.
In July last year, we produced a short video sharing our experience with customization using Docker containers. It explains the basics in 90 seconds.
In addition, we published a blog post with similar material How to customize the Grafana user interface.
Cheat-sheet
Months of work bundled with deep expertise nicely wrapped into a 7-minute long video revealing simple steps to customize Grafana. In this tutorial, we answered all community questions we collected to this moment.
Native Data Sources
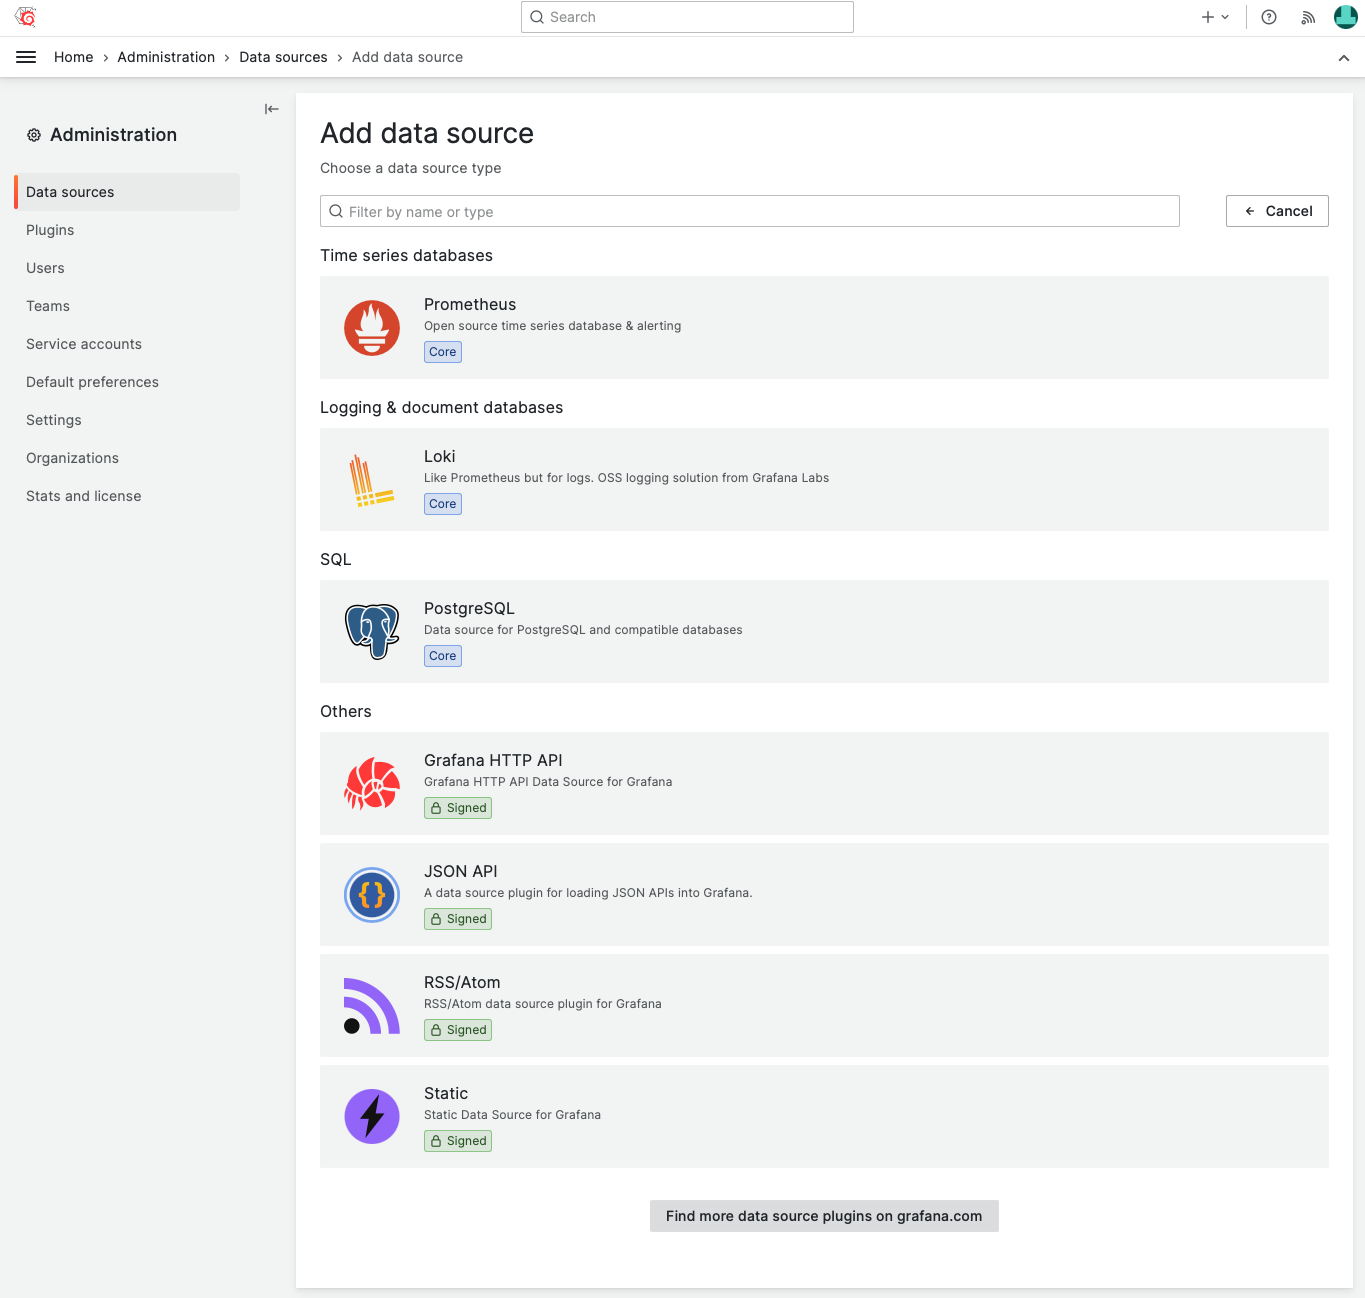
To add a new data source, go to Administration -> Data Sources and click "+ Add a new data source". Then scroll through the list, hoping to spot what you need.
As we mentioned, it is beneficial to limit the selection when you already know your environment. The list could go down to as few as 3-4 native data sources, plus some from the community. The result might look like a concise one-pager.
The downside to this approach is that deleted data sources can't be installed, and a new Docker image is required.
Here is the example from our Docker file, which removes all native data sources except Prometheus, Loki and PostgreSQL we use in our environment. Also, it drops Cloud and Enterprise hardcoded groups.
## Time series databases / Elasticsearch
RUN rm -rf /usr/share/grafana/public/app/plugins/datasource/elasticsearch
RUN rm -rf /usr/share/grafana/public/build/elasticsearch*

## Time series databases / Graphite
RUN rm -rf /usr/share/grafana/public/app/plugins/datasource/graphite
RUN rm -rf /usr/share/grafana/public/build/graphite*

## Time series databases / OpenTSDB
RUN rm -rf /usr/share/grafana/public/app/plugins/datasource/opentsdb
RUN rm -rf /usr/share/grafana/public/build/opentsdb*

## Time series databases / InfluxDB
RUN rm -rf /usr/share/grafana/public/app/plugins/datasource/influxdb
RUN rm -rf /usr/share/grafana/public/build/influxdb*

## SQL / Microsoft SQL Server
RUN rm -rf /usr/share/grafana/public/app/plugins/datasource/mssql
RUN rm -rf /usr/share/grafana/public/build/mssql*

## SQL / MySQL
RUN rm -rf /usr/share/grafana/public/app/plugins/datasource/mysql
RUN rm -rf /usr/share/grafana/public/build/mysql*

## Distributed tracing / Tempo
RUN rm -rf /usr/share/grafana/public/app/plugins/datasource/tempo
RUN rm -rf /usr/share/grafana/public/build/tempo*

## Distributed tracing / Jaeger
RUN rm -rf /usr/share/grafana/public/app/plugins/datasource/jaeger
RUN rm -rf /usr/share/grafana/public/build/jaeger*

## Distributed tracing / Zipkin
RUN rm -rf /usr/share/grafana/public/app/plugins/datasource/zipkin
RUN rm -rf /usr/share/grafana/public/build/zipkin*

## Cloud / Azure Monitor
RUN rm -rf /usr/share/grafana/public/app/plugins/datasource/grafana-azure-monitor-datasource
RUN rm -rf /usr/share/grafana/public/build/azureMonitor*

## Cloud / CloudWatch
RUN rm -rf /usr/share/grafana/public/app/plugins/datasource/cloudwatch
RUN rm -rf /usr/share/grafana/public/build/cloudwatch*

## Cloud / Google Cloud Monitoring
RUN rm -rf /usr/share/grafana/public/app/plugins/datasource/cloud-monitoring
RUN rm -rf /usr/share/grafana/public/build/cloudMonitoring*

## Profiling / Parca
RUN rm -rf /usr/share/grafana/public/app/plugins/datasource/parca
RUN rm -rf /usr/share/grafana/public/build/parca*

## Profiling / Phlare
RUN rm -rf /usr/share/grafana/public/app/plugins/datasource/phlare
RUN rm -rf /usr/share/grafana/public/build/phlare*

## Others / Alertmanager
RUN rm -rf /usr/share/grafana/public/app/plugins/datasource/alertmanager
RUN rm -rf /usr/share/grafana/public/build/alertmanager*

## Others / TestData
RUN rm -rf /usr/share/grafana/public/app/plugins/datasource/testdata
RUN rm -rf /usr/share/grafana/public/build/testData*

## Remove Cloud and Enterprise categories
RUN find /usr/share/grafana/public/build/ -name *.js -exec sed -i 's|e.id==="enterprise"|e.id==="notanenterprise"|g' {} \;
RUN find /usr/share/grafana/public/build/ -name *.js -exec sed -i 's|e.id==="cloud"|e.id==="notacloud"|g' {} \;
Native panels
In some of our projects, we do not use Annotation List, Dashboard List, News, Candlestick, Node Graph, and Traces. Narrowing down the selection to work with is a simple and elegant idea.
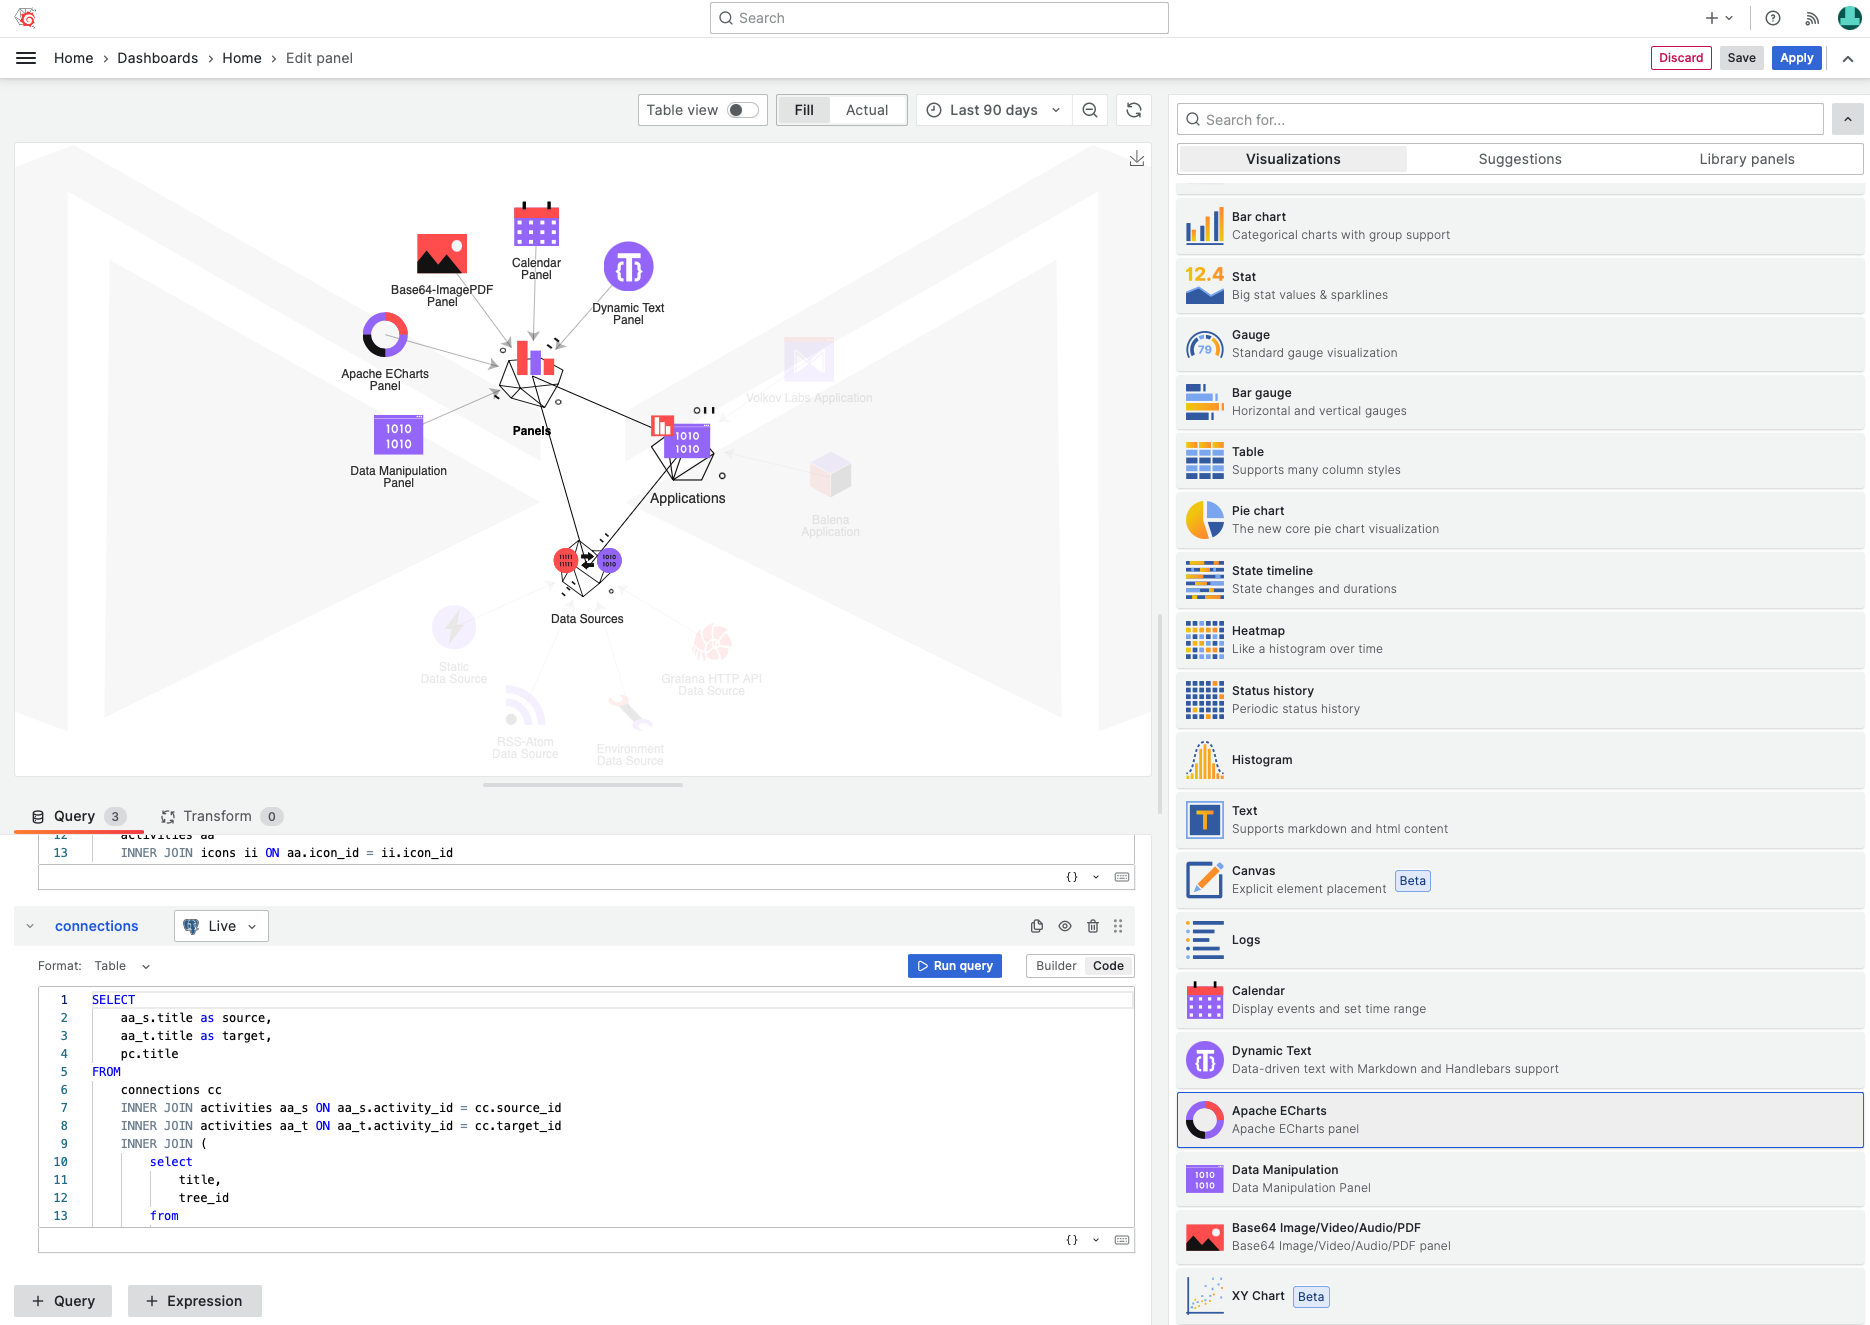
You can pick and choose native panels using the same concepts.
## Alert list
RUN rm -rf /usr/share/grafana/public/app/plugins/panel/alertlist

## Annotations list
RUN rm -rf /usr/share/grafana/public/app/plugins/panel/annolist

## Dashboard list
RUN rm -rf /usr/share/grafana/public/app/plugins/panel/dashlist

## News
RUN rm -rf /usr/share/grafana/public/app/plugins/panel/news

## Geomap
RUN rm -rf /usr/share/grafana/public/app/plugins/panel/geomap

## Table (old)
RUN rm -rf /usr/share/grafana/public/app/plugins/panel/table-old

## Traces
RUN rm -rf /usr/share/grafana/public/app/plugins/panel/traces

## Candlestick
RUN rm -rf /usr/share/grafana/public/app/plugins/panel/candlestick

## Node Graph
RUN rm -rf /usr/share/grafana/public/app/plugins/panel/nodeGraph
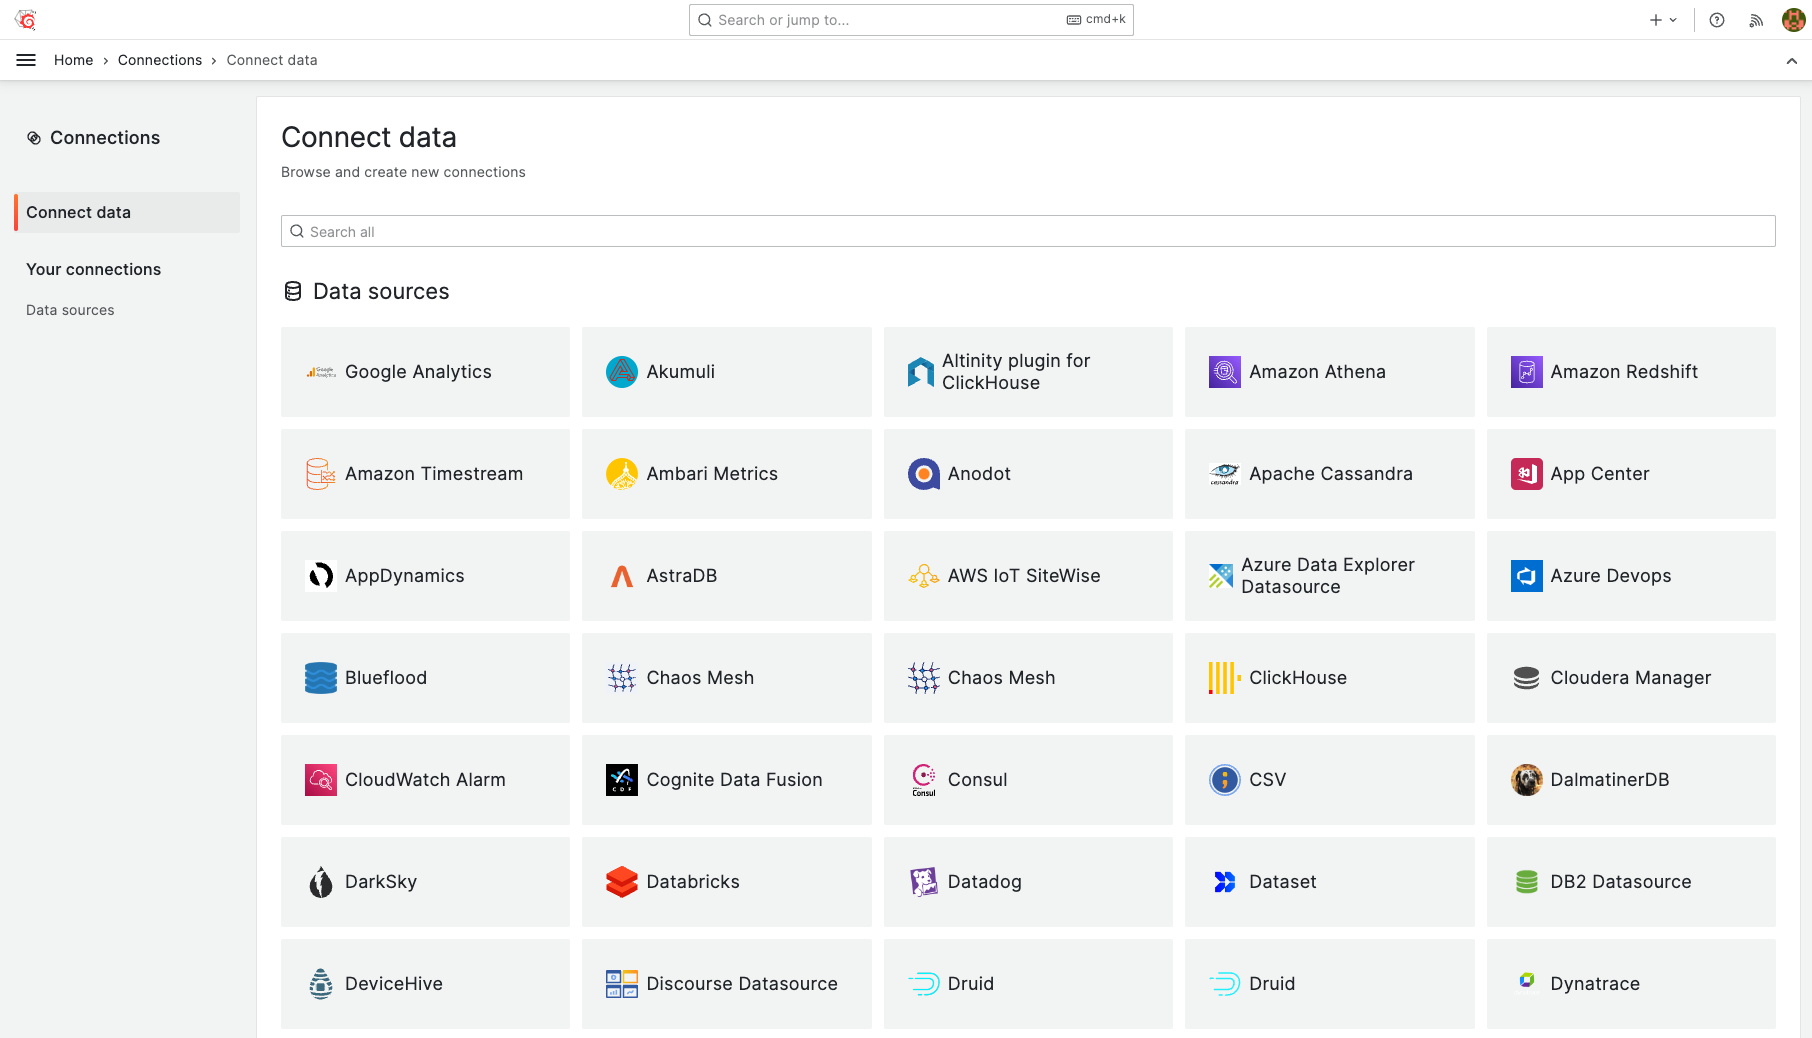
Connections
Grafana 9.5.0 introduced Connections as a new and easier way to install and add Data Sources.
It's an interesting feature to explore various data sources, but we already know what we need and disable it in the configuration file.
# Disable Connections
RUN sed -i 's|# feature2 = false|dataConnectionsConsole = false|g' /usr/share/grafana/conf/defaults.ini
Docker file
The docker file below includes all Grafana customization instructions as they exist now. That means all we mentioned in the previous blog post and the 90 seconds video are included below.
We keep the docker file updated to the latest version of Grafana.
You can find our collection of various customizations in the Docker file on GitHub. Thank you to the community for sharing ideas and helping us to improve the list.
loading...
Rest assured that we constantly update the list with all the latest configuration commands we can identify.
Let’s Stay Connected!
Join the Conversation: Stay updated and share your thoughts! Subscribe to our YouTube Channel and leave your comments—we can’t wait to hear what you think.
Your input helps us improve, so don’t hesitate to get in touch!