Provisioning in Grafana
Provisioning is one step up from the primary Grafana mindset. It is optional, but I recommend investing some time in researching this topic since harnessing it will bring you smooth and speedy deployments.
What is provisioning
Simply put, provisioning is when you push configuration via JSON, YAML, and other files into a Grafana instance. In Grafana 9.5.1, you can push configuration for:
- RBAC (role-based access control)
- Alerting rules
- Dashboards
- Data sources
- Alert notifies
- Plugins (applications)
Since Grafana comprises many independent parts, what components can be provisioned might be confusing. The general rule of thumb is you can provision configurations. You must install all data sources and visualization panels outside the provisioning processes.
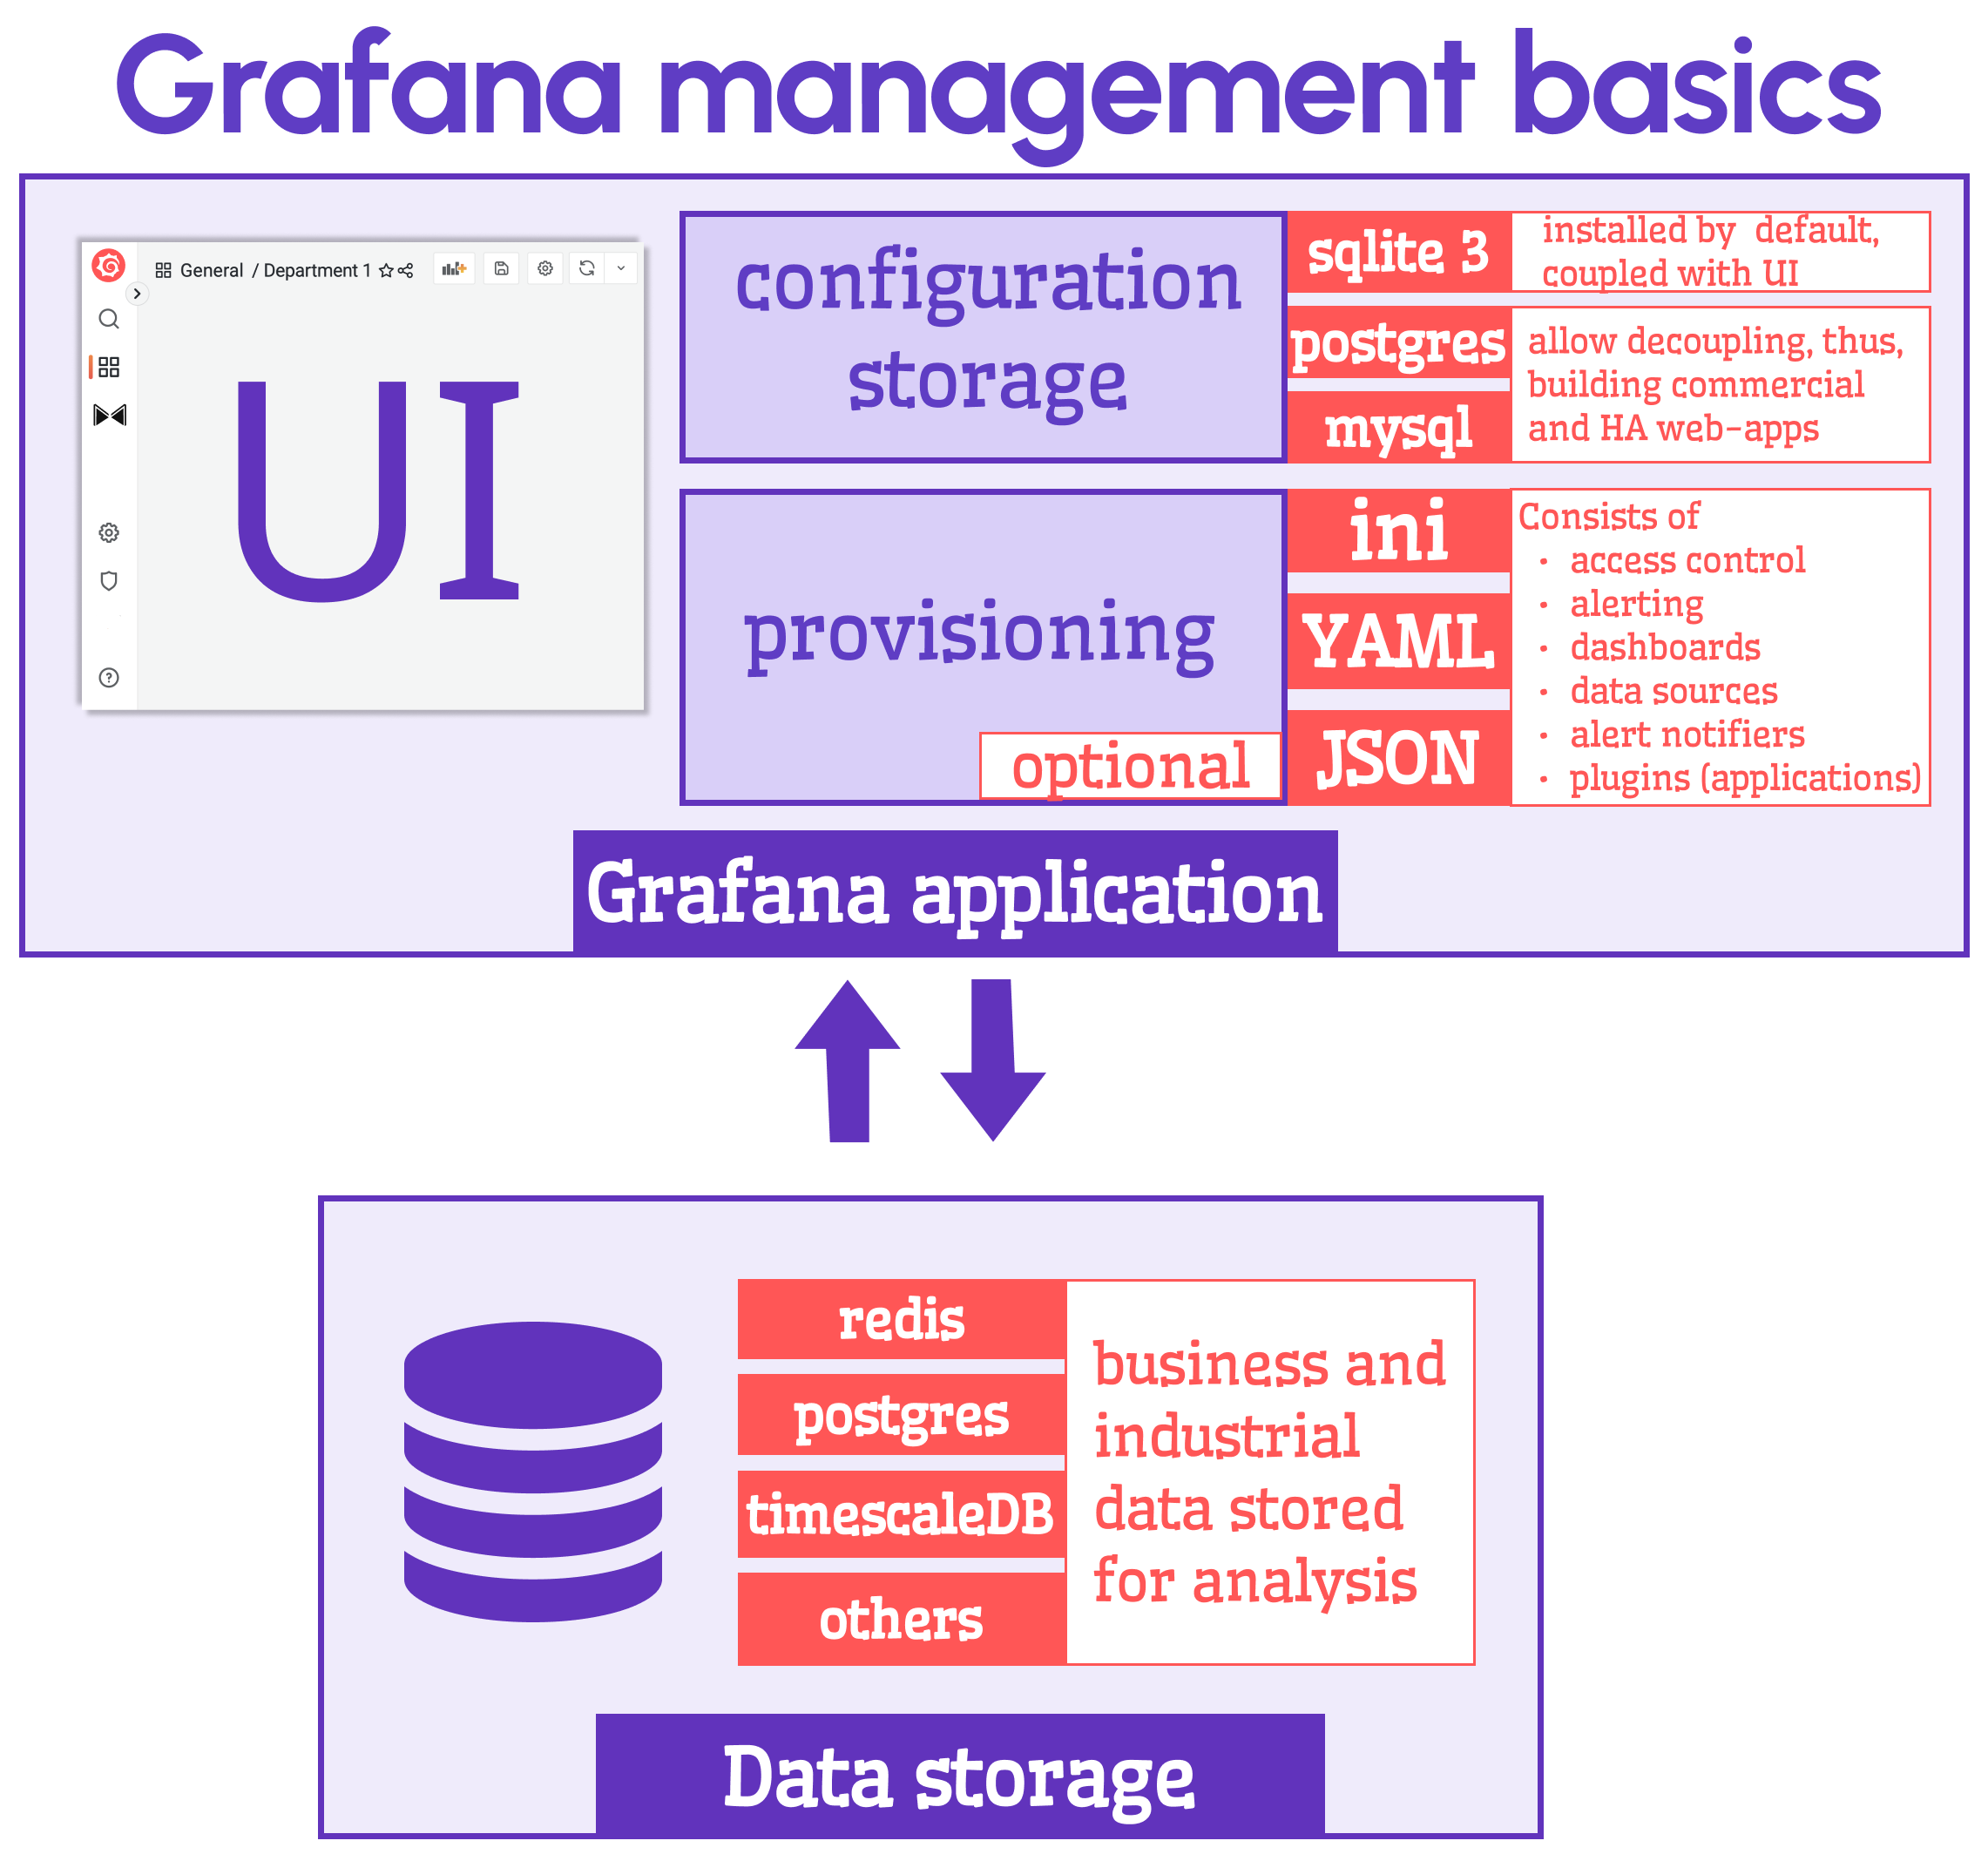
Explained in a nutshell
In most cases, provisioning is used to update production environments to subsequent versions.
- You make all necessary changes in the development environment.
- Prepare provision files based on changes.
- Place updated configuration into the corresponding folders.
After restarting all involved in the upgrade production Grafana instances, all changes are in place. If you need to get back to the previous state(version), remove the new files and use the old ones instead. Version control is one of the provisioning advantages.
Below is the link to my YouTube video, where I explain provisioning and demonstrate some examples.
Alternatives
Grafana UI
There are two alternatives to provisioning. You can log in to every Grafana instance that needs to be updated and perform all modifications using UI. That does not sound productive, and I agree. This method is slow, prone to errors, and not scalable. Consider this method in the early stages of adopting Grafana.
HTTP API
The other method includes using HTTP API endpoints. Grafana provides a variety of API functions to work with its configuration. This method is the only choice in environments without access to the file system (for example, cloud).
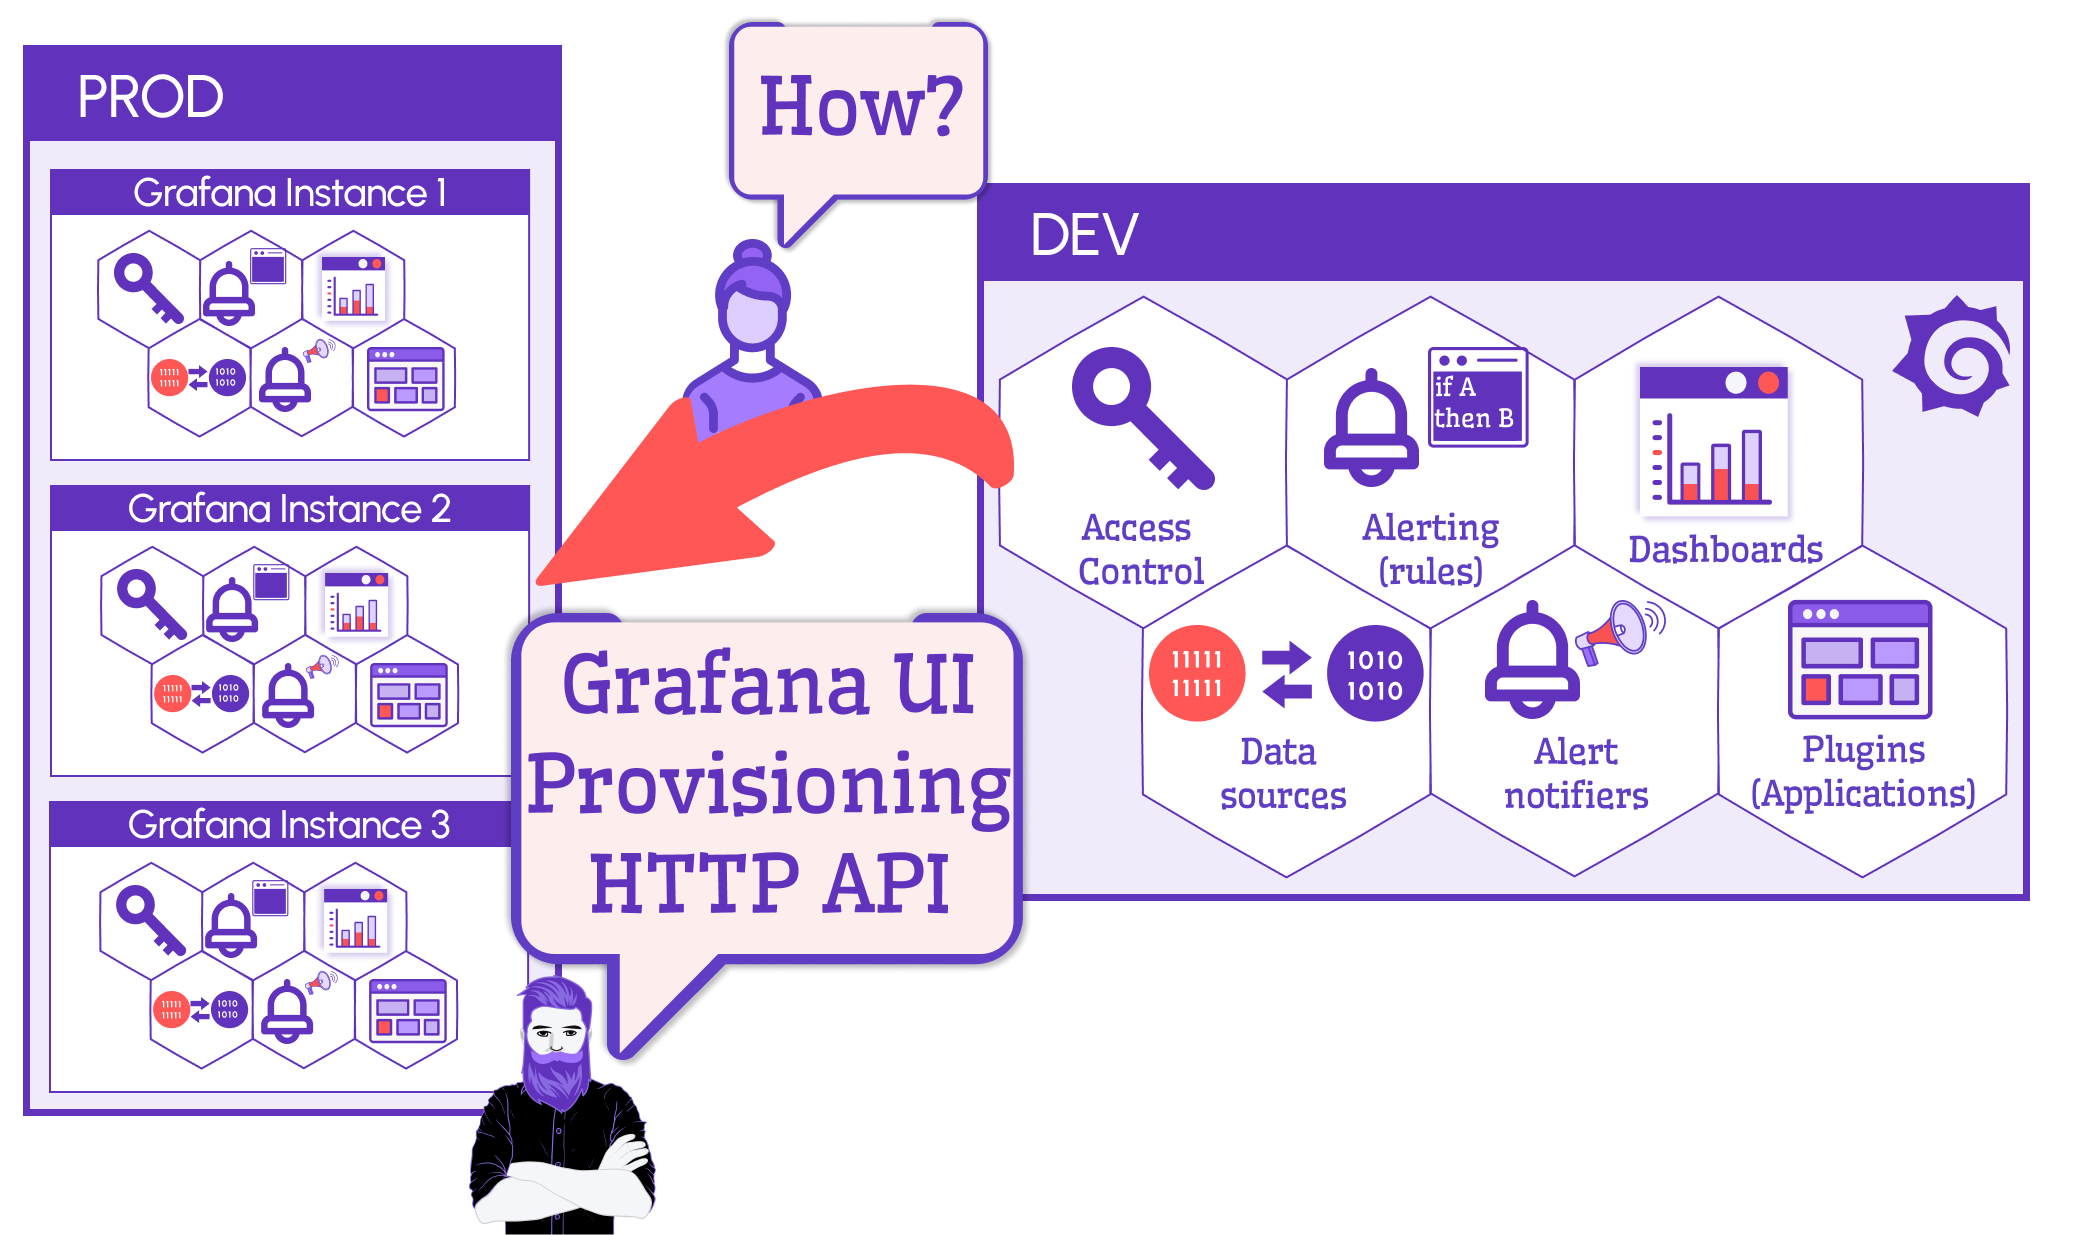
Getting started
To get a good first glimpse of provisioning, find the provisioning folder under the conf directory. Grafana 9.5.1 contains six subfolders, each representing a Grafana component you can provision.
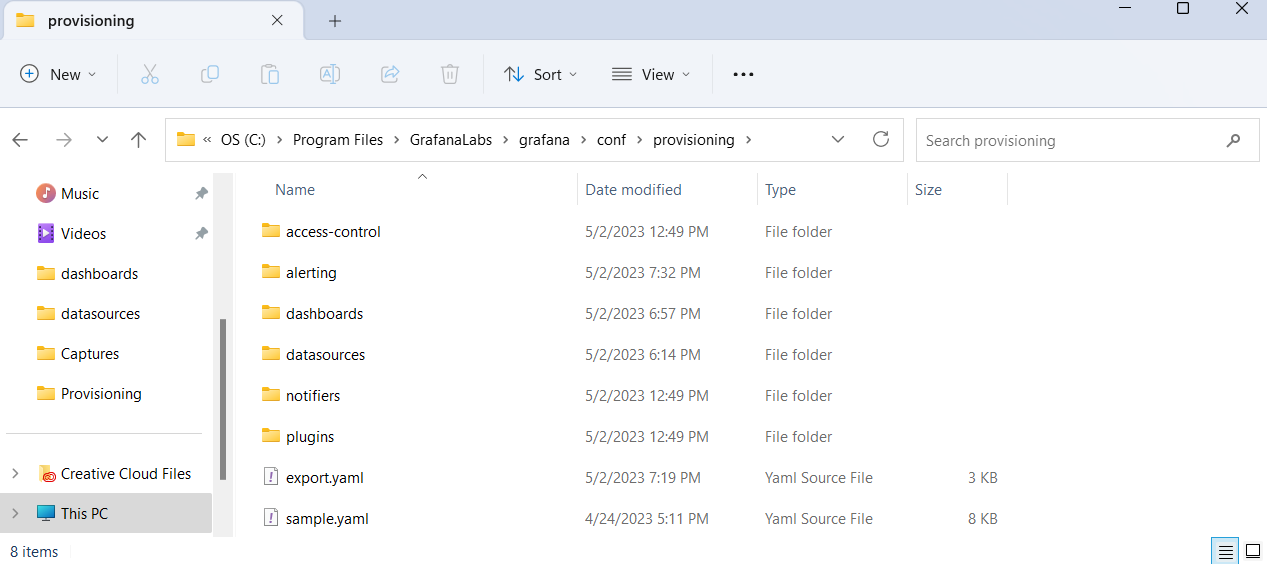
You can find a sample.yaml file in every subfolder, except for alerting. The files are provided as a starter, but I find them too generic and semi-useful. I hope your more profound experience leaves you with an opposite impression.
Do not let the file name 'sample' mislead you. Grafana checks for all YAML files regardless of their names.
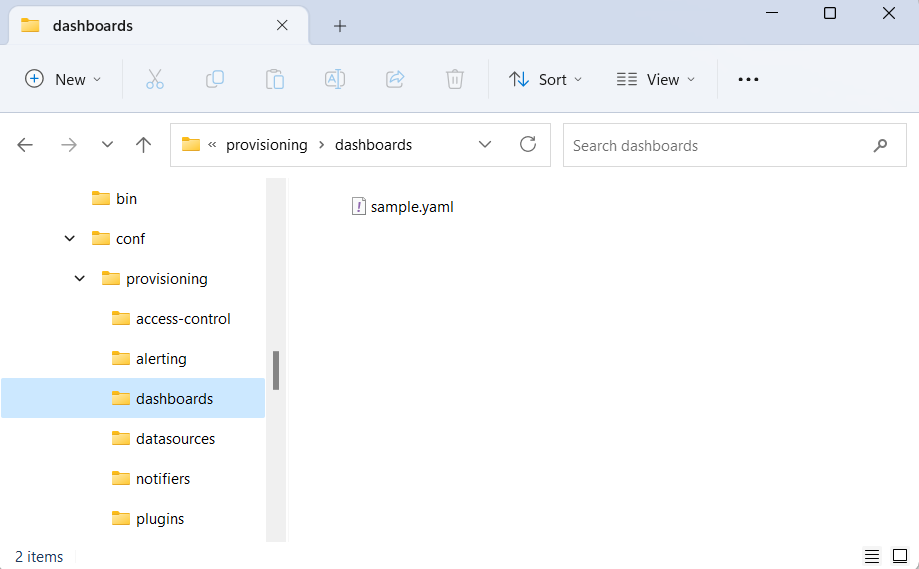
By default, the provisioned dashboards are protected from any modifications made by users in UI. You can change that by using the allowUpdates parameter being set to true.
Dashboard
For provisioning a dashboard at minimum expect to have two files. One with the yaml extension and the other one with json extension.
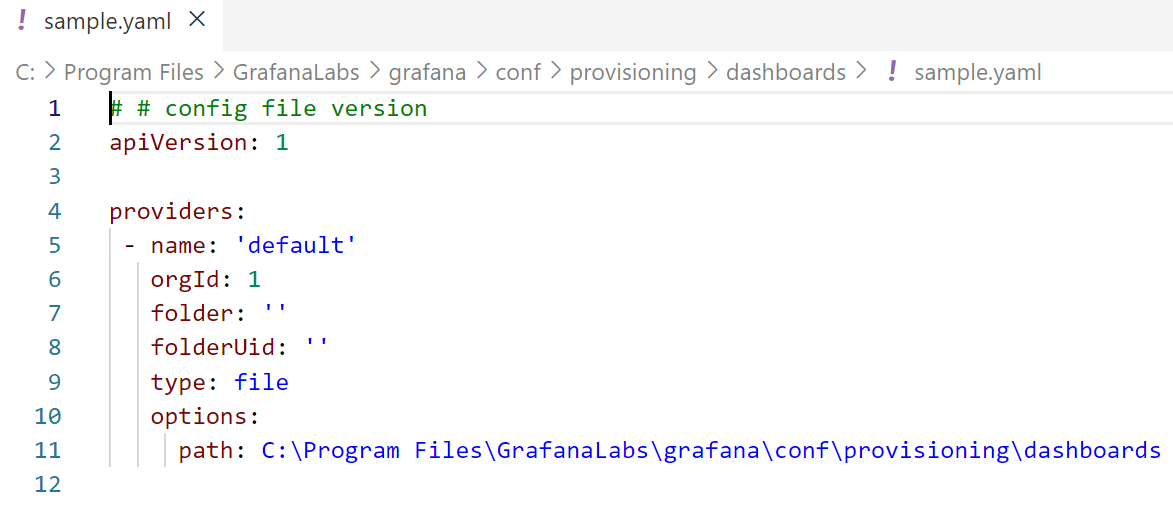
The path option is where Grafana will look for dashboard JSON file descriptions. The folder is the corresponding folder in the Grafana UI.
Export
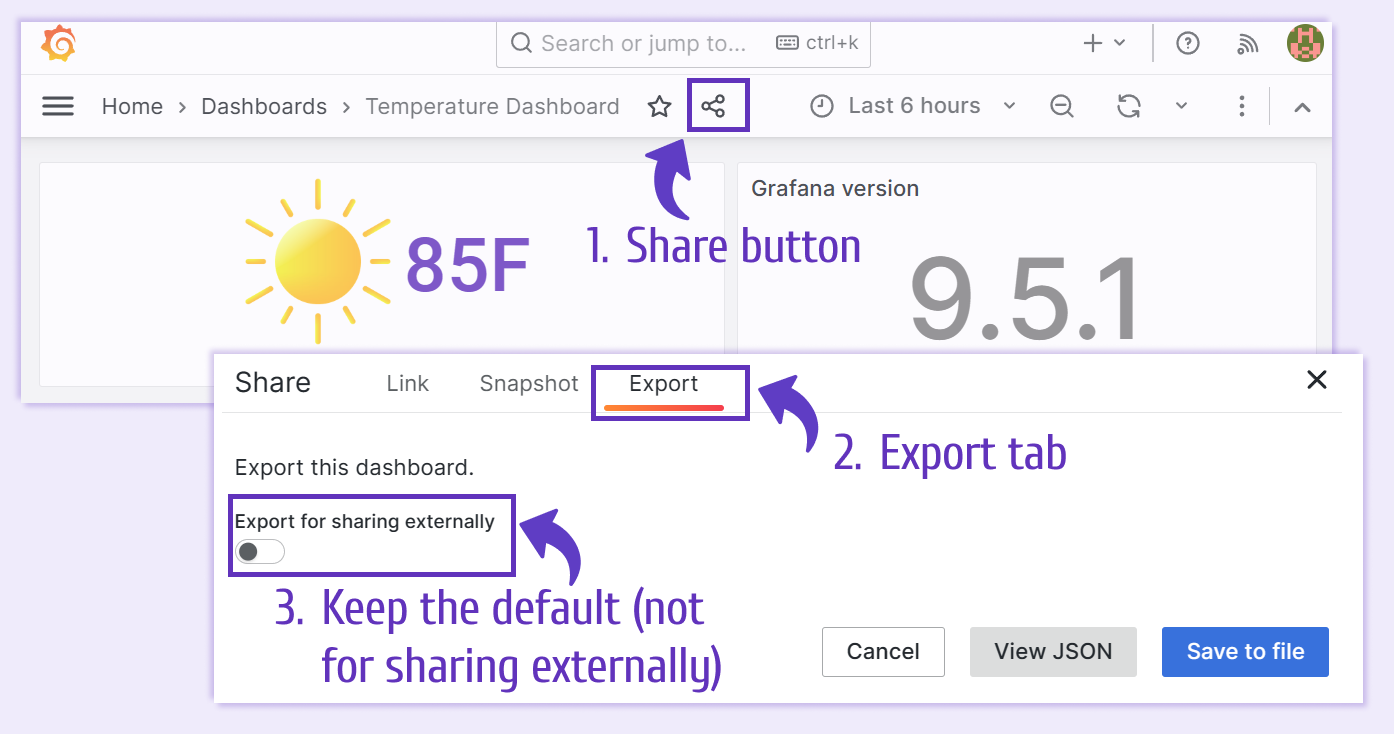
The easiest way to have a dashboard in a JSON file is to create a dashboard in one of the Grafana instances and then use the 'Export' functionality.
You can export for sharing externally with either YES or NO. The difference is for the external export all unique identifiers are going to be replaced with a variable. Those JSON files are good when you use Import functionality in UI.
For provisioning leave the default value for Export for sharing externally unchecked.
Data sources
You only can provision a data source if it already has been installed as a plugin.
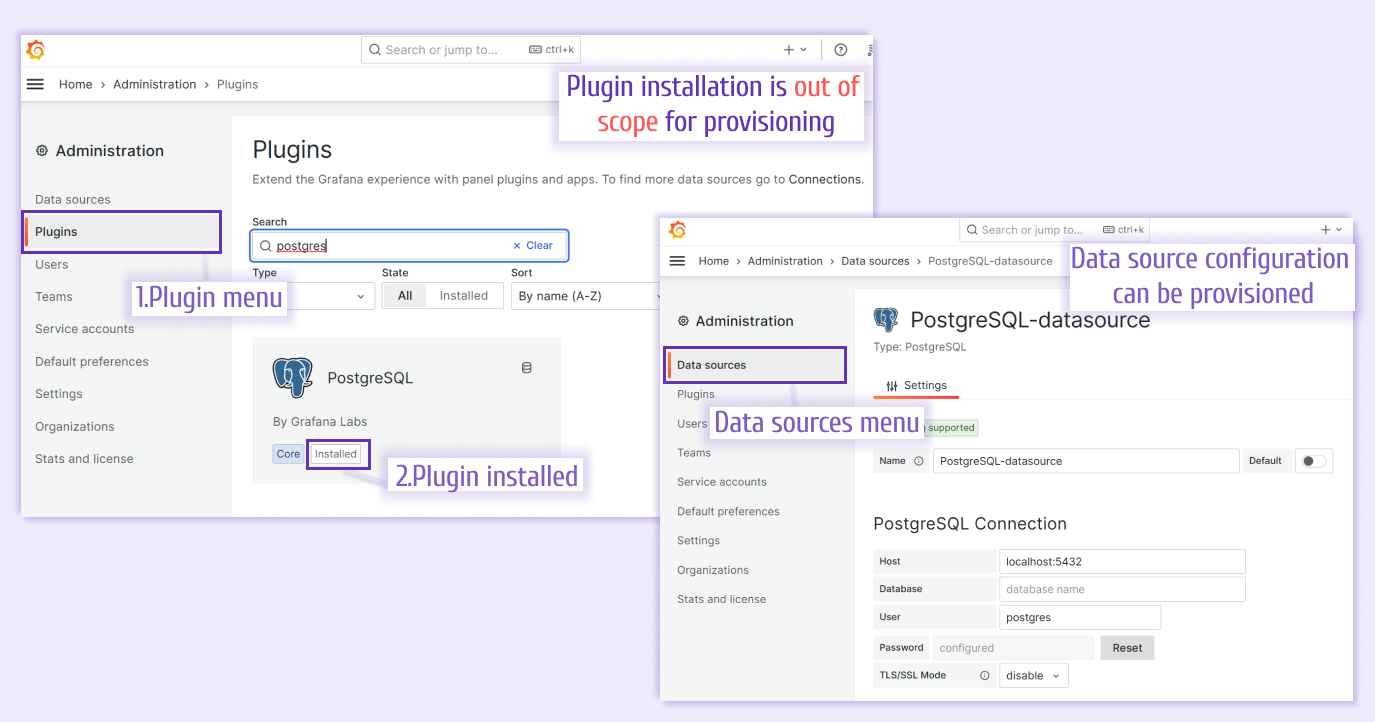
Unfortunately and surprisingly, there is no UI functionality for exporting a data source configuration. You must create a YAML file for your data source from scratch.
This not-so-exciting fact leads to a sorrowful conclusion. There is no one solid approach to having such a file. I can share what we use for the PostgreSQL data source.
apiVersion: 1

datasources:
  - name: Business Satellite
    type: volkovlabs-grapi-datasource
    access: proxy
    uid: grapi
    orgId: 1
    version: 1
    editable: true
    jsonData:
      url: http://localhost:3000
  - name: Timescale
    type: postgres
    access: proxy
    uid: timescale
    orgId: 1
    version: 1
    editable: true
    url: host.docker.internal:5432
    user: postgres
    jsonData:
      postgresVersion: 1200
      sslmode: disable
    secureJsonData:
      password: postgres
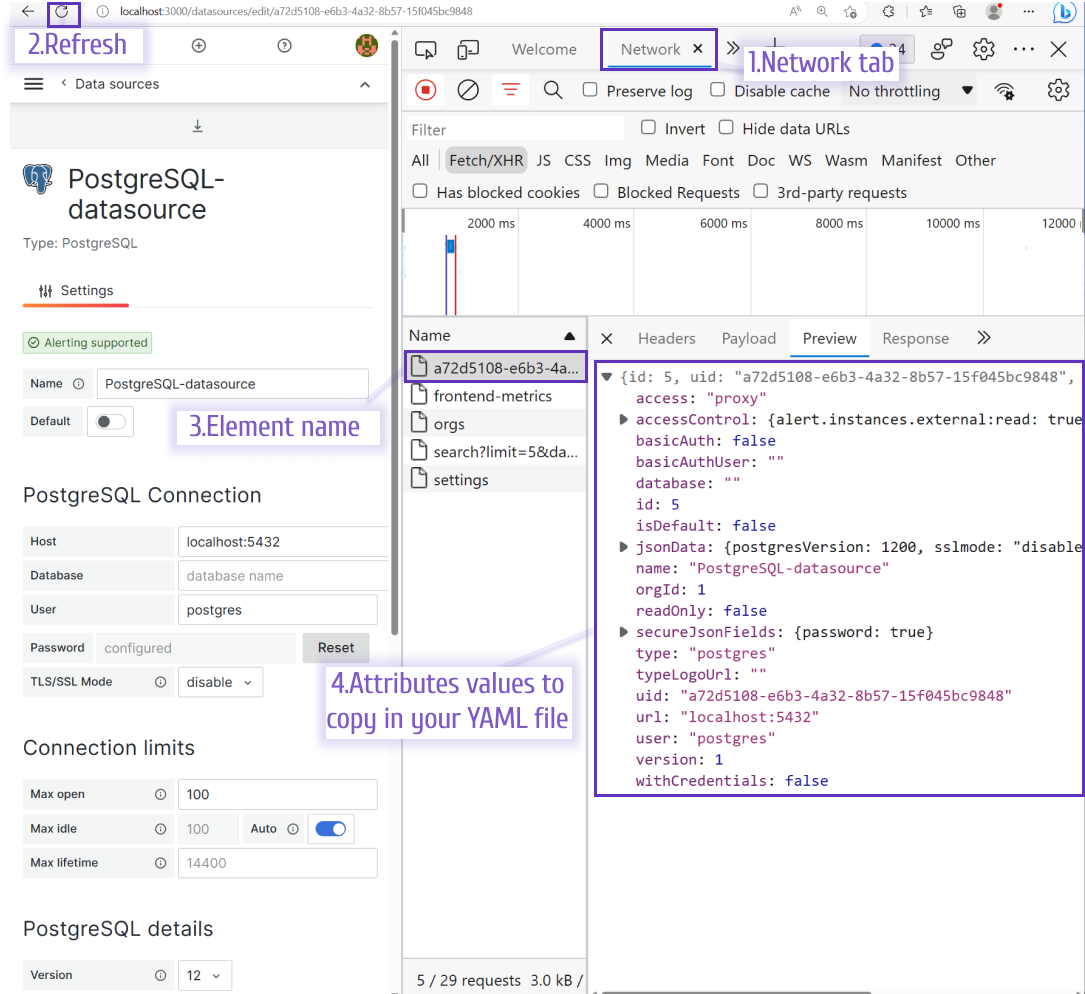
For all others, go into the 'Inspect' menu of your browser and then look at the Network tab. If nothing is shown, try to refresh the page.
Alert rule
Provisioning an alert rule should feel like a warm, gentle breeze if you are resourceful and persistent enough to get through the provisioning of a data source puzzle. After you create an alert rule, simply use the export button.
The export process has no parameters, and the file name is always the same - export.yaml. In case of multiple rules, you must rename each file according to your logic. That is the only hurdle in your provision of an alert path.
Examples
If you are like me, you prefer examples to theoretical templates. In that case, you are welcome to our GitHub organization, where you can find many sound actual provisioning files. We use them for developing and testing our maintained plugins.
The concept of Provisioning allows isolating the core Grafana from the numerous features that could be added and configured separately.
The particular beauty of such architecture shines in a robust version control process. However, there is no one industry-accepted best way of performing Provisioning. You will have to make many decisions on your own, conduct research and explore the try-and-error route.


