Building a Scalable BI Solution with Grafana: Managing Hundreds of Alerts


In today’s data-driven landscape, delivering actionable insights to clients is paramount. Picture Alex Carter, a Data Analyst tasked with deploying a Business Intelligence (BI) platform using Grafana, where each external client receives a dedicated instance to monitor critical key performance indicators (KPIs).
This post dives into Alex’s journey, introduces the key personas involved, addresses the challenge of managing hundreds of alerts across multiple instances, and showcases how Business Studio from the Business Intelligence platform transforms this setup with powerful alerting and load balancing capabilities.
The Project: A Dedicated Grafana for Every Client
Alex, a seasoned BI Developer at a mid-sized tech firm, spearheads a project to provide customized dashboards for external clients—think e-commerce retailers or logistics companies. Each client receives a dedicated Grafana instance to track KPIs like sales performance, delivery times, or application uptime.
While this multi-instance model ensures data isolation and tailored experiences, it introduces significant challenges in scaling and alert management as the client base grows.
Meet the Key Personas
-
Alex Carter (Data Analyst/BI Developer)
- Experience: 5+ years with Grafana, SQL, and Python.
- Goal: Build scalable dashboards and alerts with minimal overhead.
- Challenge: Juggling multiple instances, handling large datasets, and supporting non-technical users.
-
Sarah Mitchell (Business Operations Manager)
- Role: Internal user tracking operational KPIs.
- Need: Simple alerts like “inventory < 100 units.”
- Challenge: Struggles with Grafana’s technical interface and relies on Alex for support.
-
Raj Patel (Regional Sales Manager)
- Role: External client monitoring sales KPIs.
- Need: Custom alerts like “sales < $5K.”
- Challenge: Finds Grafana’s alert setup intimidating as a non-technical user.
Discover more about these personas in our documentation.
The Challenge: Managing Hundreds of Alerts at Scale
Alex’s setup includes:
- Dashboards: Customized for each client (e.g., sales trends for Client A, uptime for Client B) using Grafana’s templating and panels.
- Data Sources: Diverse, ranging from SQL databases to Prometheus and BigQuery, connected to each instance.
- Alerts: Client-specific rules (e.g., “revenue < $10K” for Client A), delivered via Slack, SMS, or email.
- Scale: Dozens of instances, with hundreds of alerts as the client count rises.
The primary obstacles are:
- Scalability: Configuring and monitoring hundreds of alerts across multiple Grafana instances is a logistical nightmare.
- Performance: Large datasets (e.g., 10M rows) strain resources, slowing down dashboards and alert evaluations.
- User Autonomy: Non-technical clients like Raj want to manage their own alerts but lack the expertise for Grafana’s query-driven system.
Solution: Business Studio to the Rescue
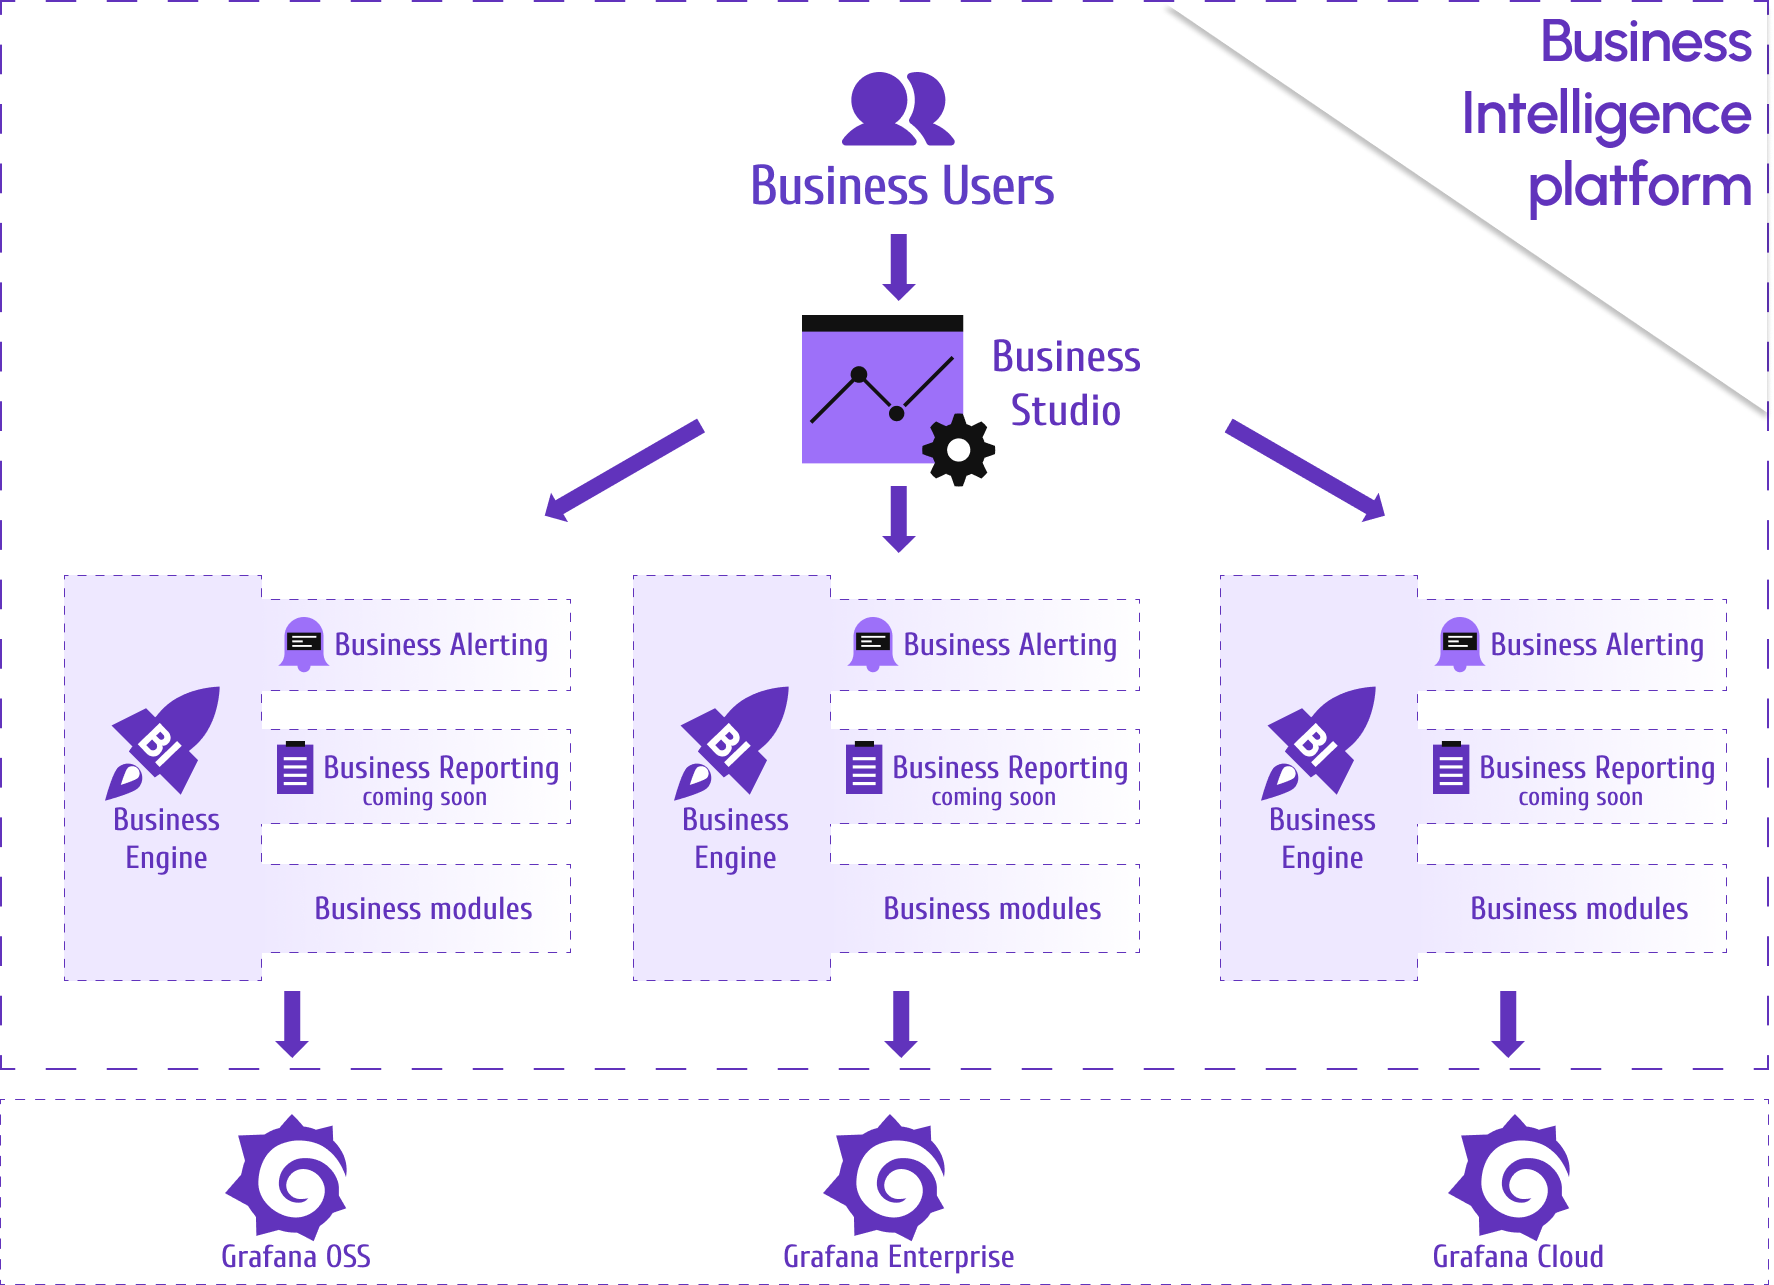
Enter Business Studio, paired with the Business Engine, a game-changing addition to Alex’s toolkit. Developed by Volkov Labs, this platform integrates seamlessly with Grafana to provide advanced alerting, load balancing, and a user-friendly interface. The latest releases, Business Intelligence version 3, is tailored to address Alex’s exact needs.
How Business Studio Transforms Alex’s Workflow
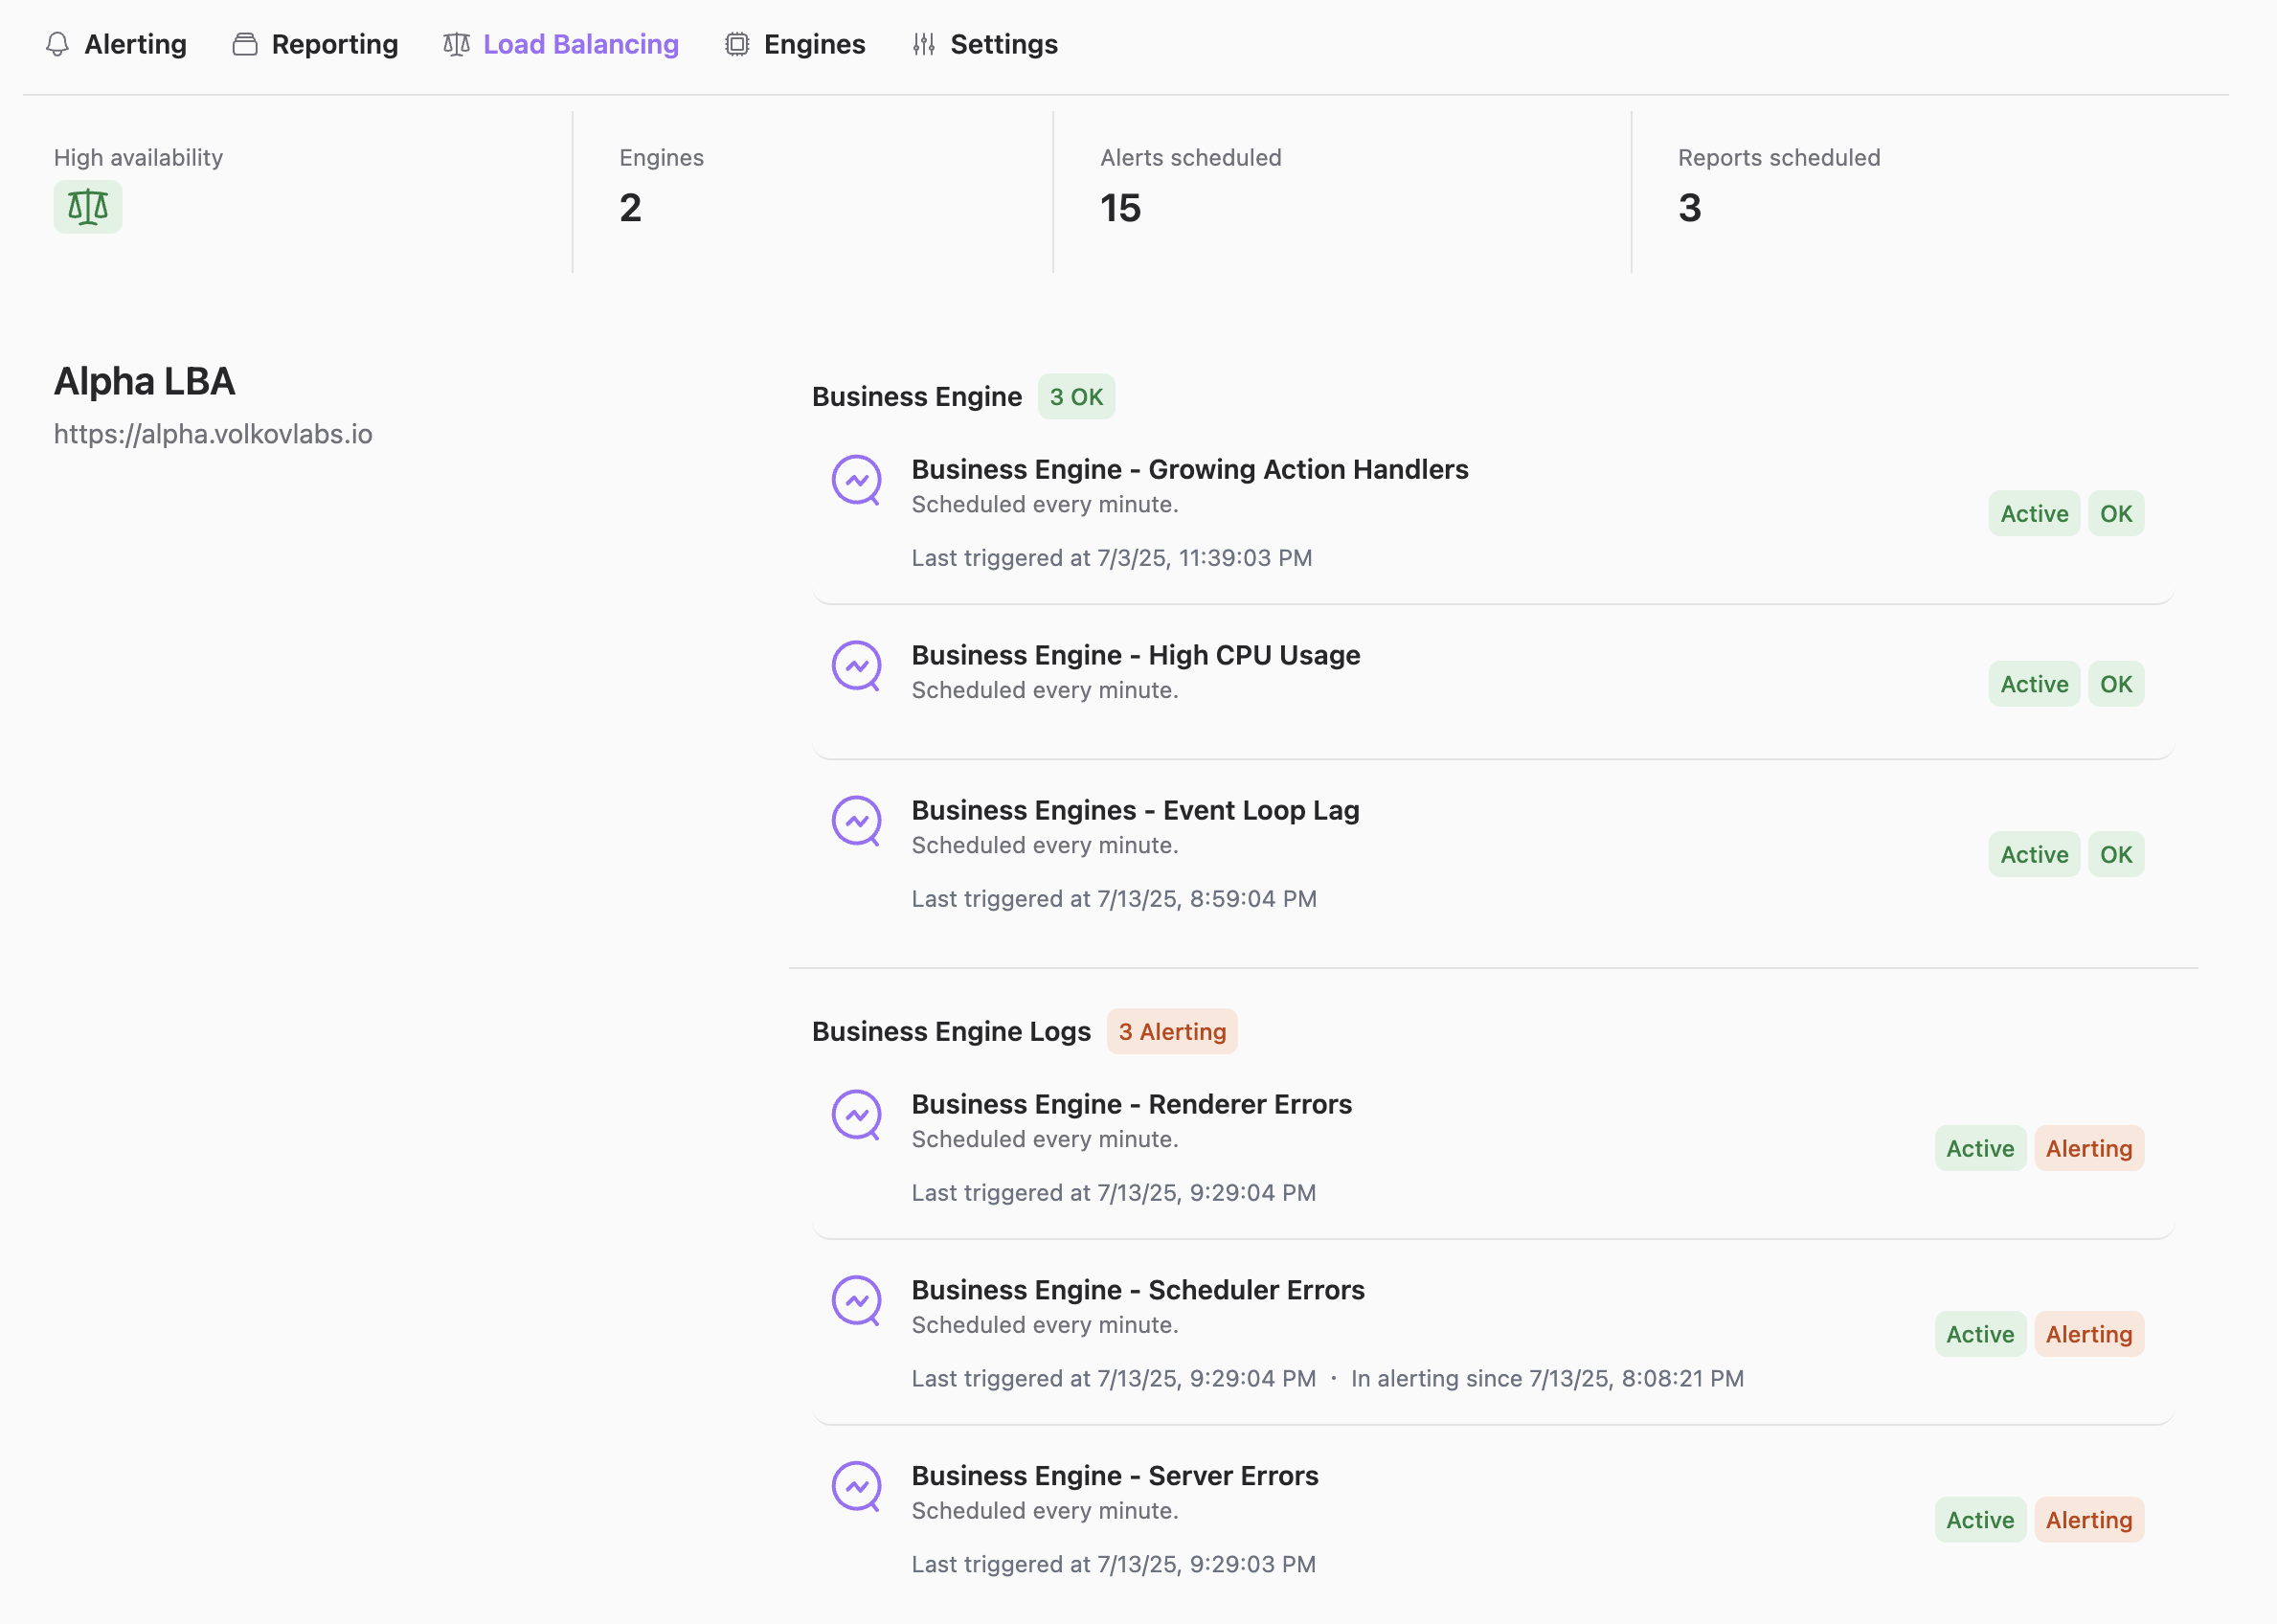
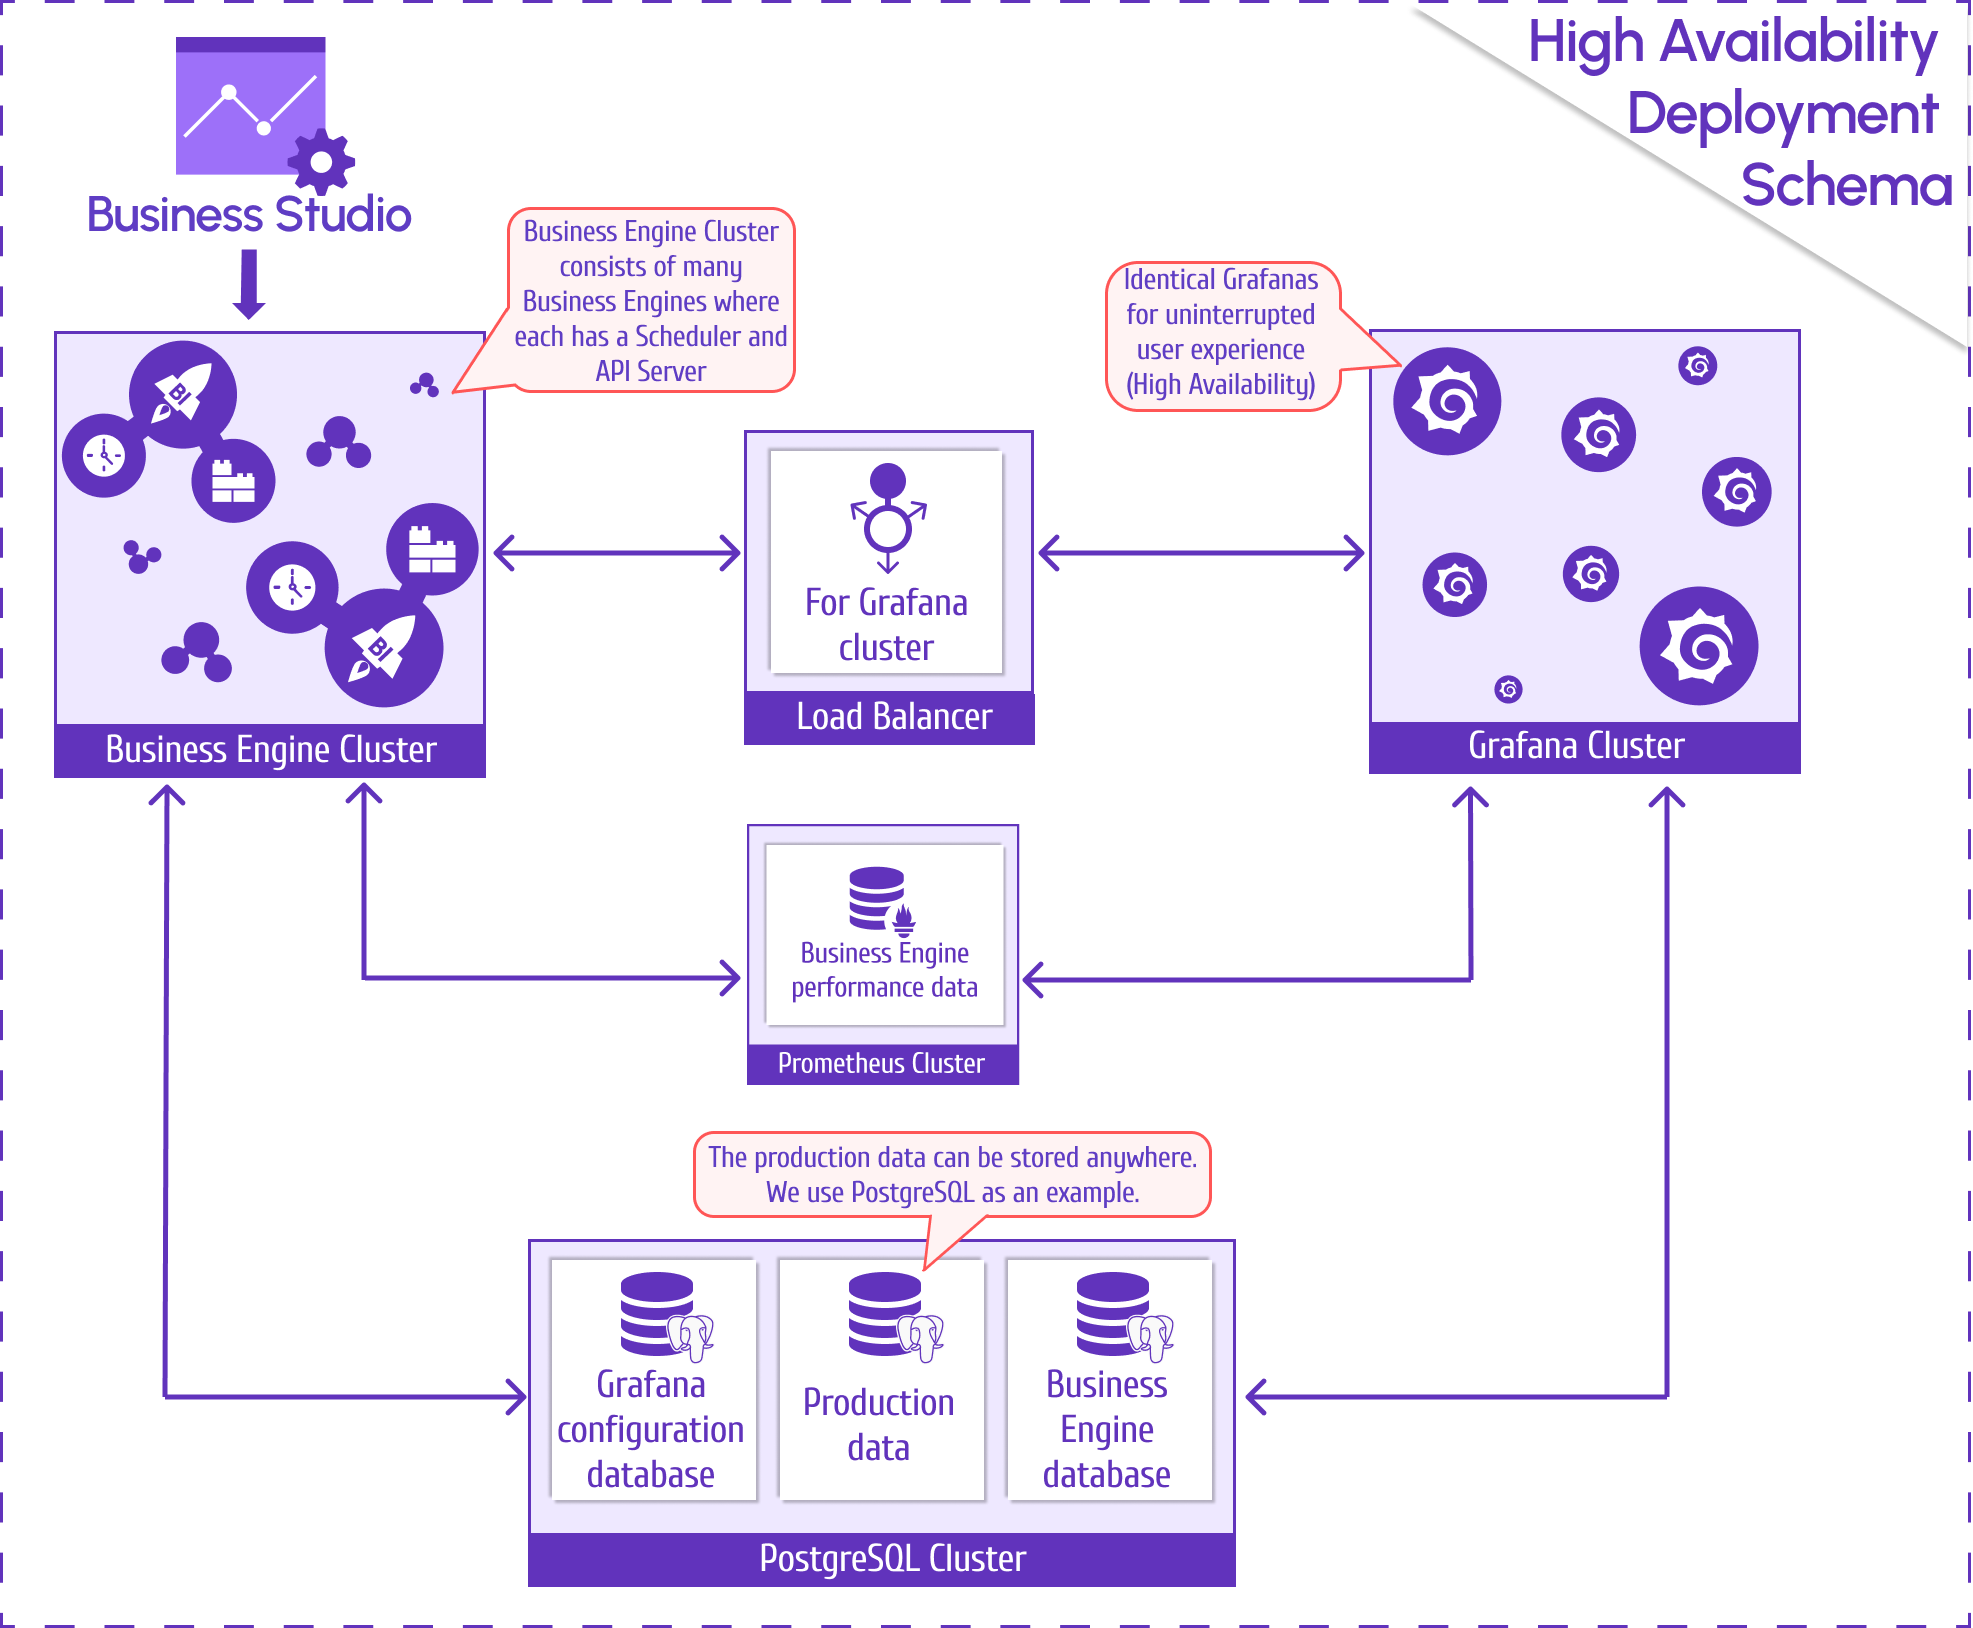
- Effortless Scalability with Load Balancing
- Feature: Business Studio’s cluster of Business Engines distributes hundreds of alert rules across engines via a dedicated load balancing page.
- Impact: Alex scales to 50+ clients effortlessly, with each engine managing ~20 alerts. Adding new instances becomes a breeze with balanced workloads.
-
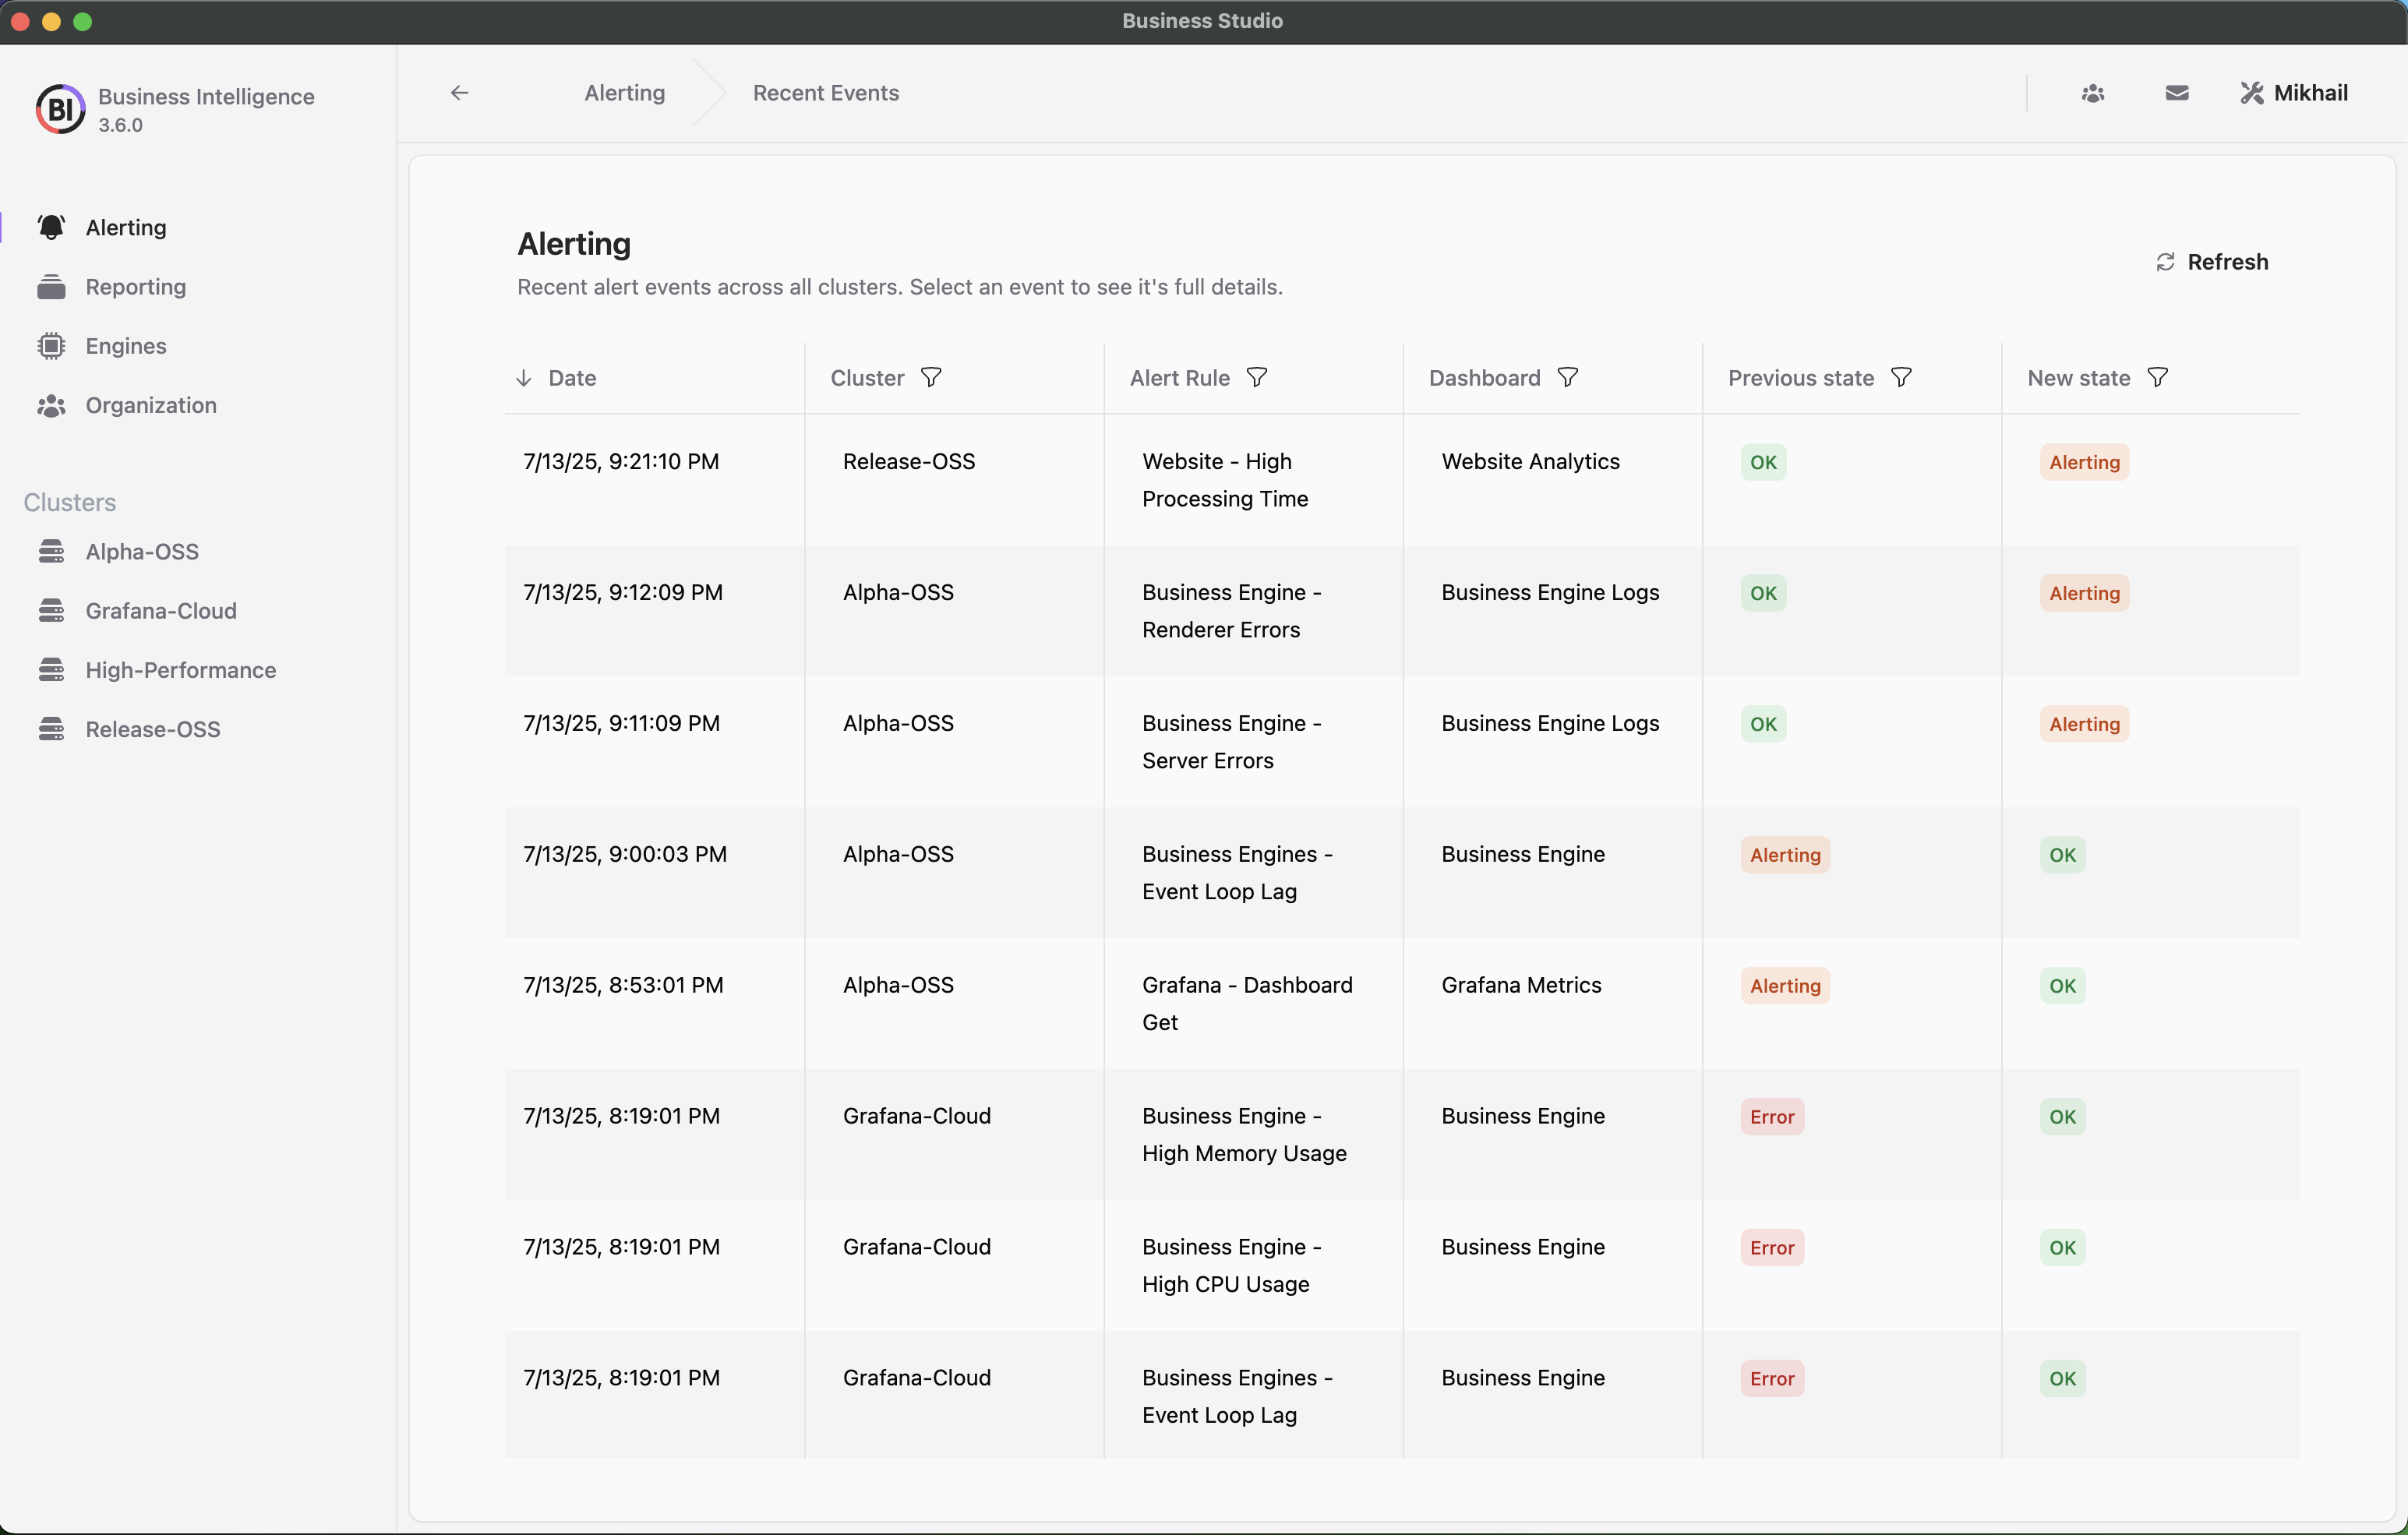
Streamlined Alert Management
- Feature: The Business Engine cluster processes hundreds of alerts concurrently, optimized for high volume rather than individual speed.
- Impact: Alerts execute reliably across the cluster, preventing overload on Grafana data sources.

- Unmatched Reliability with High Availability
- Feature: High Availability (HA) clusters and action history ensure consistent alert execution, even if an engine fails.
- Impact: A client’s critical uptime alert fires without fail among hundreds of rules, reaching Slack seamlessly and building trust.
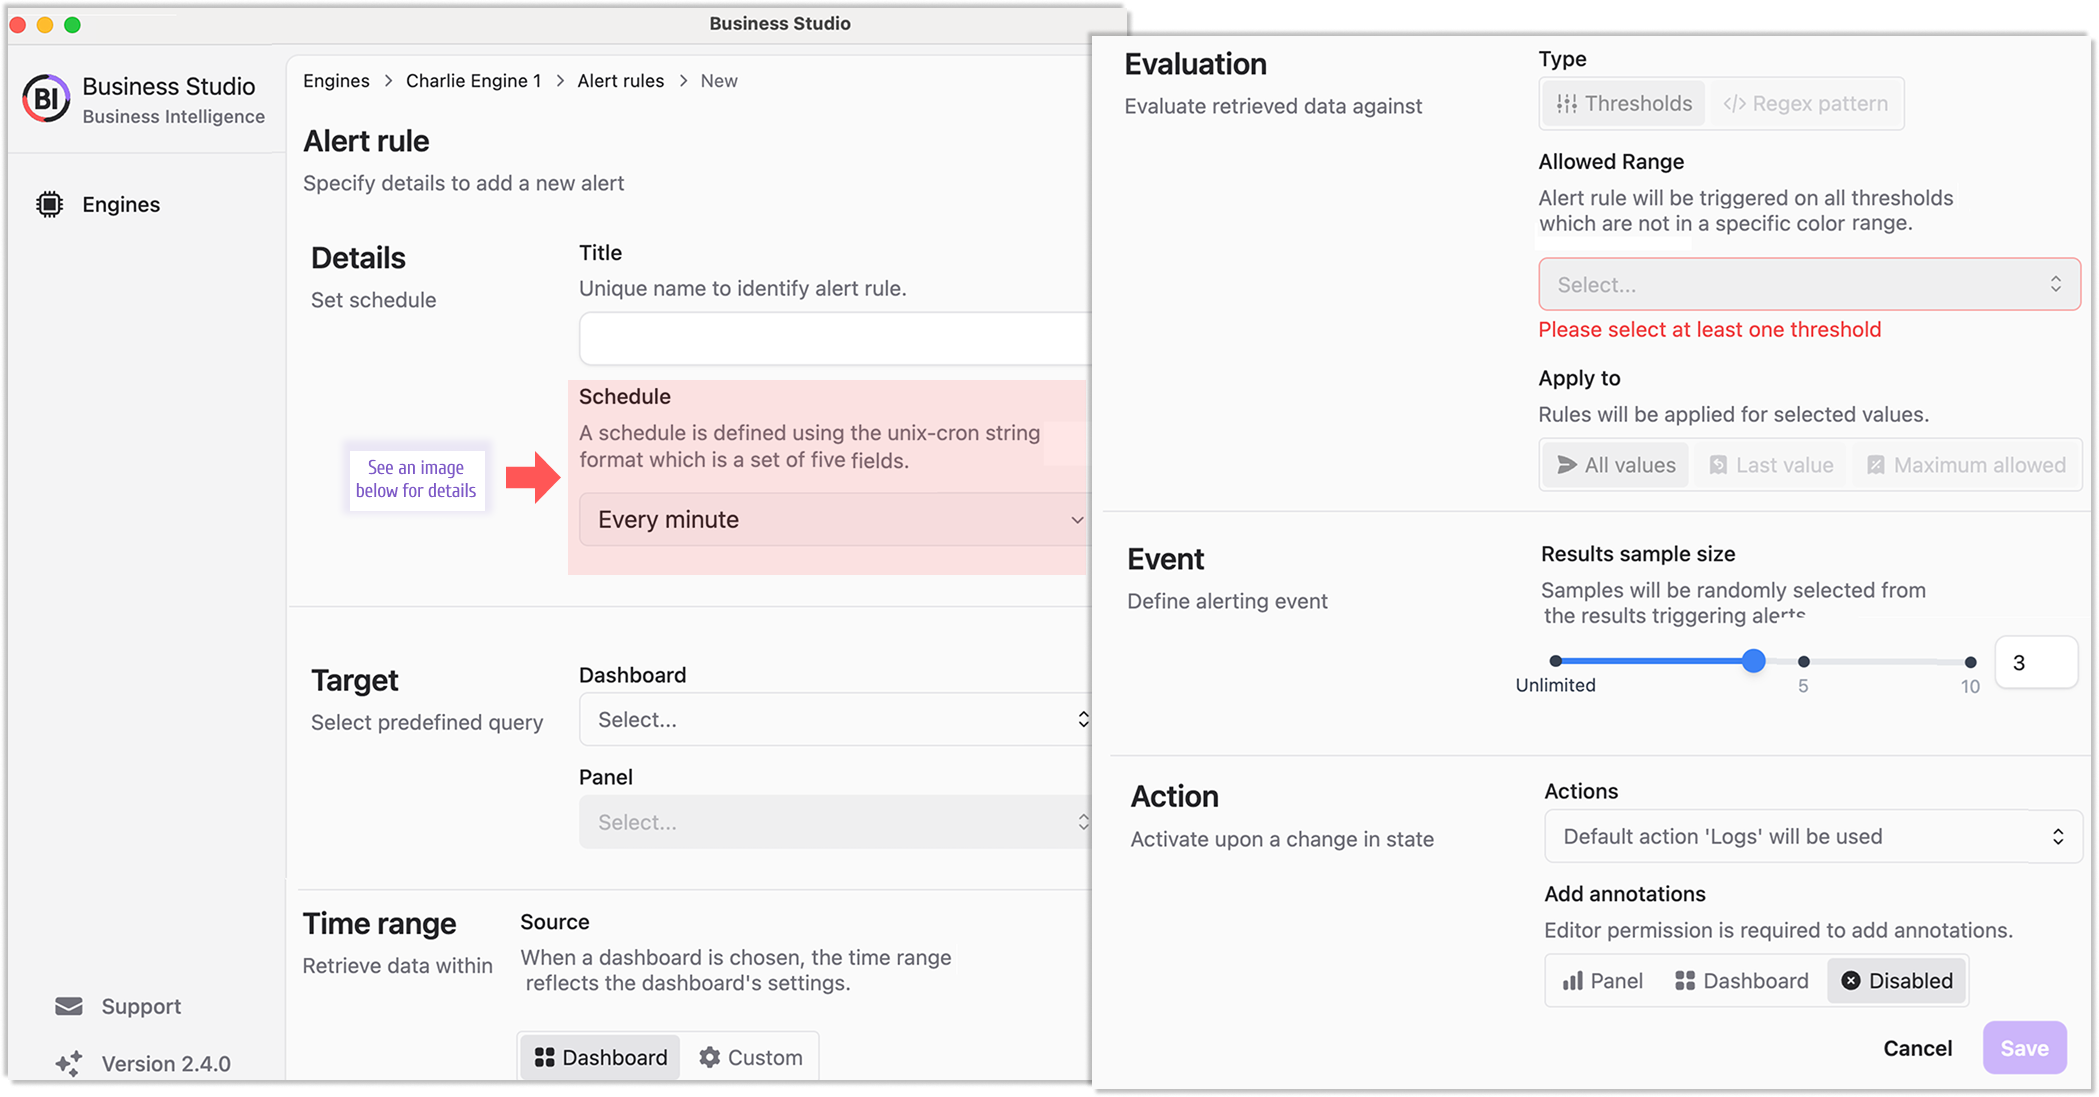
- Centralized and Simplified Management
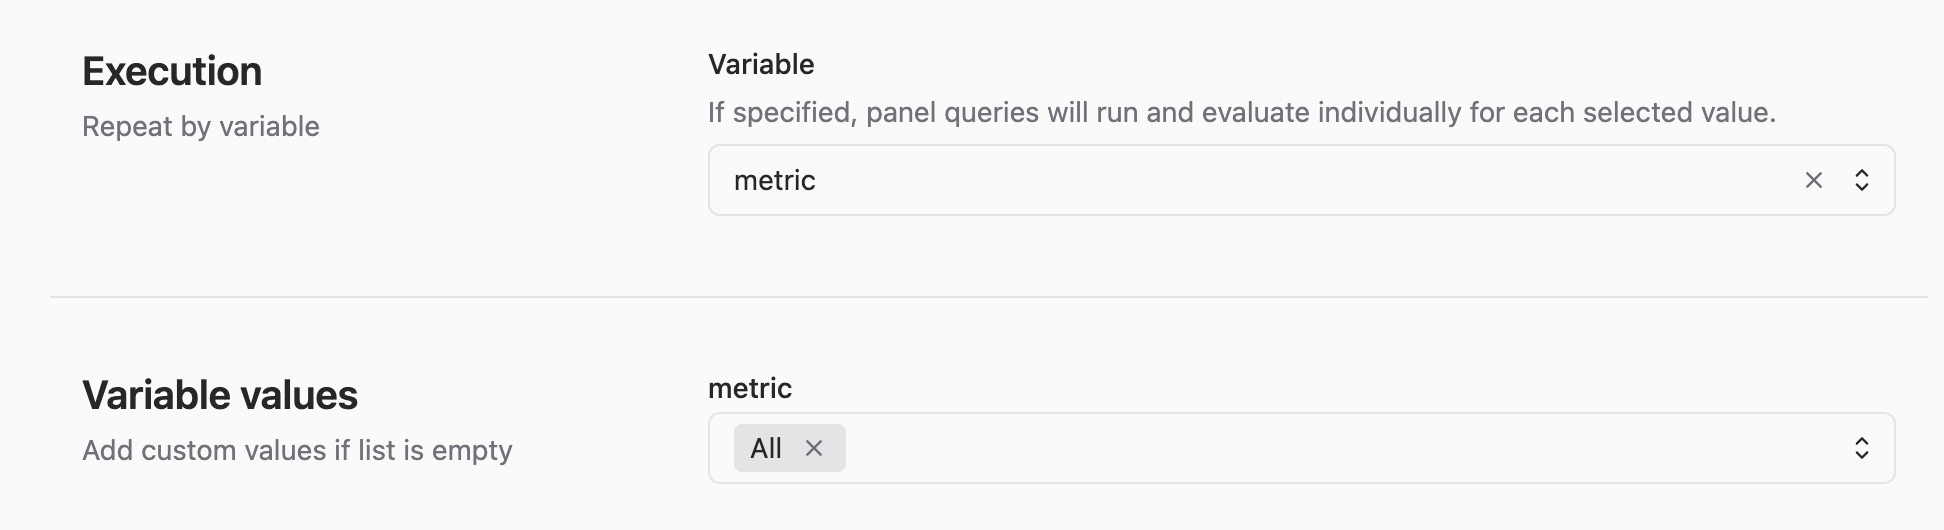
- Feature: A unified UI and API allow Alex to oversee hundreds of alerts from a single hub, leveraging reusable templates.
- Impact: Alex rolls out a “low sales” alert for all clients in minutes, adjusting thresholds ($10K for Client A, $5K for Client B) via a quick script.
- Enabling Non-Technical Users
- Feature: An intuitive UI with dropdowns and data previews makes alert creation accessible to everyone.
- Impact: Raj sets a “sales < $5K” alert on his own, slashing Alex’s workload for basic requests by 80%.
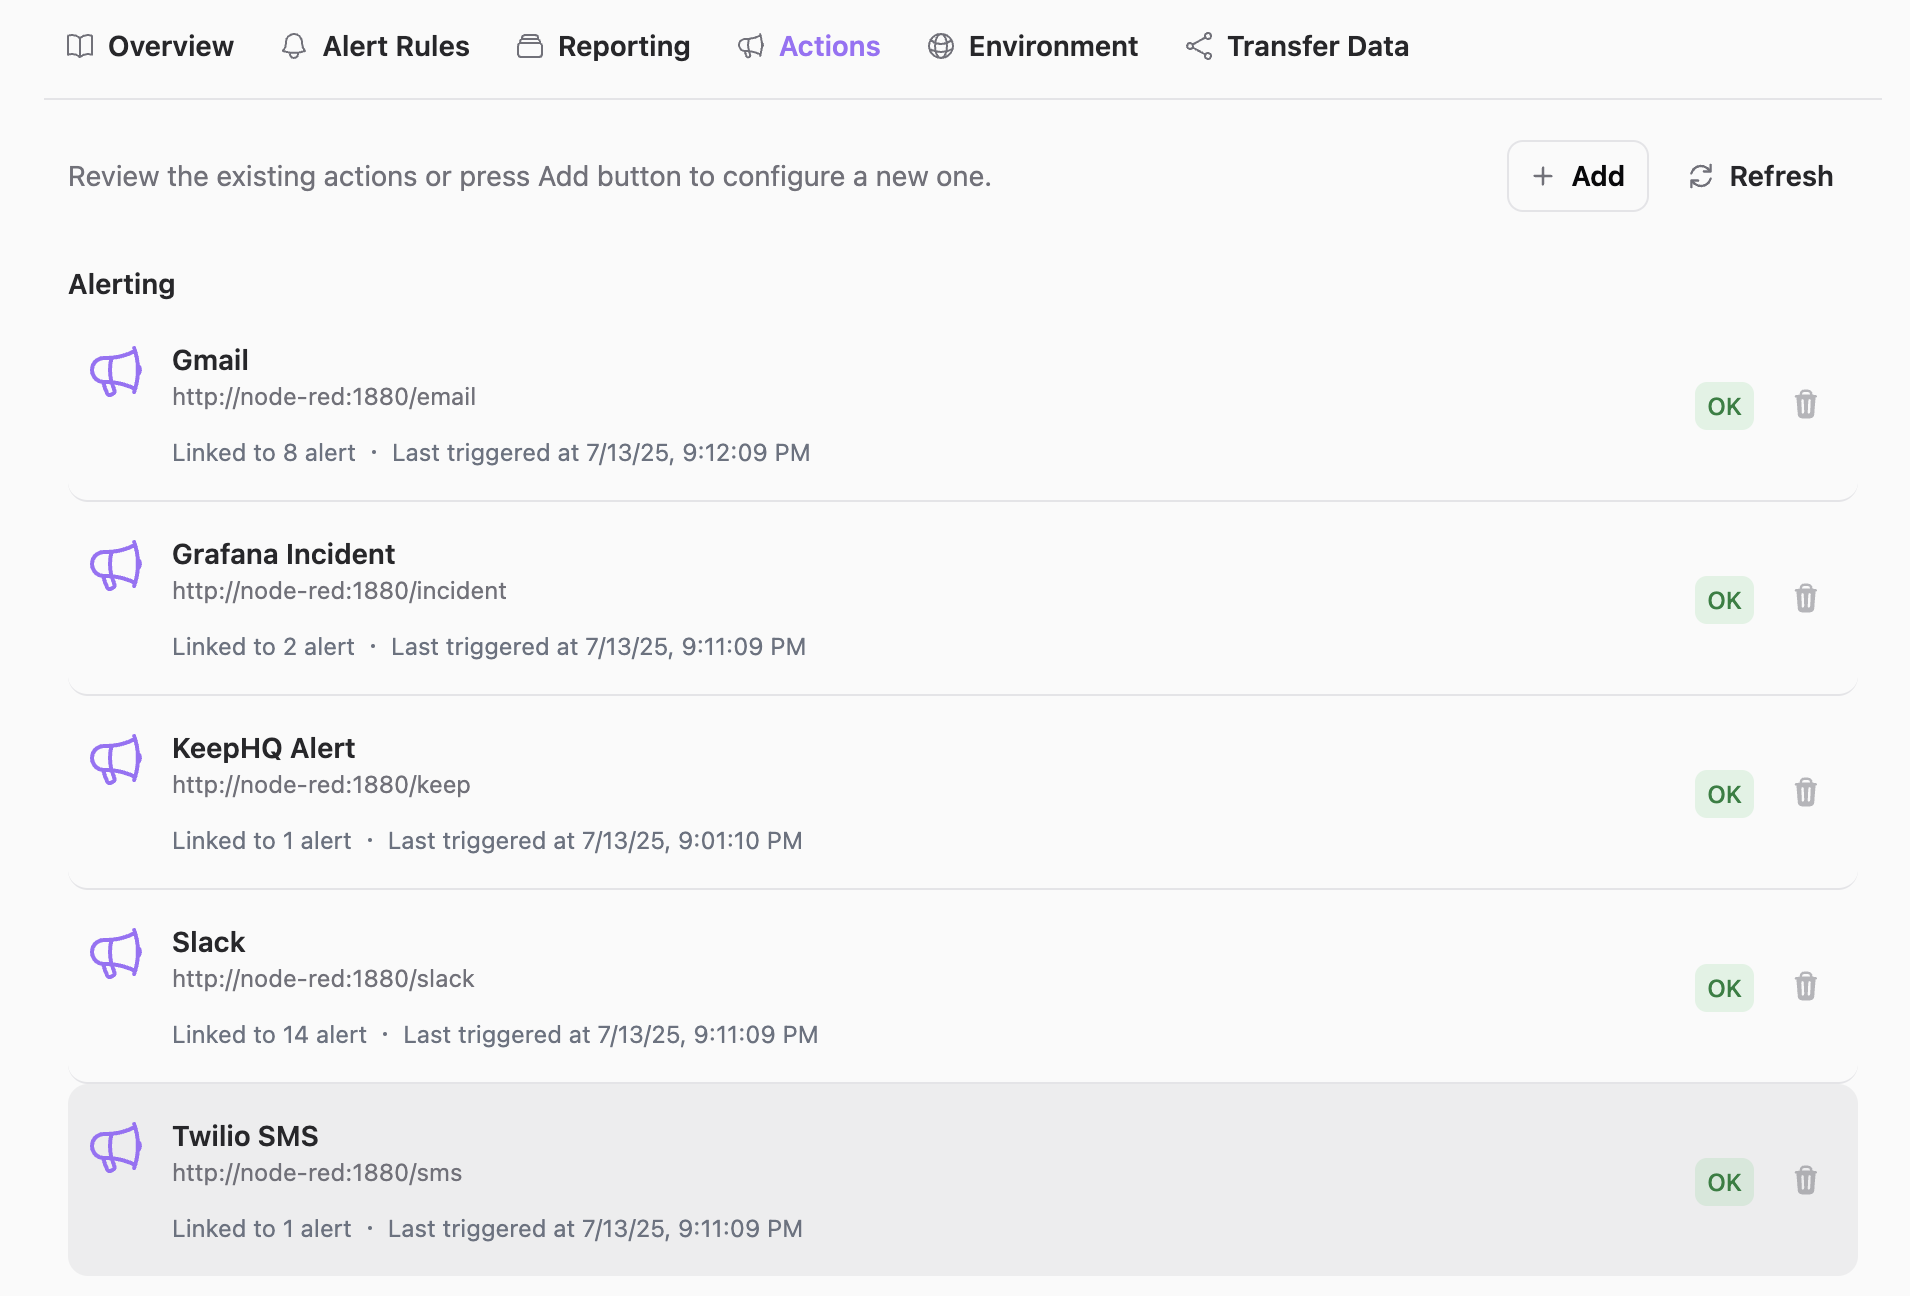
- Customizable Notification Channels
- Feature: Supports multi-channel delivery (Slack, SMS, email) with flexible templates.
- Impact: Alex handles varied client preferences—Slack for Client A, SMS for Client C—from one intuitive interface.
Implementation at a Glance
- Setup: Alex deploys a 5 Business Engine clusters using Docker, linking each to a client’s Grafana instance.
- Workflow: Designs dashboards in Grafana, defines hundreds of alerts in Business Studio, and monitors load via Prometheus.
- Client Access: Raj gets viewer-level access to tweak alerts, with HA ensuring uninterrupted reliability.
Real-World Impact: A Case Study
- Scenario: An alert for “delivery time > 4 hours” among hundreds of rules processing 1M records.
- Before Business Studio: Grafana buckled under the weight of hundreds of alerts, slowing down instances.
- After Business Studio: The cluster handles the alert alongside others, sending an SMS reliably. Raj even adds a “fleet idle > 10%” alert via the UI—no assistance required.
Tangible Benefits
- Time Efficiency: Alert setup time reduced by 60% with centralized management.
- Capacity: Manages hundreds of alerts without performance hiccups.
- User Independence: 80% of clients handle basic alerts on their own.
- Scalability: Supports 10x client growth without breaking a sweat.
Why Business Studio is a BI Game-Changer
Business Studio by Volkov Labs elevates Alex’s multi-instance Grafana project into a scalable BI powerhouse. With load-balanced, high-performance alerting and reporting it meets client demands, streamlines Alex’s operations, and empowers users like Sarah and Raj to take control.
Whether you’re a BI professional like Alex or a business user like Raj, this platform unlocks Grafana’s full potential as a client-facing BI solution.
Join Mikhail for an in-depth look at Business Intelligence 3.6.0 exciting updates:
Ready to tackle hundreds of alerts with ease? Explore the Business Intelligence platform and discover how load balancing can revolutionize your Grafana setup.
We’d Love to Hear From You!
Your feedback and ideas are invaluable to us! Here’s how you can get involved:
- Questions, Feature Requests, or Bugs: Submit a Zendesk ticket to receive a swift and personalized response from our dedicated support team.
- Join the Community: Subscribe to our YouTube Channel and share your thoughts or suggestions in the comments.
Your input is crucial in helping us grow and improve, so please don’t hesitate to reach out!