Transformations in Grafana

As usual, before posting an article on this blog, I created a Youtube video about the subject. Feel free to switch to the pictures in motion if you are a visual person. I use the Loki data source in my examples there; if that fact makes any difference.
The following article contains similar to my video material with some extra insights.
What is a Transformation?
A transformation is a set of optional, behind-the-scene steps that Grafana performs on the data source data format in order to match it with a visualization panel data format.
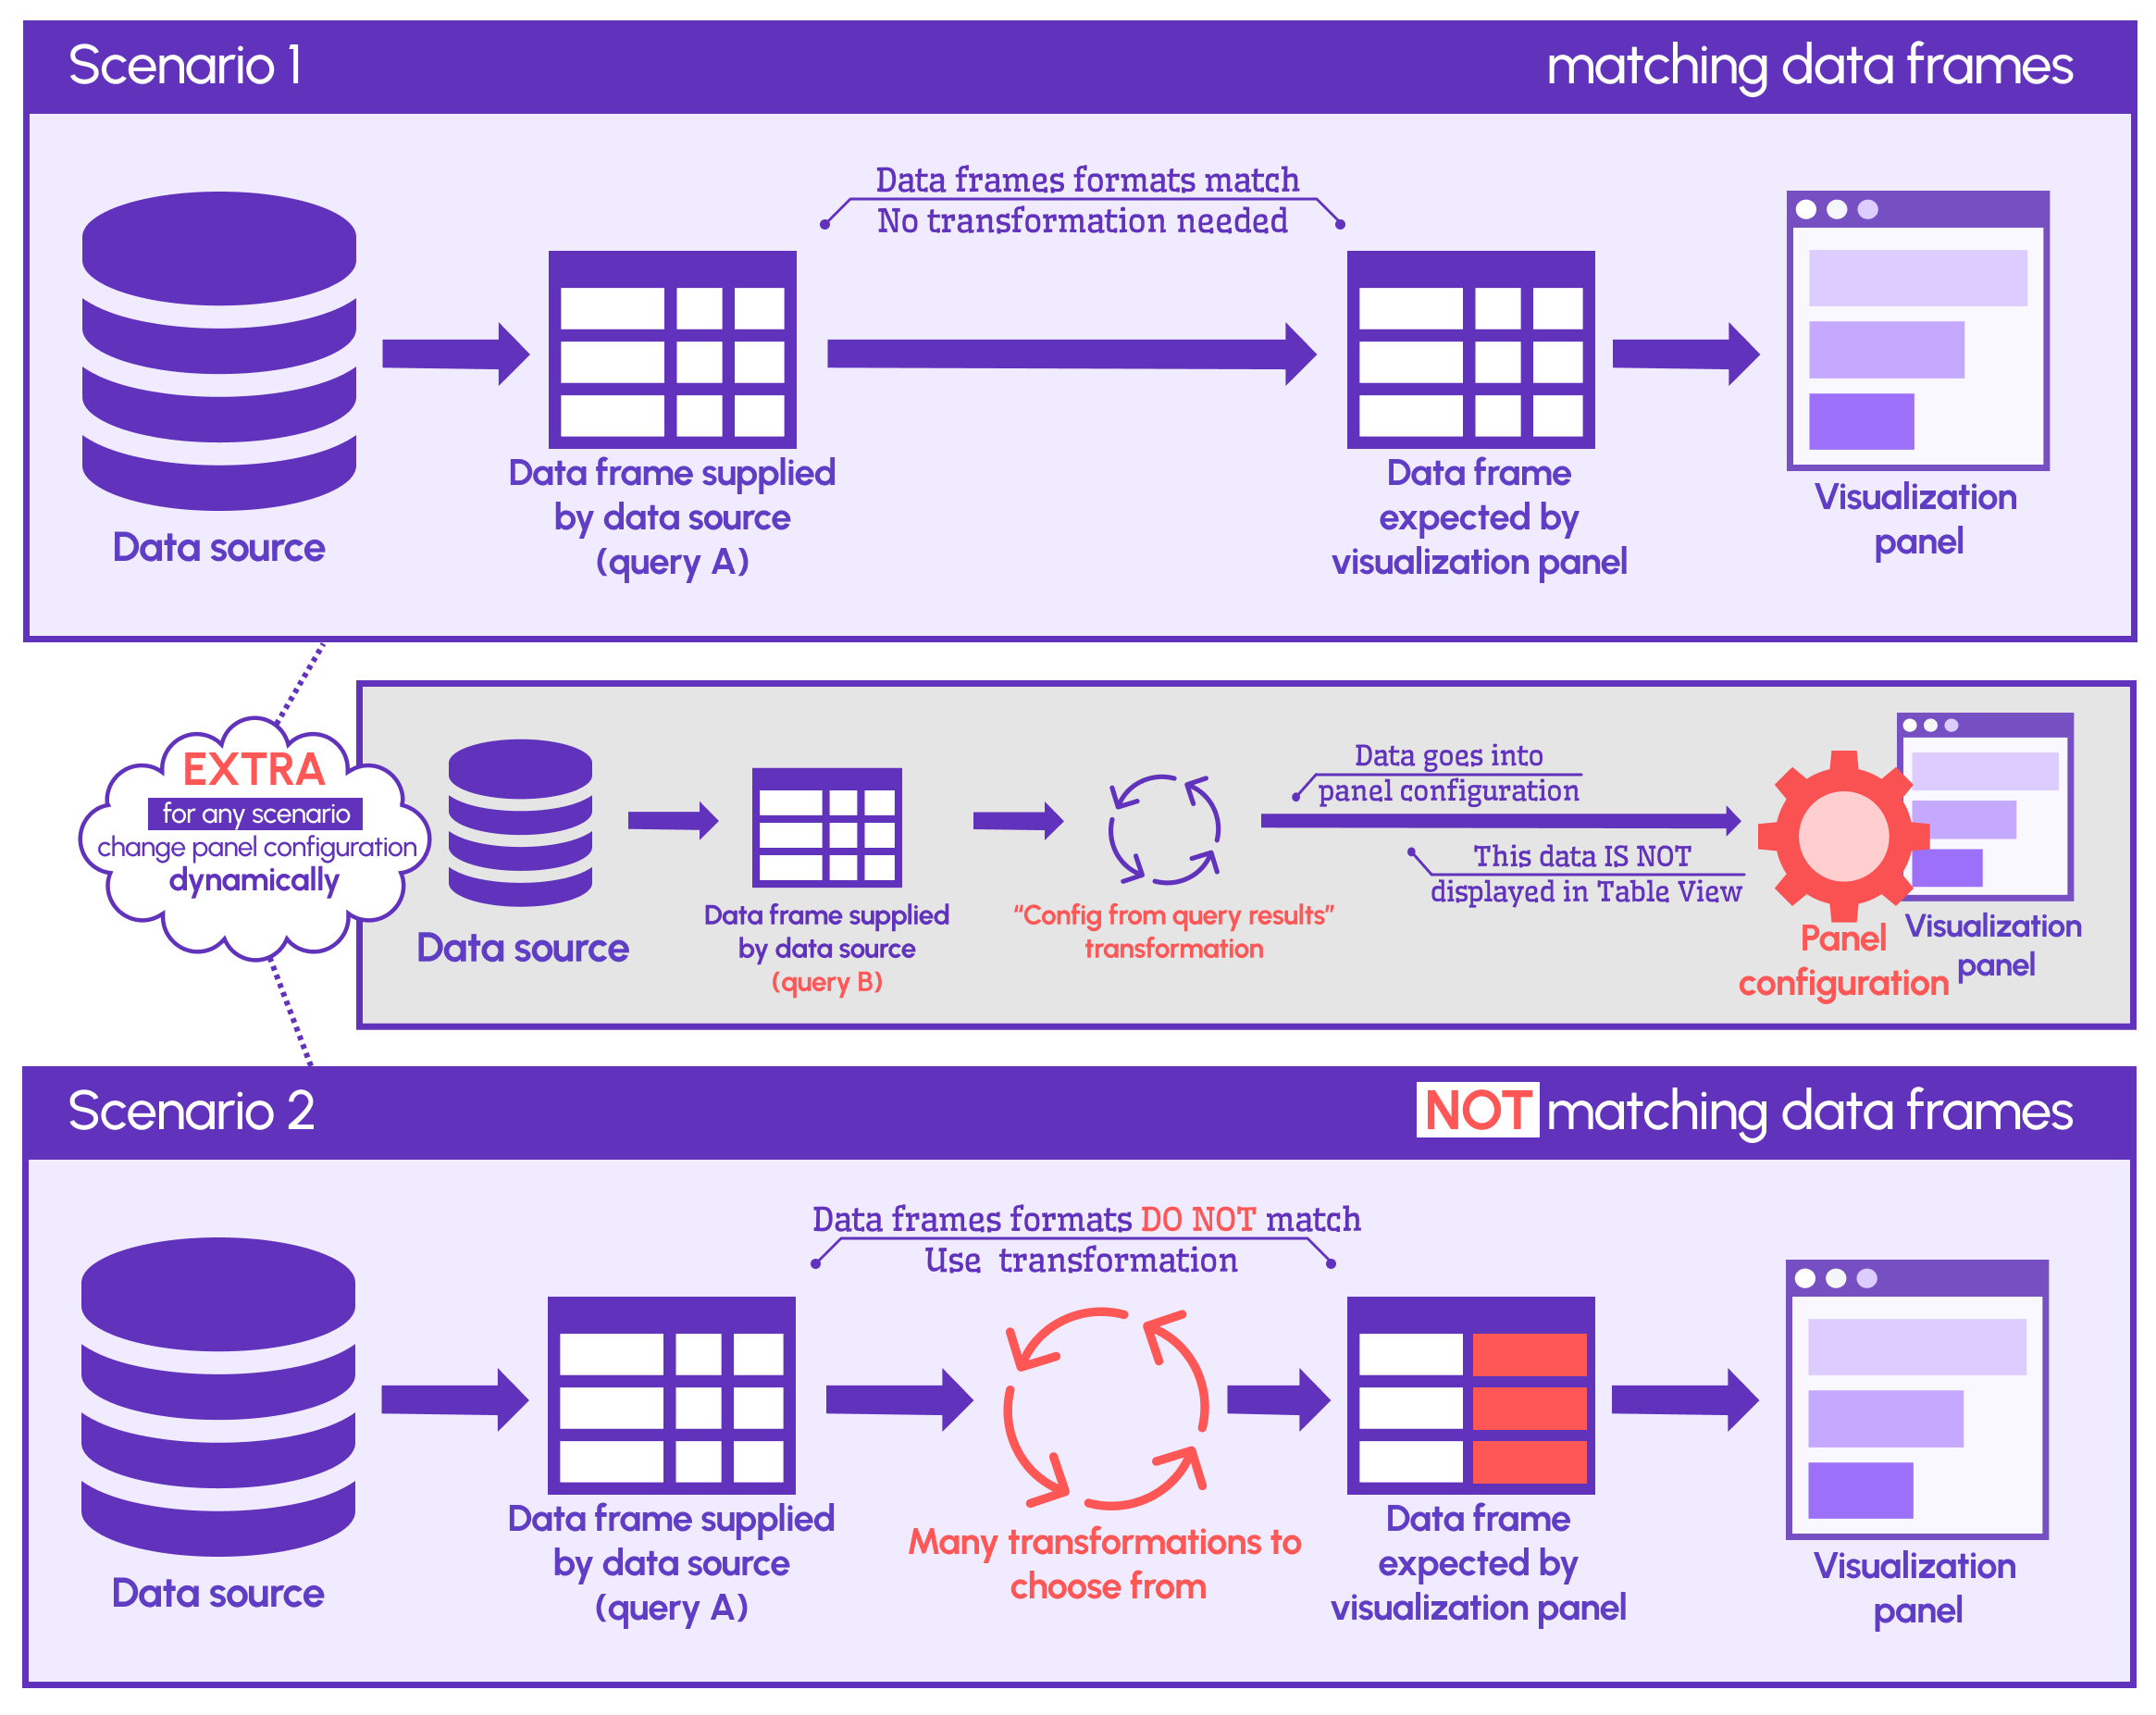
In the schema below, I put two scenarios:
- Scenario 1, you do not need transformation. Probably, many SQL database users are here.
- Scenario 2, you do need a transformation.
What is in the middle is a special transformation "Config from query results" that does not fit into the mold and has to be described separately. I will explain it later in the text.
Why Data frames might not match
Or, in other words, why does someone need a transformation, to begin with, if the data can be formatted to perfection on the database side? We received this question from one of our YouTube subscribers after I posted the video. I believe many would benefit from the answer. So, here we go.
I came up with the following 6 cases when transformation saves the day. If you know more, please, let me know!
Merging requests from databases of the same type
If you store data in multiple databases, let's say, two architecturally identical databases, you will have to have a step in your data pipeline where you combine and possibly aggregate your data.
Grafana transformations in that event are an easy and quick solution. No need to worry about another entity in your data flow. Any visualization panel can combine as many databases (via data sources) as needed.
Merging requests from databases of the different types
This case is similar to the above, but remember, with Grafana, your visualization panel can consolidate many data sources. You easily can combine, for instance, PostgreSQL database queries with external API calls.
In my experience, a client had an analytical dashboard to compare one company's results with national averages. The national averages were downloaded from the government servers using API calls functions.
The transformation layer would be the ideal place to perform merging and/or aggregation calculation steps.
Requests to NoSQL databases
NoSQL databases, like Prometheus and Redis, are famous for many things. However, flexible data slicing and dicing is not one of them.
Simple LIMIT or GROUP BY might be an unexpected pain in the neck. Transformations easily alleviate it with quiet grace.
Re-using the Request results
I like this one a lot. When you display detailed and summary visualizations on the same dashboard, why would you send multiple requests to your database?
You can run one query to fetch the detailed data and then compute aggregations (and apply other transformations) right on the dashboard. Transformations here are time and a performance savior!!
Using external API data
If your data source is an external API server you have zero control over what is coming your way. Somewhere and somehow you will have to modify the incoming data to fit into the visualization panels requirements.
Honestly, I am not sure if there are any alternatives to transformations in this case.
Analyst's independence
In addition to all mentioned above, transformations can give freedom to the analyst who creates dashboards in Grafana. They do not have to request any changes to be made in the database just for them.
They can work with the current datasets and modify the data layouts with a couple of extra clicks in Grafana.
How transformations work
The three following examples are taken from our website analytics project. We collect data to stay on top of the community interest and transformations help big time on our attendance dashboard.
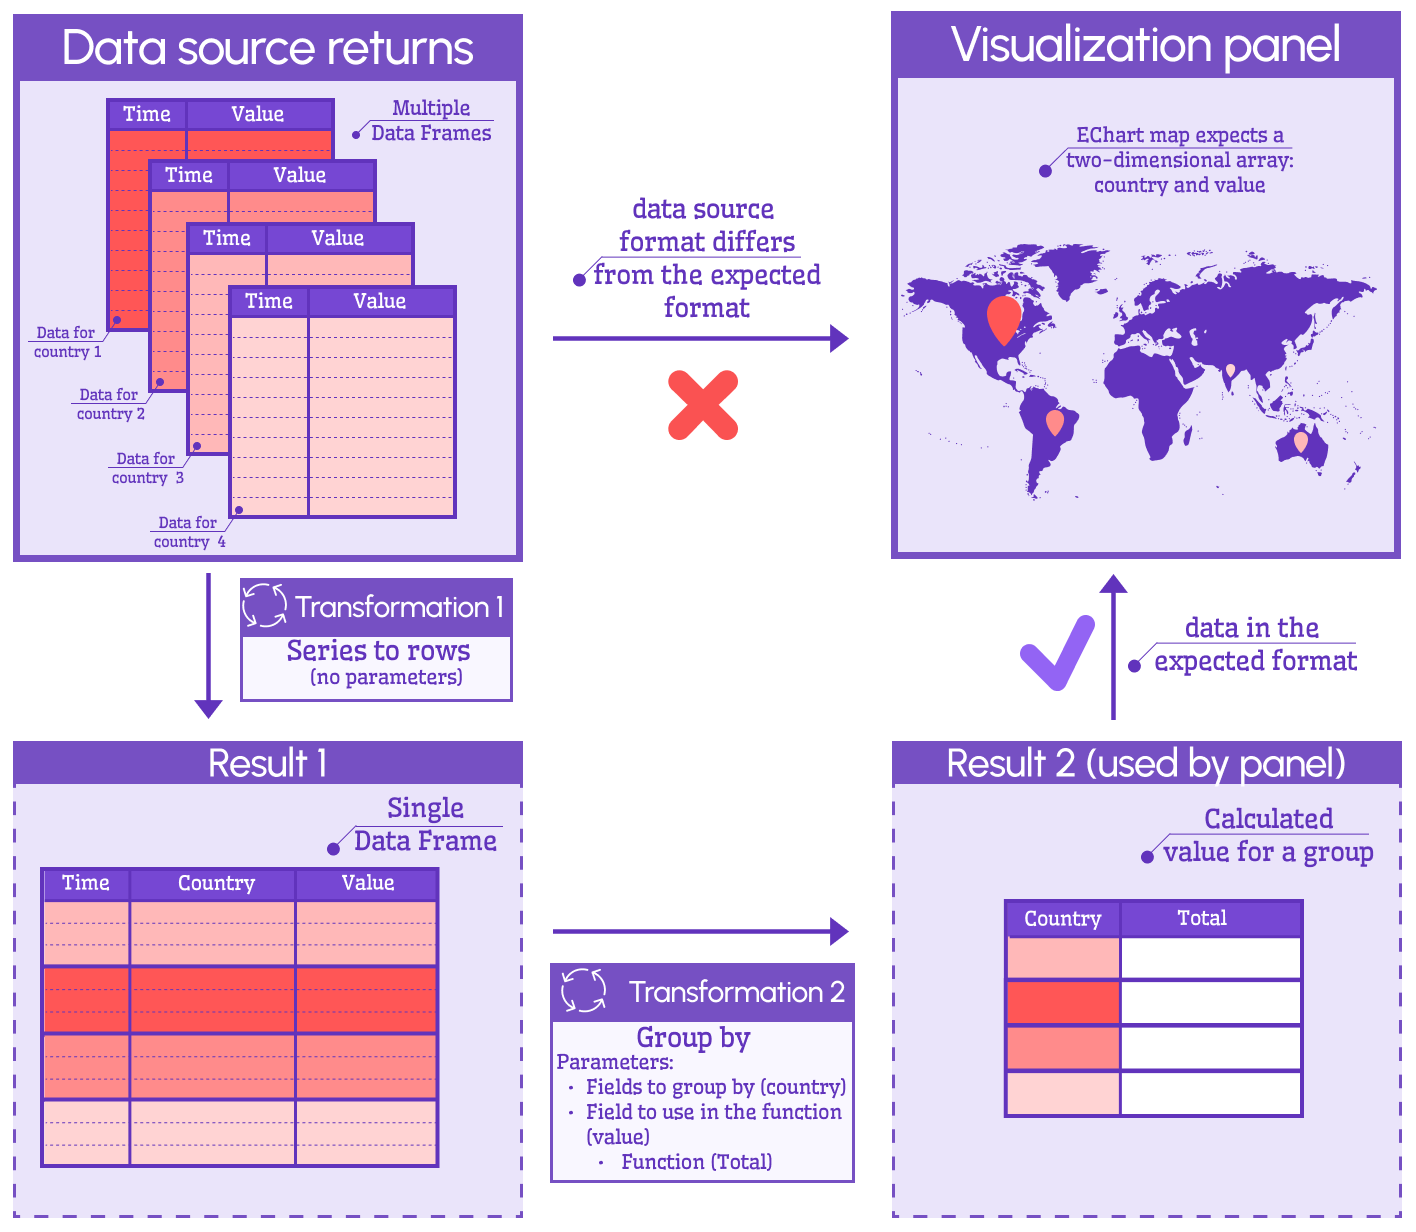
Series to rows and Group by
In the first example, we extract data from Loki via the Loki data source. It comes in multiple data frames (a.k.a tables). Every data frame comprises Time and Value columns. The Value column represents the number of clicks at that time.
The first transformation, 'Series to rows', combines all data frames into one, placing them one after another and identifying from which country every row comes by specifying a country (data frame name) in a new column.
The second transformation, 'Group by', is to calculate the total number of requests coming from every country. Conceptually, this transformation works the same as the SQL GROUP BY clause.
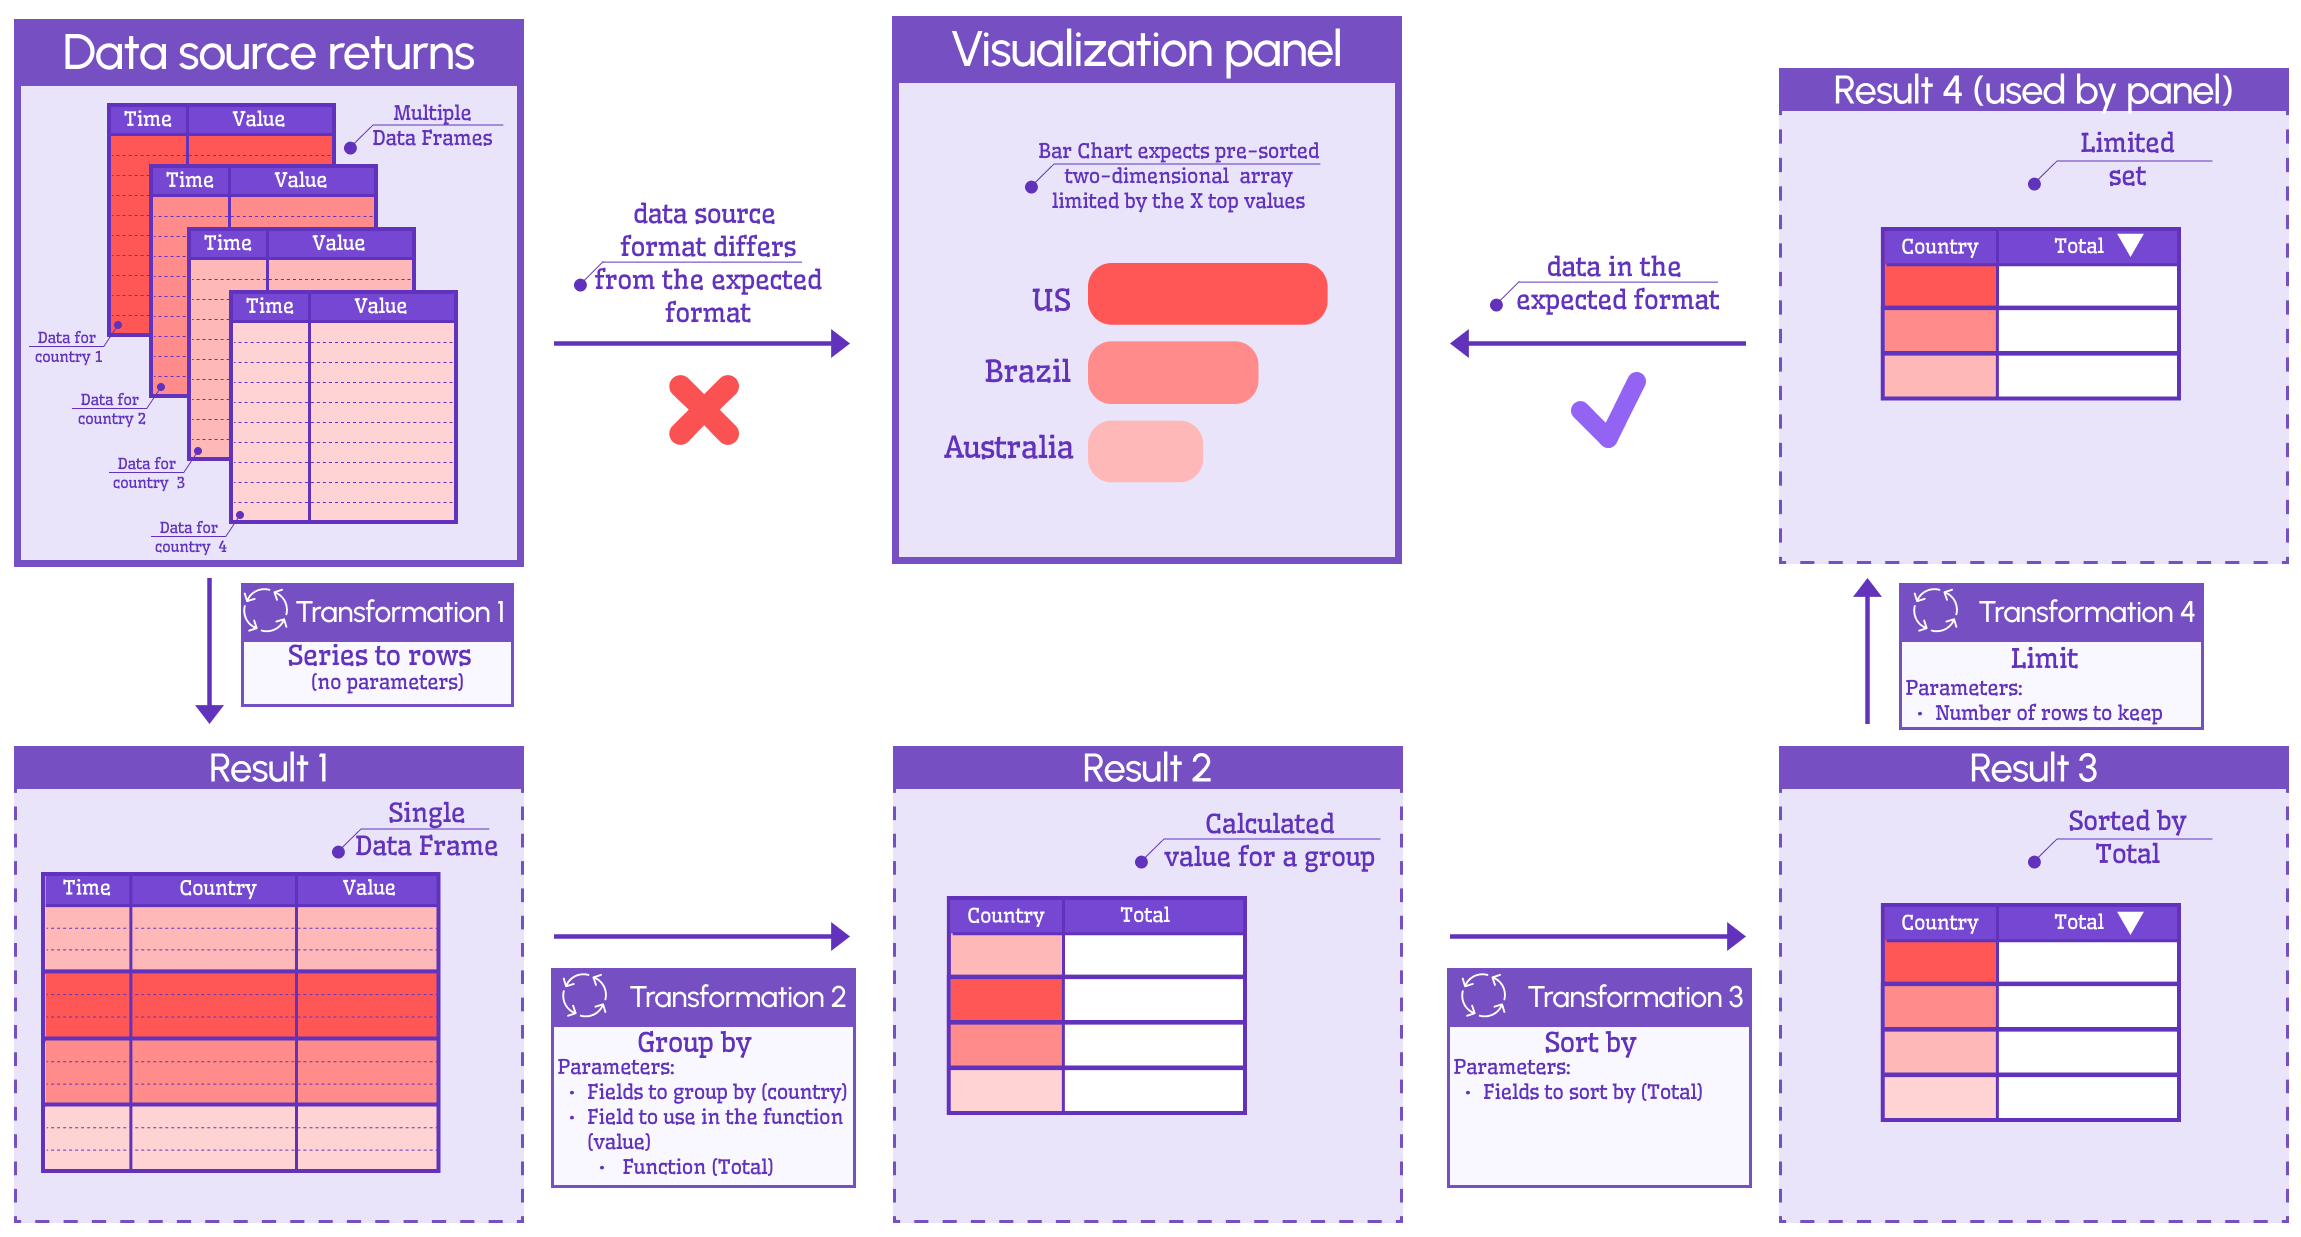
Sort by and limit
In the second example, we move a little further and add two more transformations on top of the ones from the first example.
We add SORT BY and LIMIT modifications to have the retrieved results sorted in descending order of summed Value and keep only 15 first rows. The geography of our web resources attendance covers more than 130 countries, and keeping an eye on the first 15 is good enough for our goals.
Join by field and organize fields
This example uses Time Series in a Stacked Bar Chart mode. The input data layout should be a single data frame where all stacked data series should reside in a column.
The first transformation, 'Join by field', has two modes - INNER and OUTER.
- INNER keeps rows if the value of the selected field exists in ALL data frames.
- OUTER keeps all records from all data frames, so, most likely you will end up with a lot of NULLs in your resulting dataset.
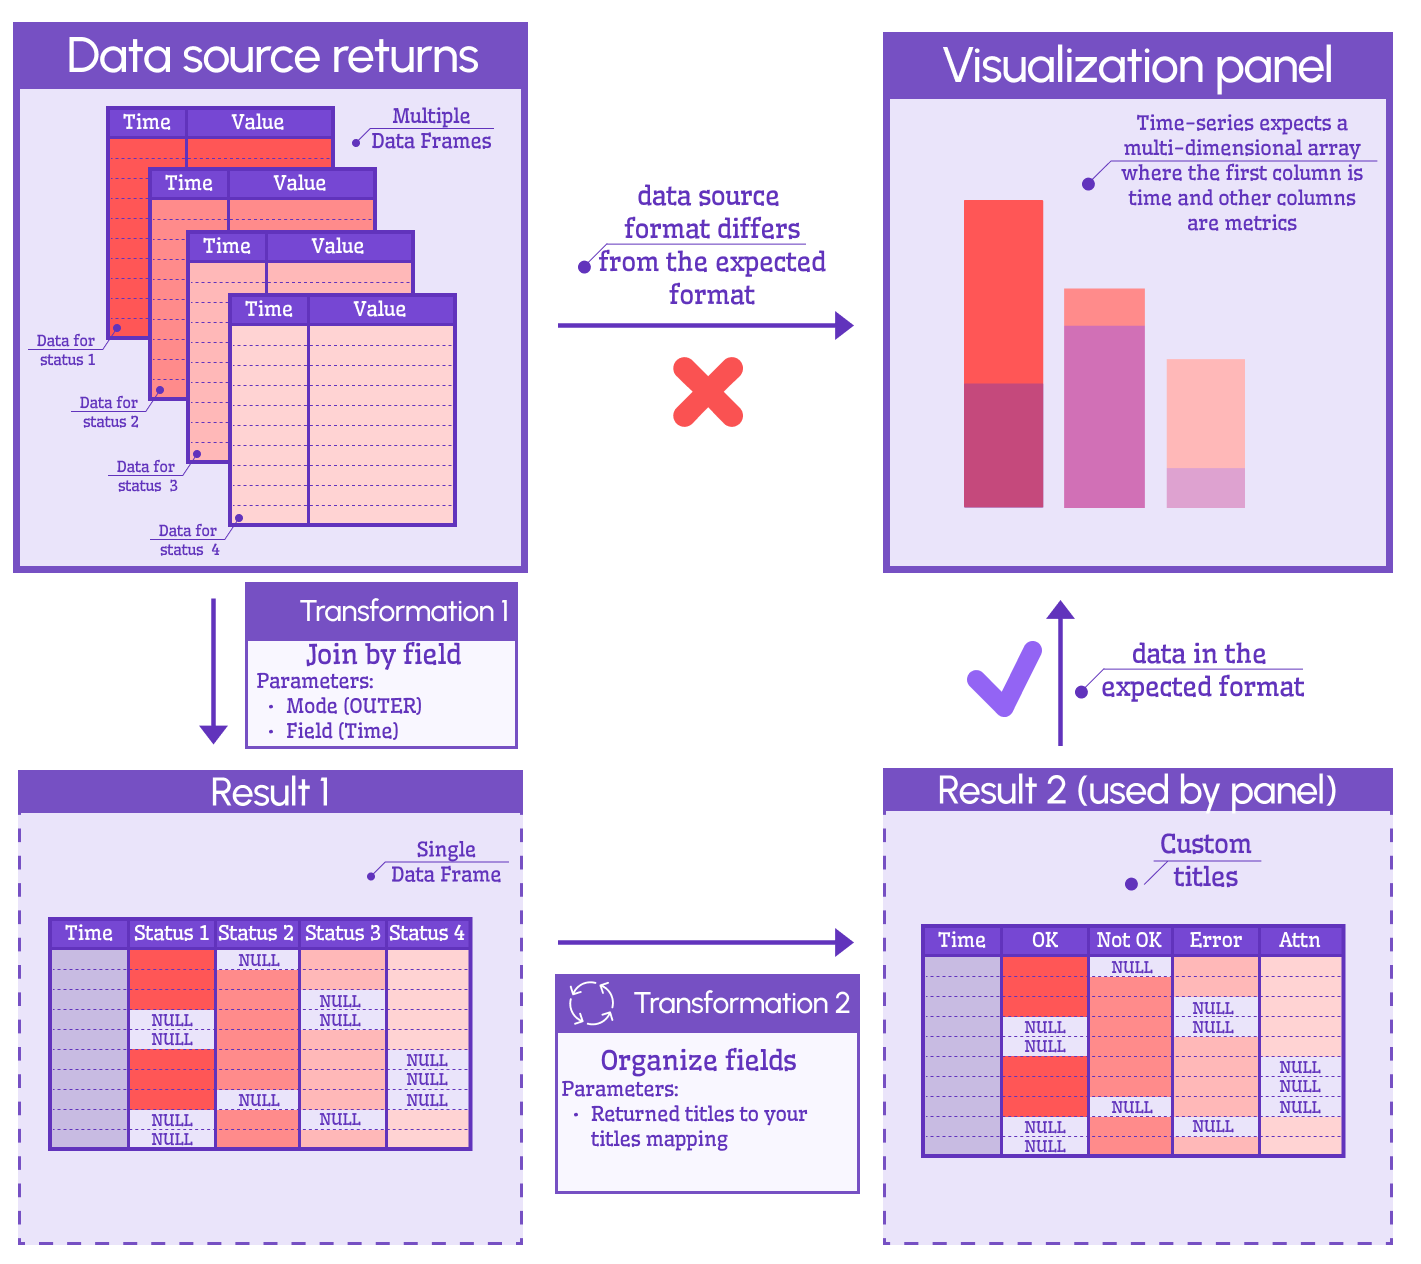
The second transformation, 'Organize', allows to replace field names and move columns up and down in order.
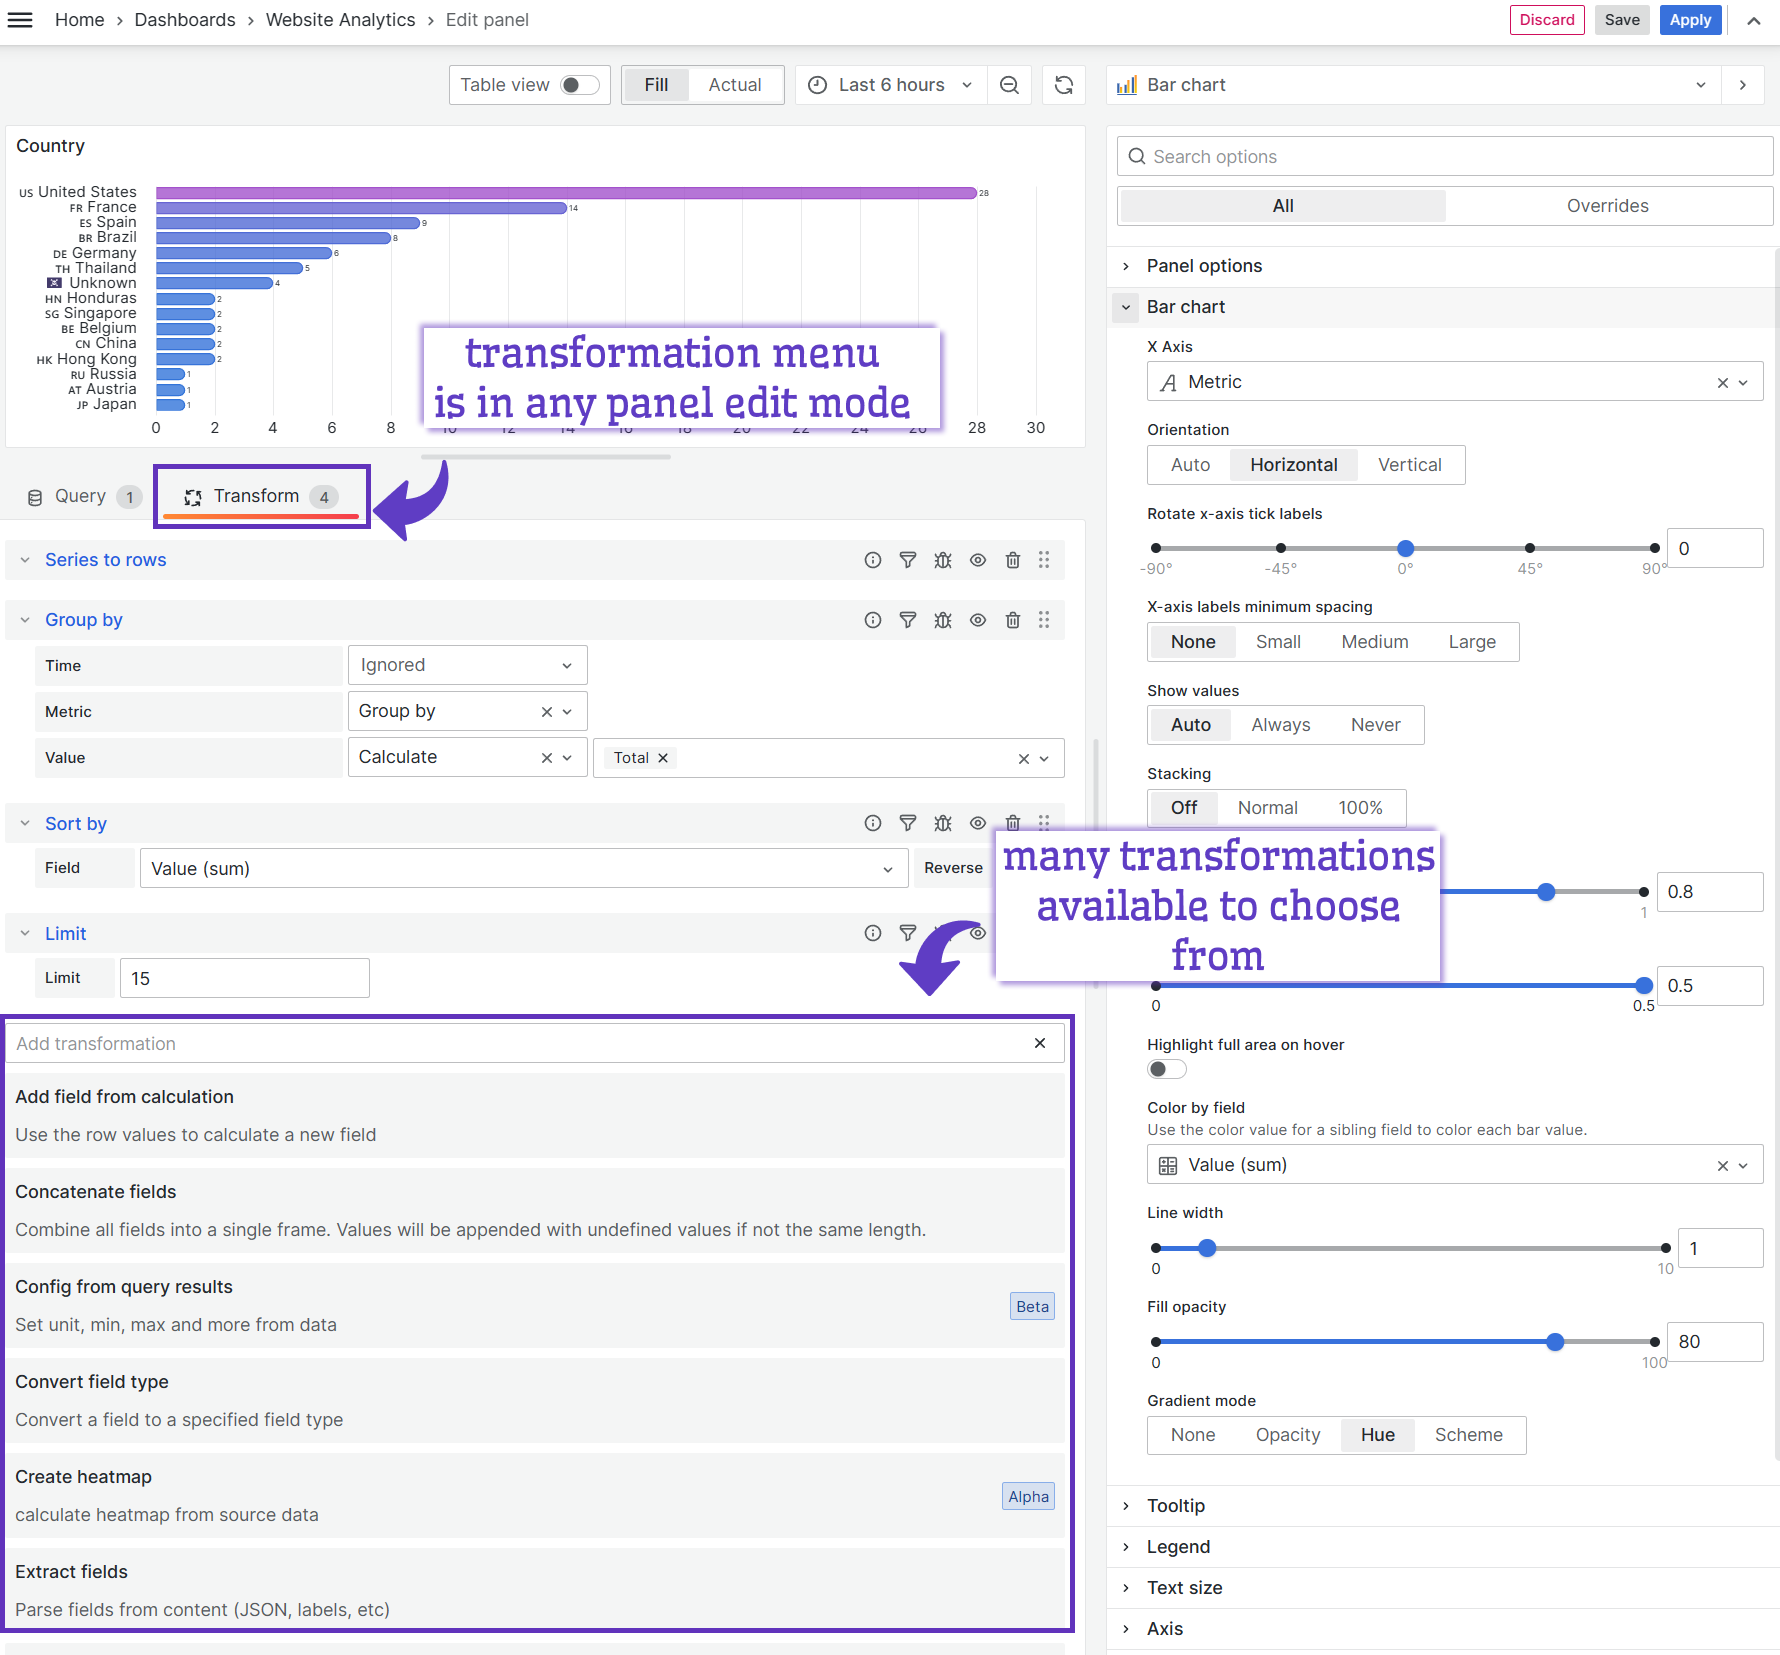
Transformations in Grafana UI
The transformation menu is located in any visualization panel in Edit mode. It is the second tab, next to the "Query" tab.
You can pile up multiple transformations. Every time one transformation is performed after the previous one, so, the order matters. The output from one transformation goes as input to the next.
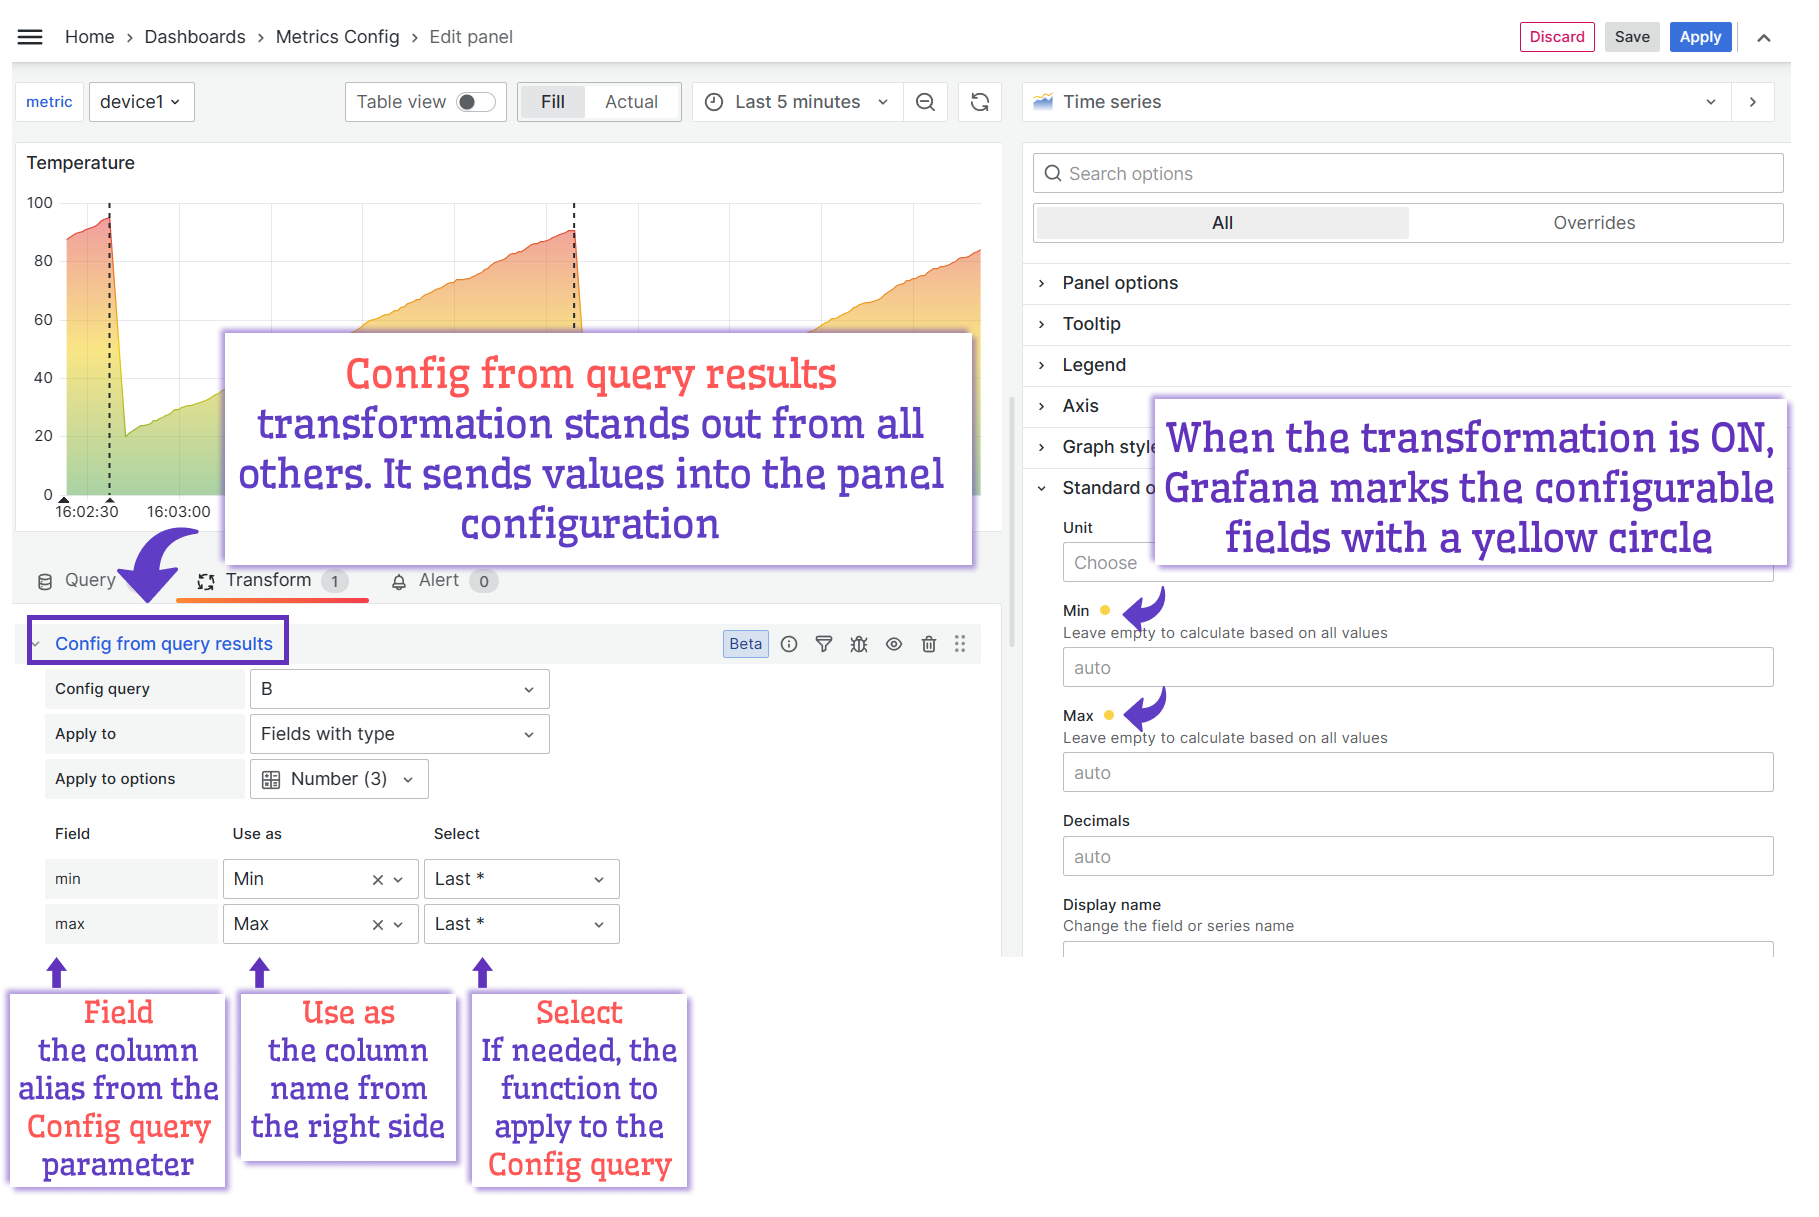
Config from query results transformation
I wish Grafana made it clearer that this transformation is not like any other. It does transform the input data, however, then it sends the results to the panel parameters. This transformation makes the panel configuration dynamic, or, in other words, to be reactive to your data source values.
This transformation can be used alone or in addition to many other transformations. Once it is ON, Grafana puts yellow circles next to the parameter names it impacts on the right-hand side.
Also, once the transformation is ON, you lose simple access to the fetched values (the values that go into configuration).
If for troubleshooting you need to review the values, simply turn the transformation OFF by clicking an eye icon and selecting the corresponding data frame from the newly appeared drop-down box.
I demonstrate all the above in my video in case my wordy explanation only confuses you more.
Instead of a boring conclusion
The transformation topic is not as convoluted as many others in Grafana. However, despite all benefits they provide, the transformations feature is not widely known or used. The goal of this article was to shine more light on transformations, give examples and show how they exactly work.
Let’s Stay Connected!
Join the Conversation: Stay updated and share your thoughts! Subscribe to our YouTube Channel and leave your comments—we can’t wait to hear what you think.
Your input helps us improve, so don’t hesitate to get in touch!