Celebrate with us! Our YouTube Channel is 1 year!


After one year, we are proud to look back and descry what we have accomplished.
Starting with zero Youtube experience, we called the artistic side of our brain to come up with a recognizable format that would be engaging with a touch of a good friend sharing an intriguing gossip. We focused on topics meaningful for many and carefully picked use cases that would illustrate the most of the topic.
The pouring questions from the community gave us directions and flowing gratitude fueled us with energy. We were excited to be able to address the most commonly asked questions that are not easily accessible elsewhere.
Following our zeal, we created a platform for spreading technical knowledge and earning a trustworthy reputation.
Our Platform
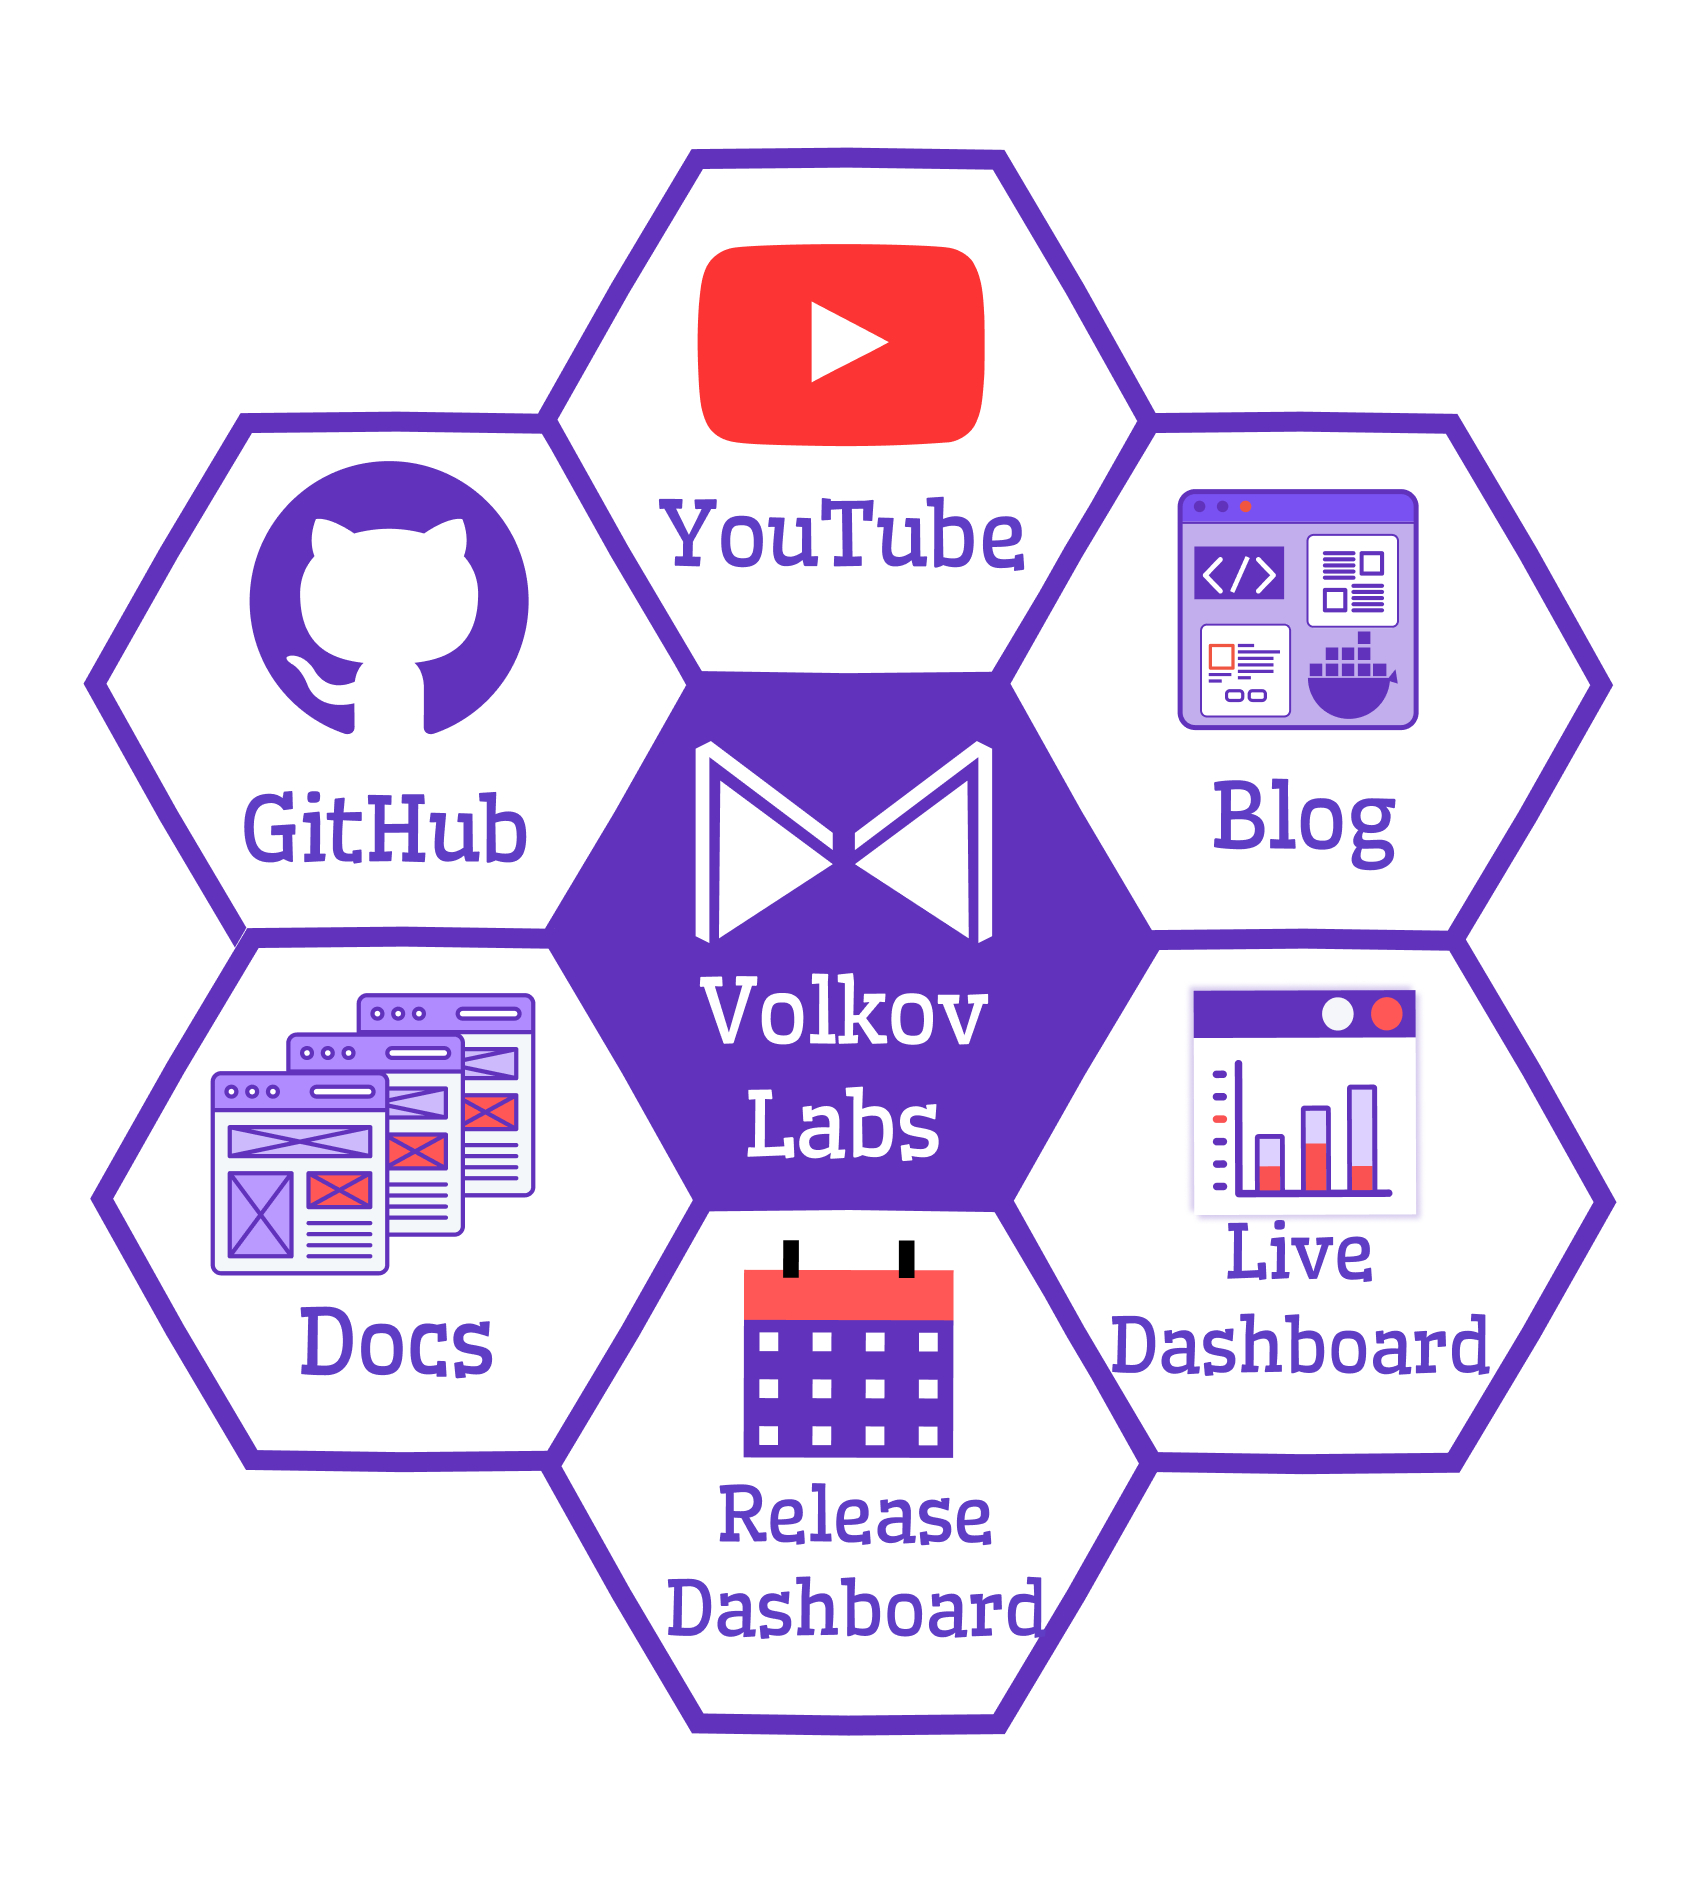
Our platform consists of six resources.
| Resource | Description |
|---|---|
| YouTube Channel | As they say, it is better to see something once than to hear about it a thousand times. |
| Documentation | We constantly improve documentation by ensuring to include the latest helpful findings and listening to community feedback. |
| Blog | Our blog is another medium to have your questions answered. We share our experience and provide a lot of code snippets and guidance to solve various tasks. |
| GitHub | Feel free to learn by browsing our code and get inspired with ideas and simple elegant solutions. |
| Live Dashboard | Originally we built this project for internal use. However, the project turned out worthy of sharing with the world. We depicted our digital footprint using Grafana dashboards and made all that we do transparent and easy to follow. |
| Release dashboard | It is the best way to follow the release calendar for our open source Grafana plugins. When was the last release? How many open issues exist at the time? Those and other questions are taken care of there. |
YouTube Community
We are on the lookout for the best ways to interact with the community and our followers. For the daily updates and quick surveys, we favor the YouTube Community at this time.
Many people reacted to the post about a new panel idea. A panel to provide movable real estate for displaying variables. That hints us to move the creation of this panel up in our to-do list and possibly consider a video or at least an article with a sound use case.
Even though we are completely focused on the technical side of things, many people like our behind the scene photographs. That is honestly a surprising observation, but we take it too.
After being Grafana story-tellers for that long, we came up with three areas that we are particularly good at and would like to grow more towards:
- Concepts
- Tutorials
- Use cases
Concept
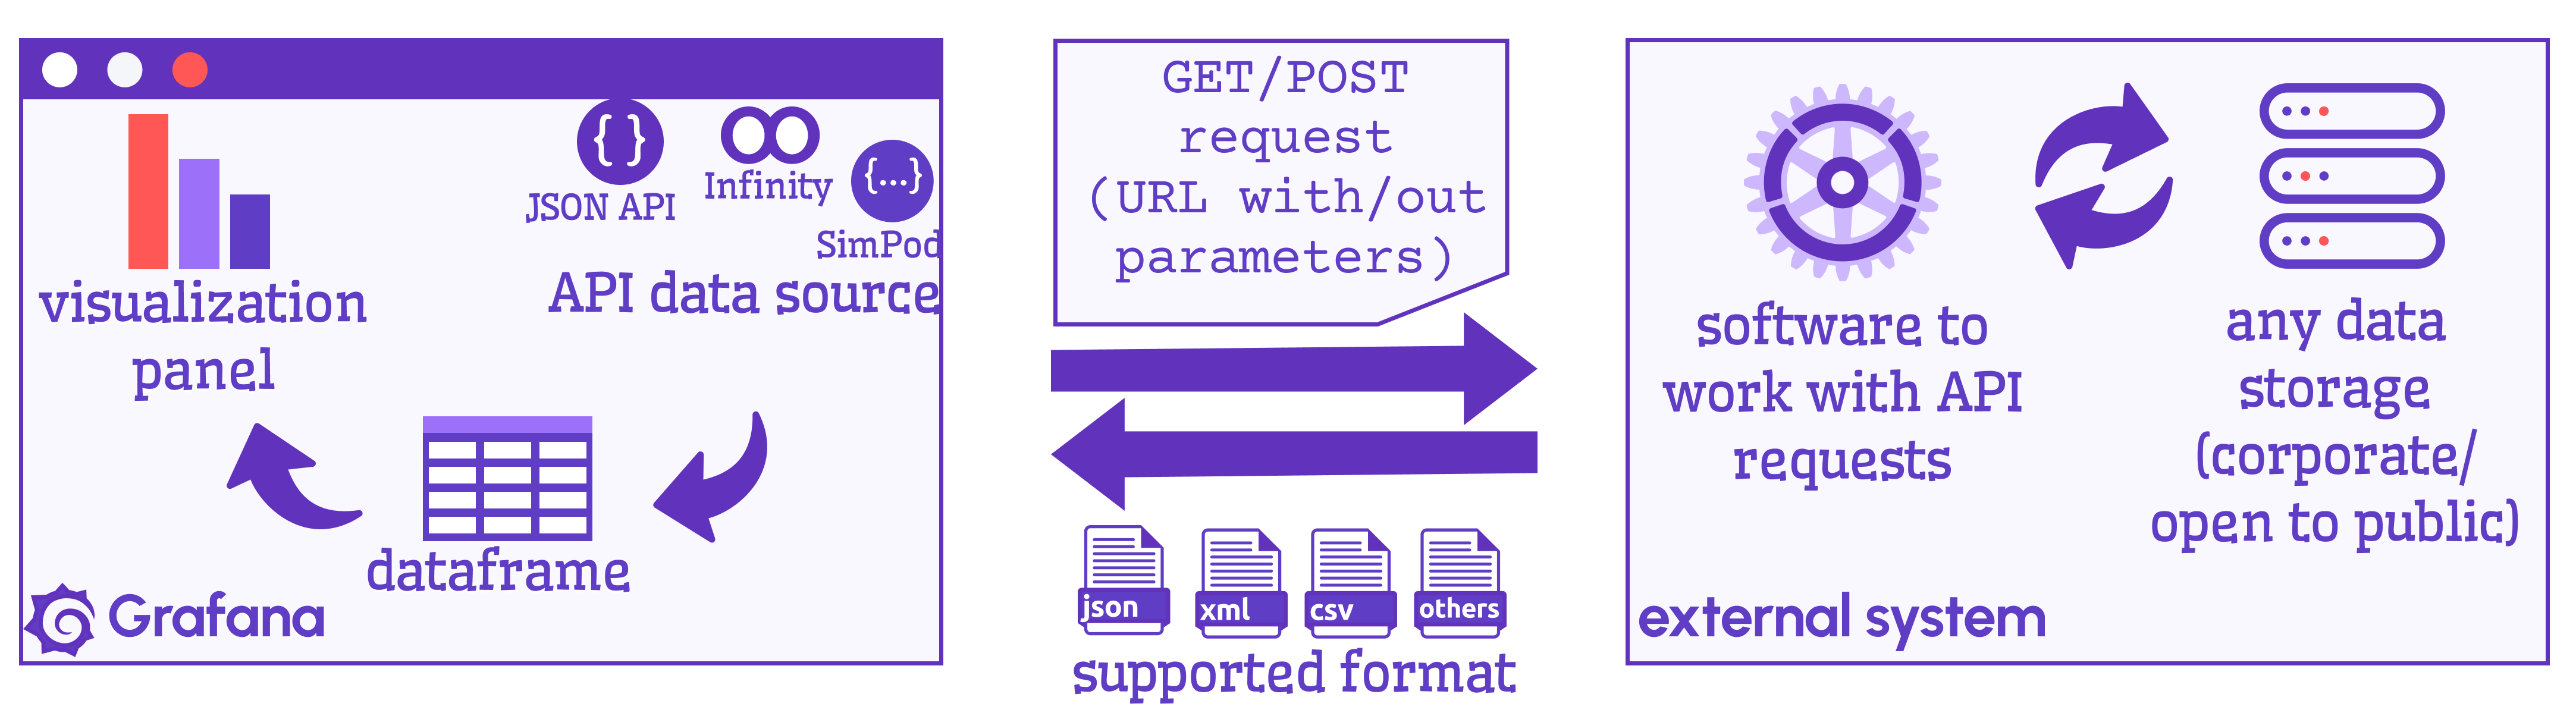
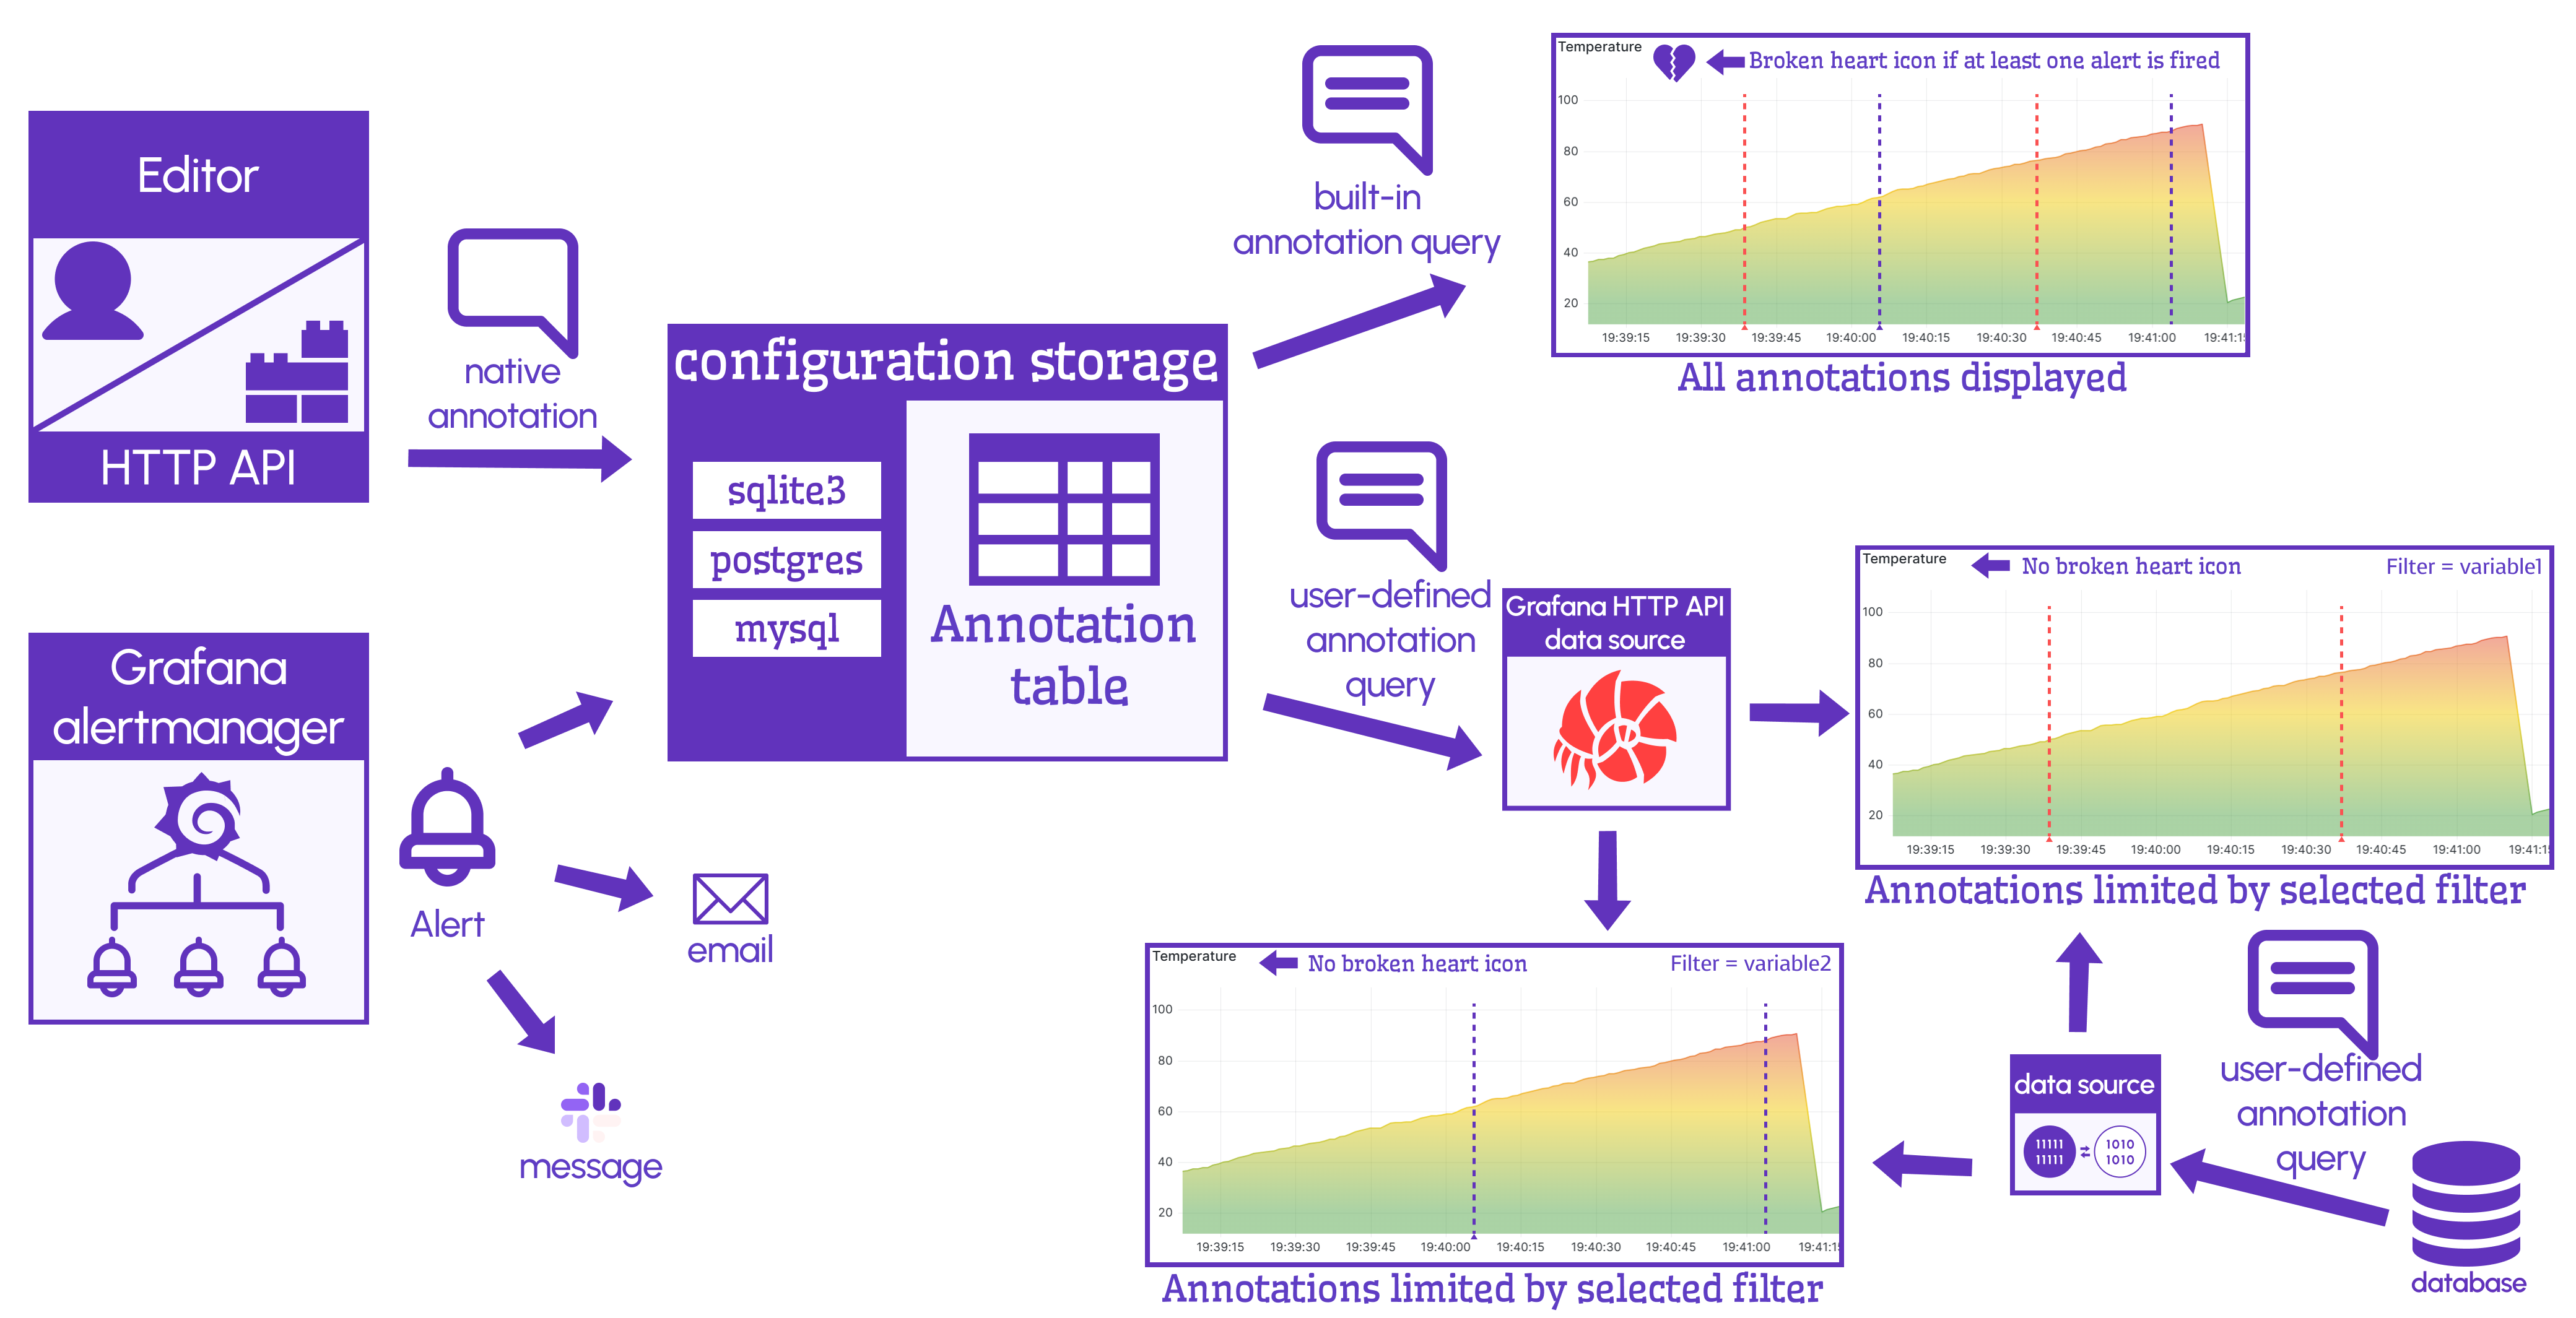
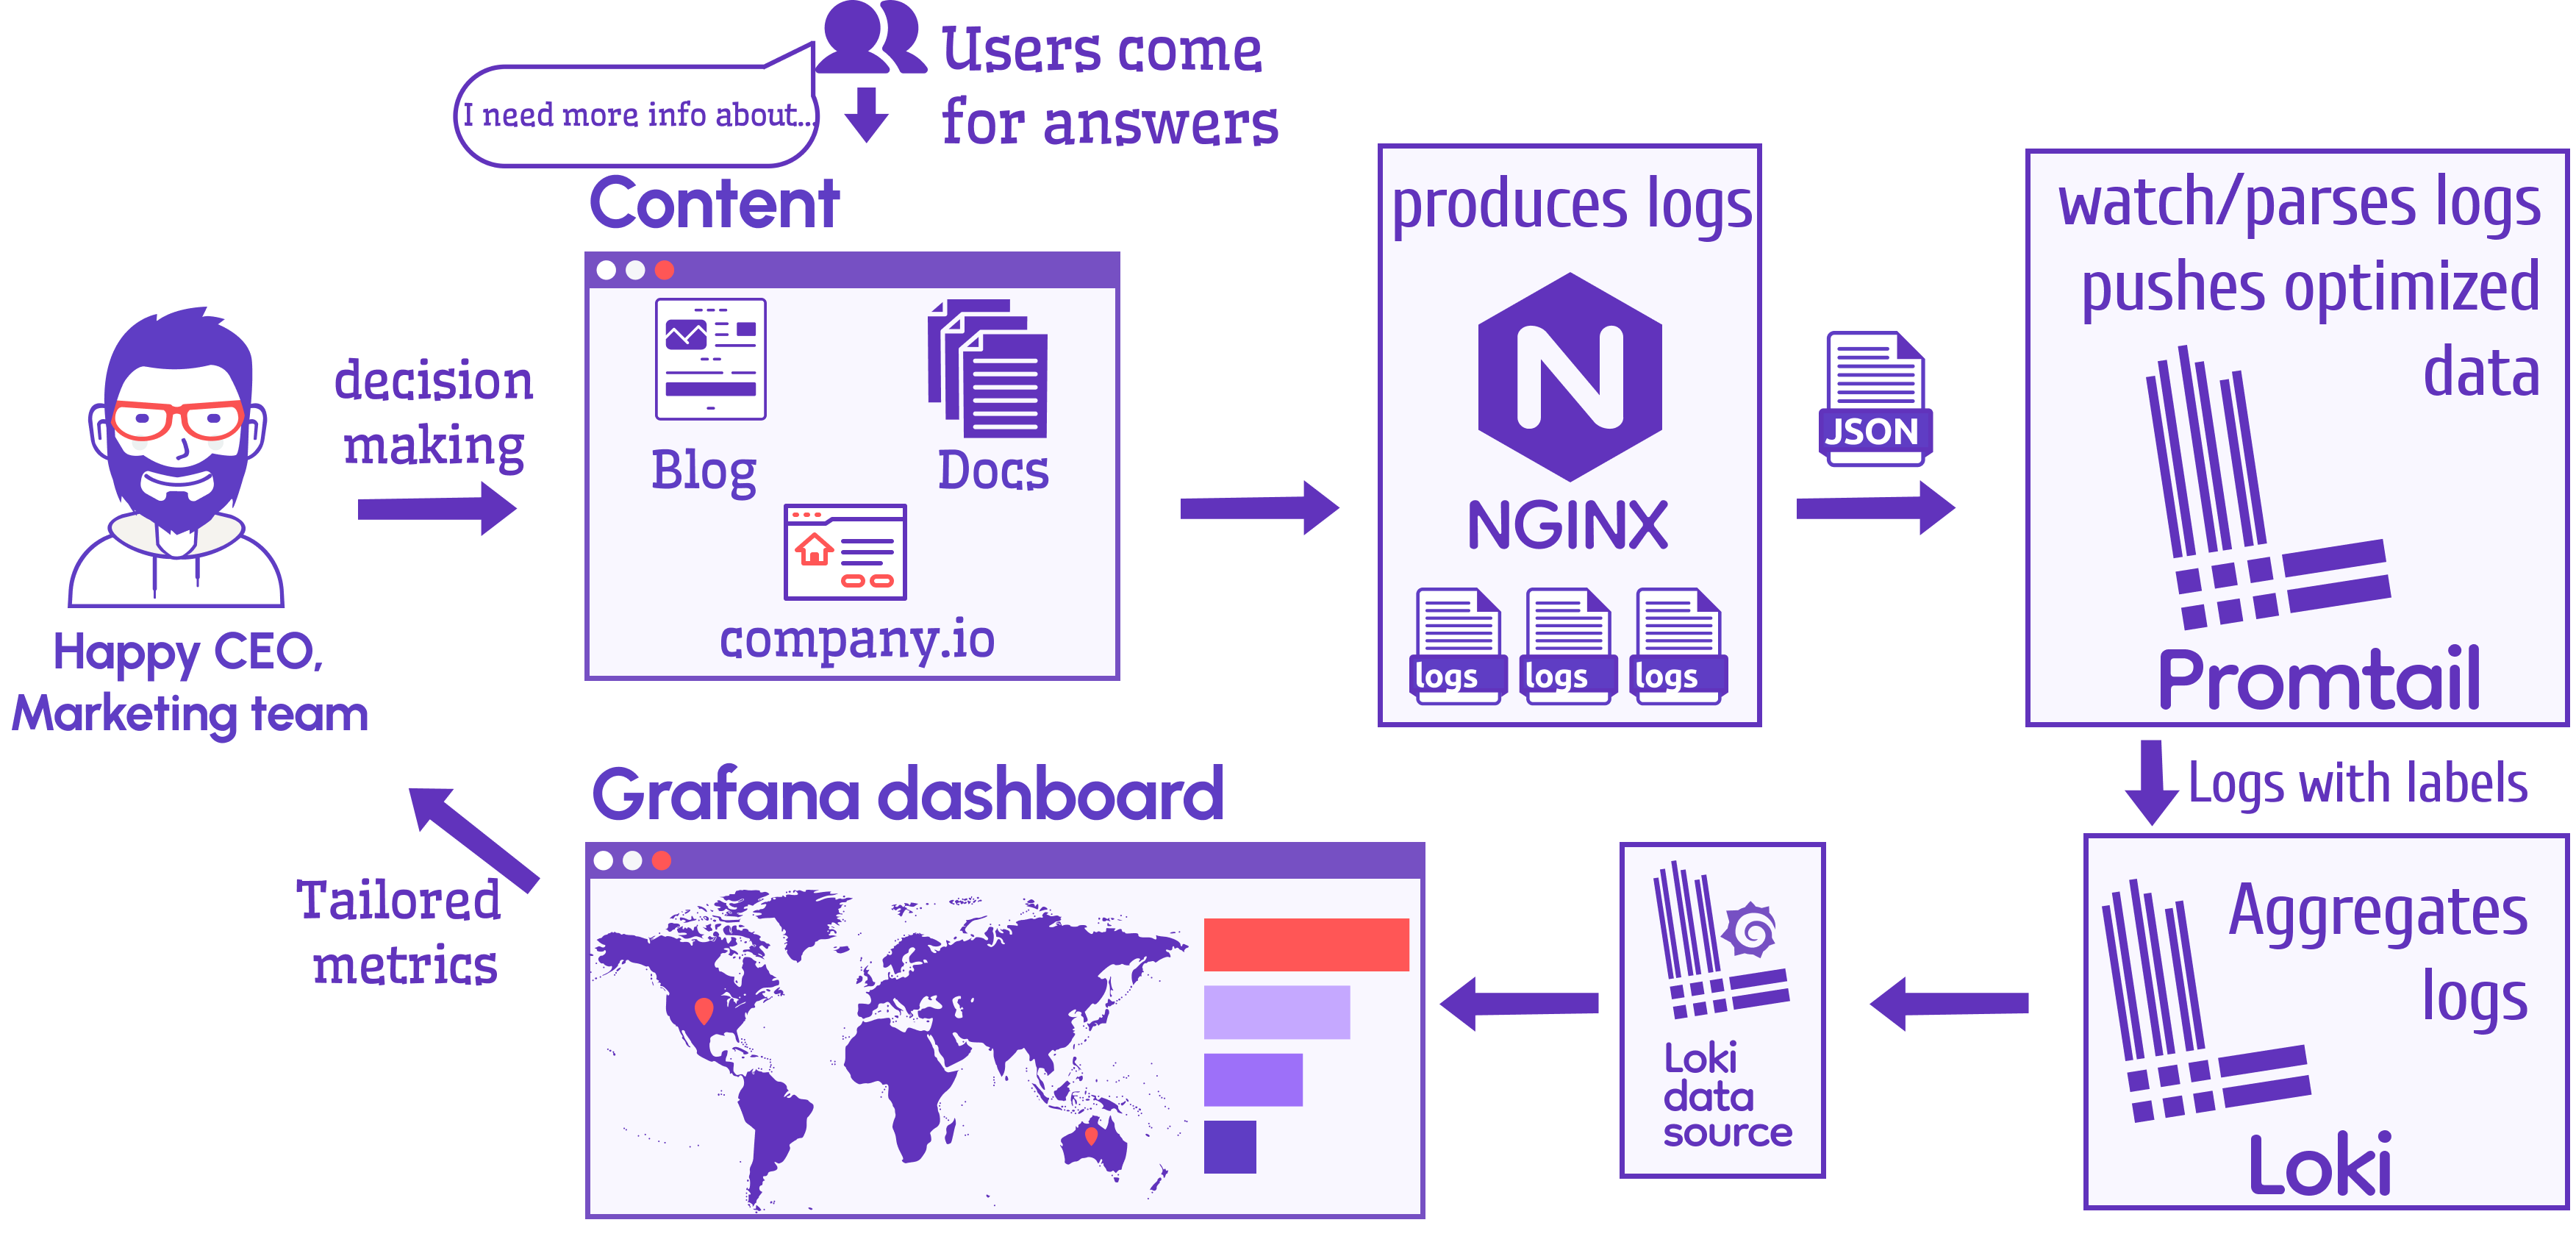
Before diving into a new topic and creating a step-by-step tutorial, I like to look at the system architecture from up high and understand how all parts interact and coexist with each other. As a result, most of the time, we come up with an astonishing schema that explains far from trivial processes.
As a nice bonus, our schemas are great memory refreshers when you go back to the subject after being focused on something else.
 |  |
Tutorials and use cases
Tutorials are the backbone of our channel. Those videos get the most views and questions. We always try to find relevant to many scenarios and ensure anyone can follow along and learn the topic as they go.
Some tutorials are best when done on solid use cases. Anything that we explain you can easily recreate on your side. A lot of pieces can be downloaded from our GitHub organization. And be certain, all your questions are going to be answered!
We are thankful to be part of a growing, vibrant Grafana community. We wholeheartedly believe in Grafana and its vast potential.
It amazes us almost every time to hear another use case solved. A variety of industries and the number of countries that share our praises for Grafana are off the charts. We are at the right place and time, no stopping, just moving forward! Charge!!!!
Always happy to hear from you
Join the Conversation: Subscribe to our YouTube Channel and leave your comments.