Chart.js
Chart.js is one of the popular open source charting libraries. The Business Text plugin makes using chart.js in Grafana possible!
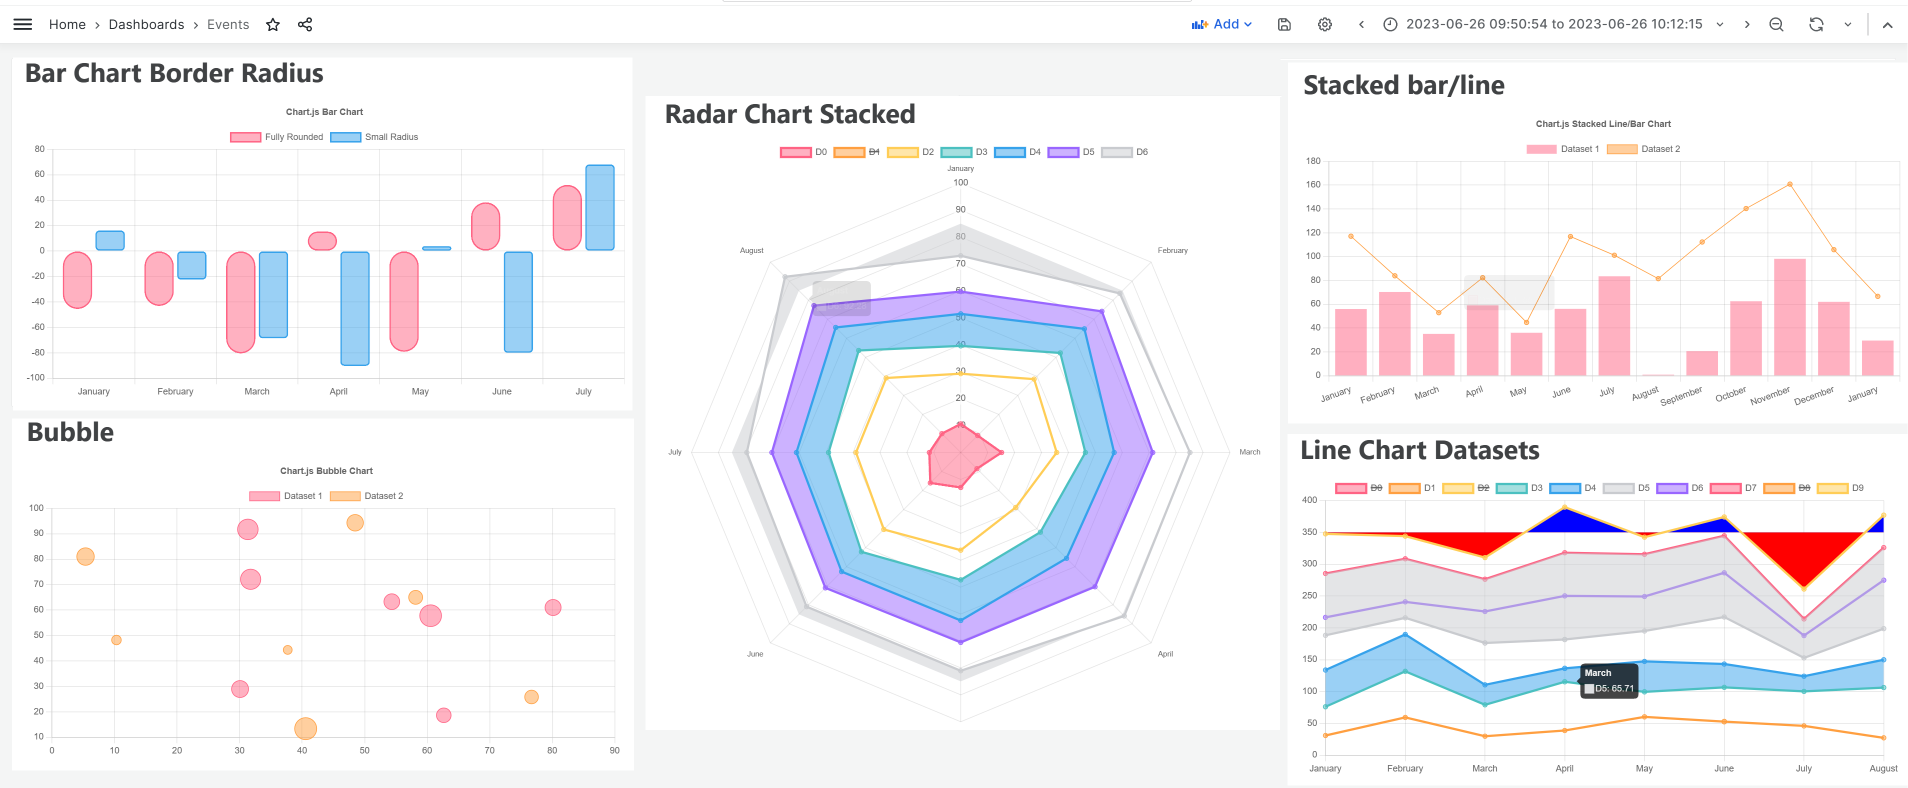
Example
Use the following external library
https://esm.sh/chart.js
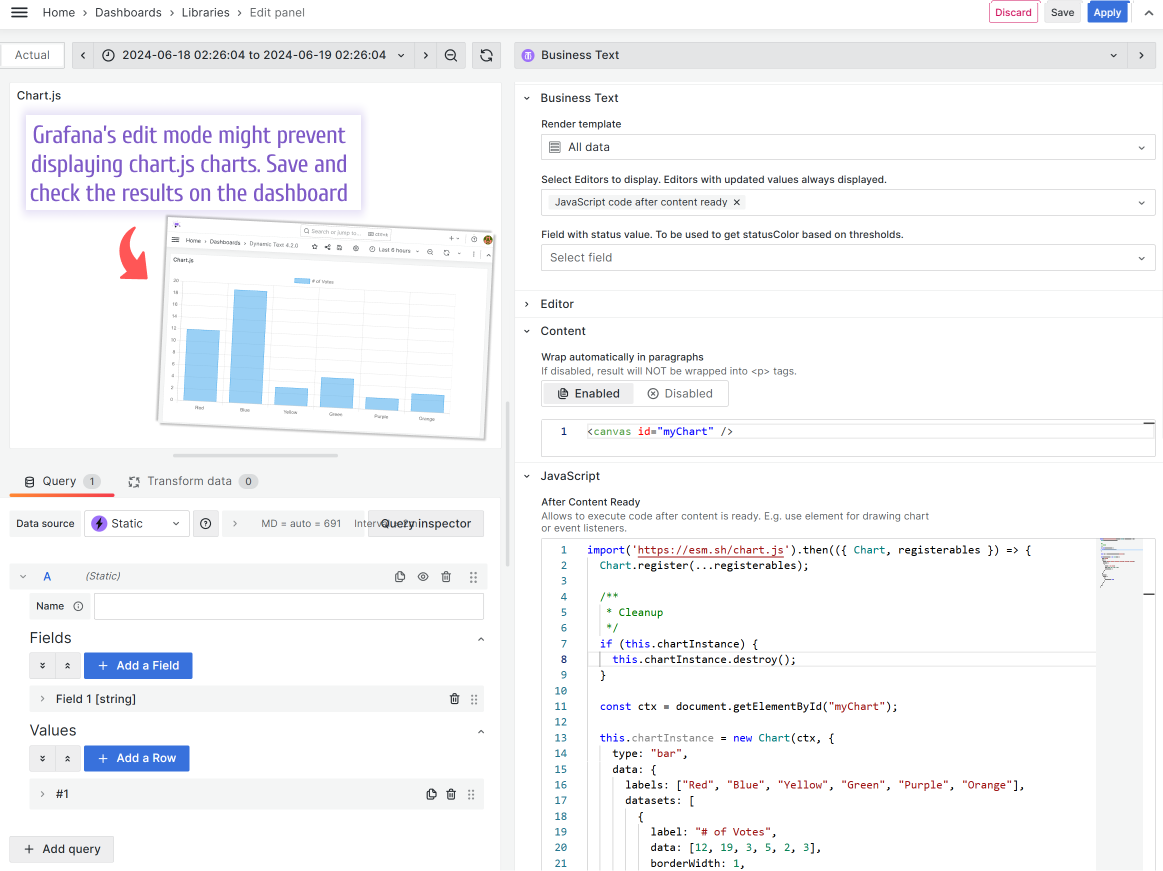
Code to copy
Use the following for the Content:
<canvas id="myChart" />
After Content Ready
Version mismatch
Plug-in libraries may change their versions and the code in the example may not work or cause an error.
Use the following for the JavaScript->After Content Ready:
import("https://esm.sh/chart.js").then(({ Chart, registerables }) => {
  Chart.register(...registerables);

  /**
   * Cleanup
   */
  if (this.chartInstance) {
    this.chartInstance.destroy();
  }

  const ctx = document.getElementById("myChart");

  this.chartInstance = new Chart(ctx, {
    type: "bar",
    data: {
      labels: ["Red", "Blue", "Yellow", "Green", "Purple", "Orange"],
      datasets: [
        {
          label: "# of Votes",
          data: [12, 19, 3, 5, 2, 3],
          borderWidth: 1,
        },
      ],
    },
    options: {
      scales: {
        y: {
          beginAtZero: true,
        },
      },
    },
  });
});