D3
Thanks to our community member Josiah Solomon for the provided solution.
Use the following external D3 libraries:
https://esm.sh/d3@7.9.0

https://esm.sh/d3-hexbin
info
Grafana's edit mode might prevent displaying D3 charts. Save and check the result on the dashboard.
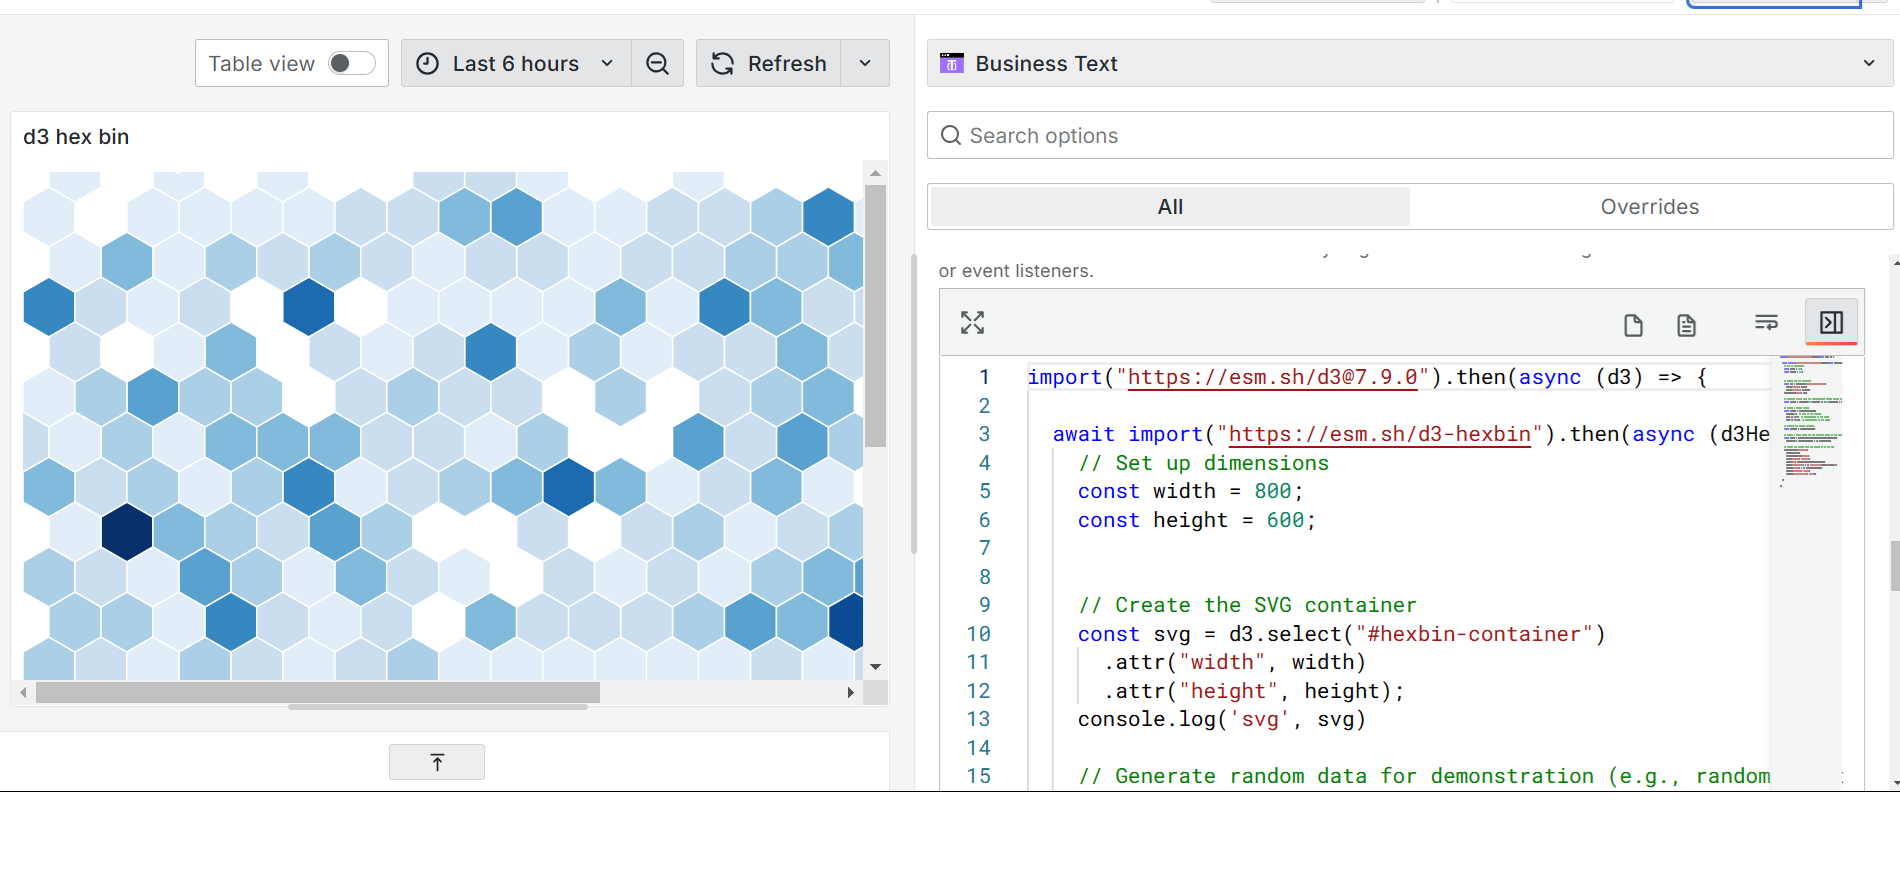
Code to copy
Into the Content or Default Content:
<svg id="hexbin-container" width="800" height="600"></svg>
After Content Ready
Version mismatch
Plug-in libraries may change their versions and the code in the example may not work or cause an error.
Into the JavaScript->After Content Ready:
import("https://esm.sh/d3@7.9.0").then(async (d3) => {
  await import("https://esm.sh/d3-hexbin").then(async (d3Hexbin) => {
    // Set up dimensions
    const width = 800;
    const height = 600;

    // Create the SVG container
    const svg = d3
      .select("#hexbin-container")
      .attr("width", width)
      .attr("height", height);
    console.log("svg", svg);

    // Generate random data for demonstration (e.g., random points)
    const points = d3
      .range(1000)
      .map(() => [Math.random() * width, Math.random() * height]);

    // Create a hexbin layout
    const hexbin = d3Hexbin
      .hexbin()
      .radius(20) // Size of the hexagon
      .x((d) => d[0]) // X-coordinate of the point
      .y((d) => d[1]); // Y-coordinate of the point

    // Compute the hexbin clusters
    const hexbins = hexbin(points);

    // Create a color scale for the hexagons based on the number of points in each bin
    const color = d3
      .scaleSequential(d3.interpolateBlues)
      .domain([0, d3.max(hexbins, (d) => d.length)]);

    // Create the hexbin path and append it to the SVG
    svg
      .selectAll(".hexbin")
      .data(hexbins)
      .enter()
      .append("path")
      .attr("class", "hexbin")
      .attr("d", hexbin.hexagon())
      .attr("transform", (d) => `translate(${d.x},${d.y})`)
      .style("fill", (d) => color(d.length))
      .style("stroke", "#fff")
      .style("stroke-width", "1px");
  });
});