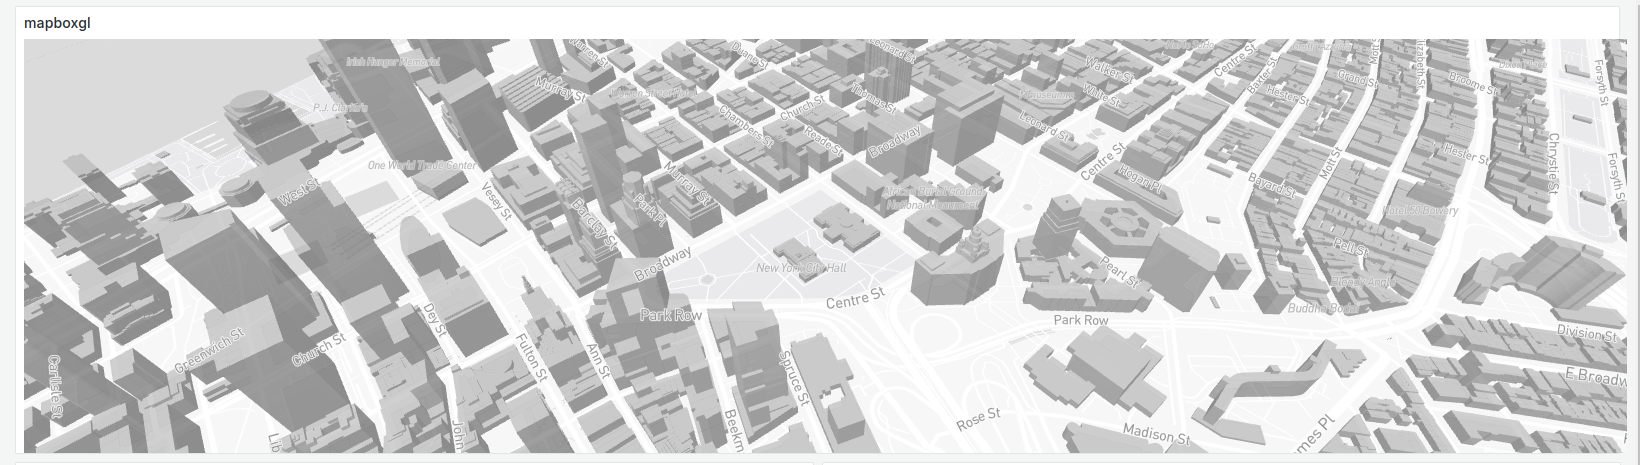
Mapbox GL
This is another great example of external resource usage in the Business Text Plugin. The idea comes from Josiah Solomon.
Follow the below outlined steps to display Mapbox GL JS on your Grafana dashboard.
Content
<div id="map" />
After Content Ready
Version mismatch
Plug-in libraries may change their versions and the code in the example may not work or cause an error.
Use the following for the JavaScript->After Content Ready:
import("https://cdn.jsdelivr.net/npm/mapbox-gl@3.5.1/+esm").then(
  ({ default: mapboxGl }) => {
    console.log("mapboxgl", mapboxGl);

    mapboxGl.accessToken = "TOKEN";
    const map = new mapboxGl.Map({
      // Choose from Mapbox's core styles, or make your own style with Mapbox Studio
      style: "mapbox://styles/mapbox/light-v11",
      center: [-74.0066, 40.7135],
      zoom: 15.5,
      pitch: 45,
      bearing: -17.6,
      container: "map",
      antialias: true,
    });

    map.on("style.load", () => {
      // Insert the layer beneath any symbol layer.
      const layers = map.getStyle().layers;
      const labelLayerId = layers.find(
        (layer) => layer.type === "symbol" && layer.layout["text-field"]
      ).id;

      // The 'building' layer in the Mapbox Streets
      // vector tileset contains building height data
      // from OpenStreetMap.
      map.addLayer(
        {
          id: "add-3d-buildings",
          source: "composite",
          "source-layer": "building",
          filter: ["==", "extrude", "true"],
          type: "fill-extrusion",
          minzoom: 15,
          paint: {
            "fill-extrusion-color": "#aaa",

            // Use an 'interpolate' expression to
            // add a smooth transition effect to
            // the buildings as the user zooms in.
            "fill-extrusion-height": [
              "interpolate",
              ["linear"],
              ["zoom"],
              15,
              0,
              15.05,
              ["get", "height"],
            ],
            "fill-extrusion-base": [
              "interpolate",
              ["linear"],
              ["zoom"],
              15,
              0,
              15.05,
              ["get", "min_height"],
            ],
            "fill-extrusion-opacity": 0.6,
          },
        },
        labelLayerId
      );
    });
  }
);