
Import JavaScript

Version

Since in Grafana 11, the functionality of external JavaScript resources is deprecated, we removed the External Resource->Scripts parameter. You can import the JavaScript library directly in the code.
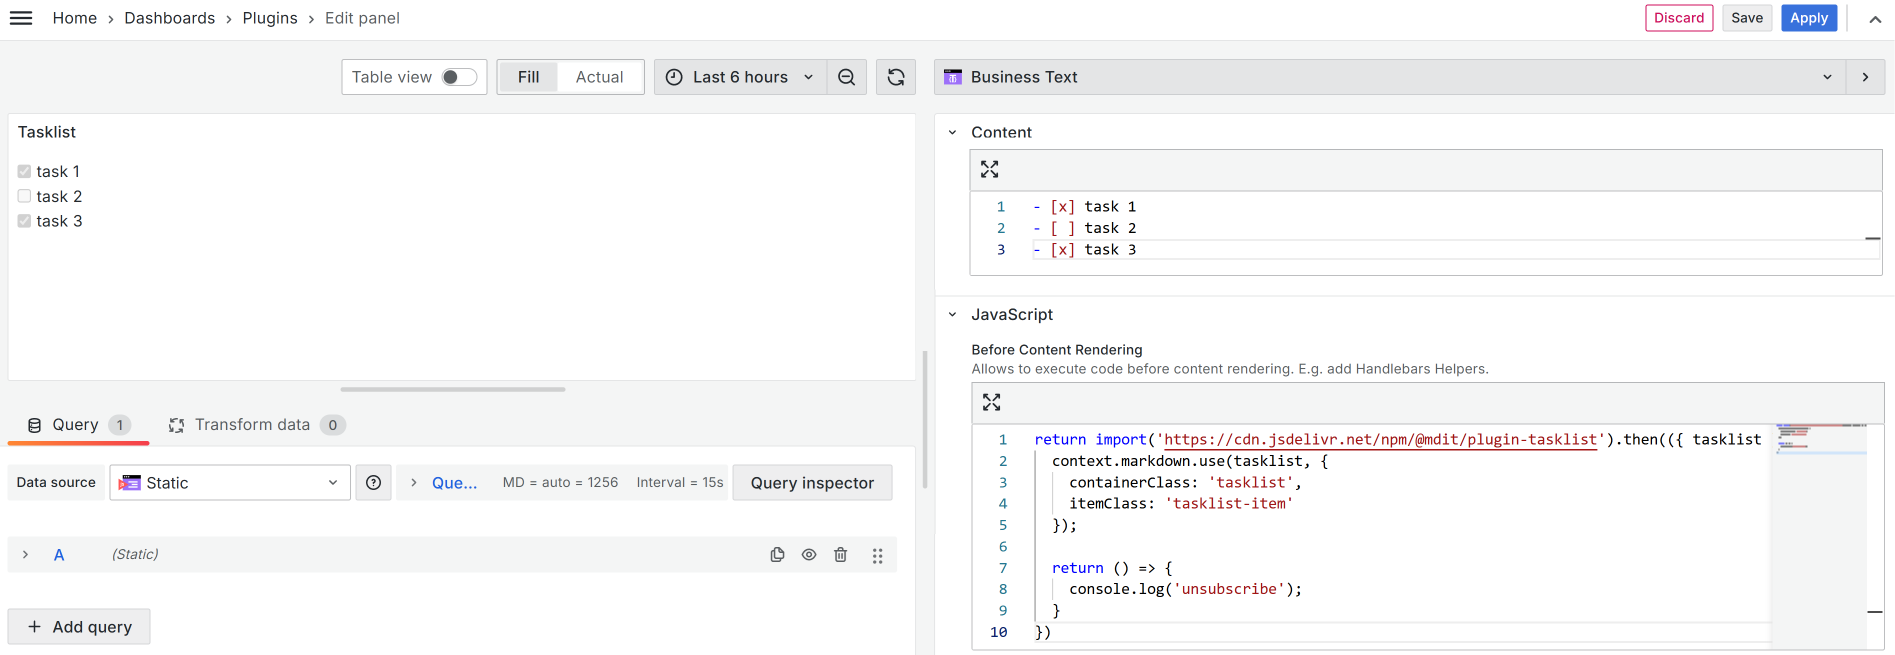
The Business Text Panel enables the loading of additional JavaScript using external URLs like CDN (Content Delivery Network).

Use that functionality to execute JavaScript functions in the JavaScript Code editor.

To prevent the loading of third-party URLs, you can store CSS and JS files in the public folder on your Grafana instance. - On any external Grafana instance https://GRAFANA-URL/public/grafanaCSS.css - Or on local Grafana instance /public/grafanaCSS.css

External JavaScript resources

Below, you can find a collection of breathtaking use cases, the perfect examples of using external JavaScript libraries in the Business Text plugin.

Render template parameter

Use All rows or All data template to execute template only once. With Every row, the Content will be applied to every row of retrieved data. Even though the data frames of the specified data source are not used, still the plugin runs the code as many times as the number of rows is retrieved.

Plotly 3D Scatter

Thanks to our community member Josiah Solomon for the provided solution.

Use the following external Plotly's 3D Scatter chart library:

https://esm.sh/plotly.js-dist-min
info

Grafana's edit mode might prevent displaying Plotly charts. Save and check the result on the dashboard.

Plotly chart displayed using the Business Text Panel.

Code to copy

Into the Content or Default Content:

<div id="plotly-chart" />

Into the JavaScript->After Content Ready:

JavaScript code for Plotly example
const unpack = (rows, key) => {
return rows.map(function (row) {
return row[key];
});
};

const csvToJson = (data, delimiter = ",") => {
const titles = data.slice(0, data.indexOf("\r\n")).split(delimiter);
return data
.slice(data.indexOf("\n") + 1)
.split("\r\n")
.map((v) => {
const values = v.split(delimiter);
return titles.reduce(
(obj, title, index) => ((obj[title] = values[index]), obj),
{}
);
});
};

/**
* Load plotly
*/
import("https://esm.sh/plotly.js-dist-min").then(
async ({ default: Plotly }) => {
let url =
"https://raw.githubusercontent.com/plotly/datasets/master/3d-scatter.csv";

let fetchData = await fetch(url);
let csvData = await fetchData.text();
let rows = csvToJson(csvData);

var trace1 = {
x: unpack(rows, "x1"),
y: unpack(rows, "y1"),
z: unpack(rows, "z1"),
mode: "markers",
marker: {
size: 12,
line: {
color: "rgba(217, 217, 217, 0.14)",
width: 0.5,
},
opacity: 0.8,
},
type: "scatter3d",
};

var trace2 = {
x: unpack(rows, "x2"),
y: unpack(rows, "y2"),
z: unpack(rows, "z2"),
mode: "markers",
marker: {
color: "rgb(127, 127, 127)",
size: 12,
symbol: "circle",
line: {
color: "rgb(204, 204, 204)",
width: 1,
},
opacity: 0.8,
},
type: "scatter3d",
};

var data = [trace1, trace2];

var layout = {
margin: {
l: 0,
r: 0,
b: 0,
t: 0,
},
};

var config = { responsive: true };

Plotly.newPlot("plotly-chart", data, layout, config);
}
);

Mermaid

Mermaid is a popular JavaScript-based diagramming and charting tool that dynamically creates and modifies diagrams using Markdown-defined text definitions.

info

Previously we maintained two Business text (old name Dynamic Text) plugin builds. One with embedded Mermaid Library and the other without.

The main reason being the Mermaid Library size. After we added the External Resources feature, the need to maintain two builds has vanished. Now, anyone who needs the Mermaid library can simply import it as an external resource.

Mermaid diagrams displayed using the Business Text Panel.

Example

Mermaid diagrams example.

Use the following external library

https://esm.sh/mermaid

Code to copy

Use the following for the Content (when your data source is set to return something) or in the Default Content (when your data source returns nothing):

<pre class="mermaid">
graph LR
A --- B
B-->C[fa:fa-ban {{data.0.test}}]
B-->D(fa:fa-spinner);
</pre>

Use the following for the JavaScript->After Content Ready:

import("https://esm.sh/mermaid").then(({ default: mermaid }) => {
mermaid.initialize({ startOnLoad: true });

mermaid.run({
querySelector: ".mermaid",
suppressErrors: false,
});
});

Chart.js

Chart.js is one of the popular open source charting libraries. The Business Text plugin makes using chart.js in Grafana possible!

Chart.js diagrams displayed using the Business Text Panel.

Example

Chart.js diagram example.

Use the following external library

https://esm.sh/chart.js

Code to copy

Use the following for the Content:

<canvas id="myChart" />

Use the following for the JavaScript->After Content Ready:

import("https://esm.sh/chart.js").then(({ Chart, registerables }) => {
Chart.register(...registerables);

/**
* Cleanup
*/
if (this.chartInstance) {
this.chartInstance.destroy();
}

const ctx = document.getElementById("myChart");

this.chartInstance = new Chart(ctx, {
type: "bar",
data: {
labels: ["Red", "Blue", "Yellow", "Green", "Purple", "Orange"],
datasets: [
{
label: "# of Votes",
data: [12, 19, 3, 5, 2, 3],
borderWidth: 1,
},
],
},
options: {
scales: {
y: {
beginAtZero: true,
},
},
},
});
});

Flowchart

Thank you Josiah Solomon for exploring an epic Flowchart return to Grafana! We are happy to share your example with the world.

Below you can find how the beloved by many Flowchart libraries can be implemented using the Business Text plugin.

Simply, import two external libraries and then write your code addressing the Flowchart libraries directly.

Example

Delivering Flowchart libraries to a Grafana dashboard using the Business Text plugin.

External Resources

https://esm.sh/flowchart.js
https://esm.sh/raphael

Content to copy

<div id="flowchart" />

Use the following for the JavaScript->After Content Ready:

import("https://esm.sh/flowchart.js").then(async (flowchart) => {
await import("https://esm.sh/raphael");

/**
* Cleanup
*/
document.getElementById("flowchart").innerHTML = "";

const flow = `
st=>start: Start:>http://www.google.com[blank]
e=>end:>http://www.google.com
op1=>operation: My Operation
sub1=>subroutine: My Subroutine
cond=>condition: Yes
or No?:>http://www.google.com
io=>inputoutput: catch something...
para=>parallel: parallel tasks
in=>input: some in
out=>output: some out

st->op1->cond
cond(yes)->io->e
cond(no)->para
para(path1, bottom)->sub1(right)->op1
para(path2, top)->op1
para(path3, right)->in->out->e`;

const diagram = flowchart.parse(flow);
diagram.drawSVG("flowchart");
});

Youtube video

This idea comes from the GitHub issue opened by Raphealtony. The Business Text plugin can be used to display YouTube videos on your Grafana dashboard.

How to configure the Business Text plugin to display a YouTube video.

External Resources

https://www.youtube.com/iframe_api

Content to copy

<h1>Volkov Labs Latest videos</h1>
<div id="player"></div>

Use the following for the JavaScript->After Content Ready:

import("https://esm.sh/youtube-player").then(({ default: YouTubePlayer }) => {
const player = YouTubePlayer("player");

const videoList = ["AcQi-6GCrNU", "1ogv2jstrlI", "vky-7-DfvXE"];

const randomVideoId = videoList[Math.floor(Math.random() * videoList.length)];

player.loadVideoById(randomVideoId);
});

Leaflet.js interactive maps

This is another great example of external resource usage in the Business Text Plugin. The idea comes from BlinderMiri and Josiah Solomon. Follow the below outlined steps to display Leaflet.js maps on your Grafana dashboard.

How to configure the Business Text plugin to display Leaflet.js maps.

The map on the dashboard from this example looks like in the illustration below.

The Leaflet.js map on the dashboard.

Data to copy

In this example, we use the Business Input Data Source.

{   "type": "Feature",   "geometry": {     "type": "Point",     "coordinates": [125.6, 10.1]   },   "properties": {     "name": "Dinagat Islands"   } }

Content

<div id="leaflet" />

Use the following for the JavaScript->After Content Ready:

// This data is coming from the data source.
// const geojson = JSON.parse(context.data[0][0].data);

import("https://esm.sh/leaflet").then(({ default: L }) => {
/**
* Cleanup
*/
if (this.map) {
this.map.remove();
}

const map = L.map("leaflet").setView([9.024857, 38.737607], 13);
this.map = map;

L.tileLayer("https://{s}.tile.openstreetmap.org/{z}/{x}/{y}.png", {
attribution:
'Map data &copy; <a href="https://www.openstreetmap.org/">OpenStreetMap</a> contributors',
maxZoom: 18,
}).addTo(map);

//if you want to use inline data
const geojson = {
type: "FeatureCollection",
crs: {
type: "name",
properties: { name: "urn:ogc:def:crs:OGC:1.3:CRS84" },
},
features: [
{
type: "Feature",
properties: { AOIs: "bbb", daily: "33" },
geometry: {
type: "Polygon",
coordinates: [
[
[33.5, 32.0],
[33.5, 29.0],
[36.0, 29.0],
[36.0, 27.5],
[33.5, 27.5],
[32.5, 27.5],
[29.0, 27.5],
[29.0, 32.0],
[33.5, 32.0],
],
],
},
},
{
type: "Feature",
properties: { AOIs: "aaa", daily: "23" },
geometry: {
type: "Polygon",
coordinates: [
[
[34.5, 32.5],
[36.0, 32.5],
[36.0, 29.0],
[33.5, 29.0],
[33.5, 32.0],
[33.5, 32.5],
[34.5, 32.5],
],
],
},
},
],
};

var myStyle = {
color: "black",
weight: 10,
};

var geojsonLayer = L.geoJSON(geojson).addTo(map);
});

External CSS file

https://unpkg.com/leaflet@1.9.4/dist/leaflet.css

CSS styles

#leaflet {
height: 480px;
display: flex;
flex-direction: row;
}

Tailwind CSS

Thank you Raghavendra Samant for exploring a utility-first framework Tailwind CSS. Using Tailwind in the Business Text panel differs slightly from the previous examples.

The Business Text panel with Tailwind styles on the dashboard.

To prevent CORS issues we recommend adding Tailwind script to the Grafana's public folder /usr/share/grafana/public/yourFileName.js.

The file can contain the import function and use Tailwind, or it can load code from cdn.tailwindcss.com.

CDN based code

Create a tailwind.js file with the code from cdn.tailwindcss.com and upload it to /usr/share/grafana/public/ in the Docker container. We used the latest version https://cdn.tailwindcss.com/3.4.4.

A Tailwind script uploaded to the Docker container.

Content

<div class="bg-gray-100 min-h-64 flex items-center justify-center">
<div class="bg-white shadow-md rounded-lg p-8 max-w-md w-full">
<h1 class="text-2xl font-bold mb-4">Welcome to Business Text</h1>
<p class="text-gray-600 mb-6">
This is a simple HTML element using the Tailwind CSS library.
</p>
<a
href="#"
class="bg-blue-500 hover:bg-blue-600 text-white font-bold py-2 px-4 rounded-md"
>Learn More</a
>
</div>
</div>

Use the following for the JavaScript->After Content Ready:

import("/public/tailwind.js");
The Business Text panel with imported Tailwind CSS.

Load Tailwind from CDN

Create a loadTailwindFromCDN.js file with the following code and upload it to the same location in the Docker container.

function loadTailwindFromCDN() {
var responseData = "";

const script = document.createElement("script");

script.src = "https://cdn.tailwindcss.com";
document.body.appendChild(script);

console.log("script" + script);
}

export default loadTailwindFromCDN;

Content

<div class="bg-gray-100 min-h-64 flex items-center justify-center">
<div class="bg-white shadow-md rounded-lg p-8 max-w-md w-full">
<h1 class="text-2xl font-bold mb-4">Welcome to Business Text</h1>
<p class="text-gray-600 mb-6">
This is a simple HTML element using the Tailwind CSS library.
</p>
<a
href="#"
class="bg-blue-500 hover:bg-blue-600 text-white font-bold py-2 px-4 rounded-md"
>Learn More</a
>
</div>
</div>

Use the following for the JavaScript->After Content Ready:

import("/public/loadTailwindFromCDN.js").then(
({ default: loadTailwindFromCDN }) => {
loadTailwindFromCDN();
}
);

Mapbox GL

This is another great example of external resource usage in the Business Text Plugin. The idea comes from Josiah Solomon.

Follow the below outlined steps to display Mapbox GL JS on your Grafana dashboard.

The Mapbox map displayed using Business Text on the dashboard.

Content

<div id="map" />

Use the following for the JavaScript->After Content Ready:

import("https://cdn.jsdelivr.net/npm/mapbox-gl@3.5.1/+esm").then(
({ default: mapboxGl }) => {
console.log("mapboxgl", mapboxGl);

mapboxGl.accessToken = "TOKEN";
const map = new mapboxGl.Map({
// Choose from Mapbox's core styles, or make your own style with Mapbox Studio
style: "mapbox://styles/mapbox/light-v11",
center: [-74.0066, 40.7135],
zoom: 15.5,
pitch: 45,
bearing: -17.6,
container: "map",
antialias: true,
});

map.on("style.load", () => {
// Insert the layer beneath any symbol layer.
const layers = map.getStyle().layers;
const labelLayerId = layers.find(
(layer) => layer.type === "symbol" && layer.layout["text-field"]
).id;

// The 'building' layer in the Mapbox Streets
// vector tileset contains building height data
// from OpenStreetMap.
map.addLayer(
{
id: "add-3d-buildings",
source: "composite",
"source-layer": "building",
filter: ["==", "extrude", "true"],
type: "fill-extrusion",
minzoom: 15,
paint: {
"fill-extrusion-color": "#aaa",

// Use an 'interpolate' expression to
// add a smooth transition effect to
// the buildings as the user zooms in.
"fill-extrusion-height": [
"interpolate",
["linear"],
["zoom"],
15,
0,
15.05,
["get", "height"],
],
"fill-extrusion-base": [
"interpolate",
["linear"],
["zoom"],
15,
0,
15.05,
["get", "min_height"],
],
"fill-extrusion-opacity": 0.6,
},
},
labelLayerId
);
});
}
);