Annotations
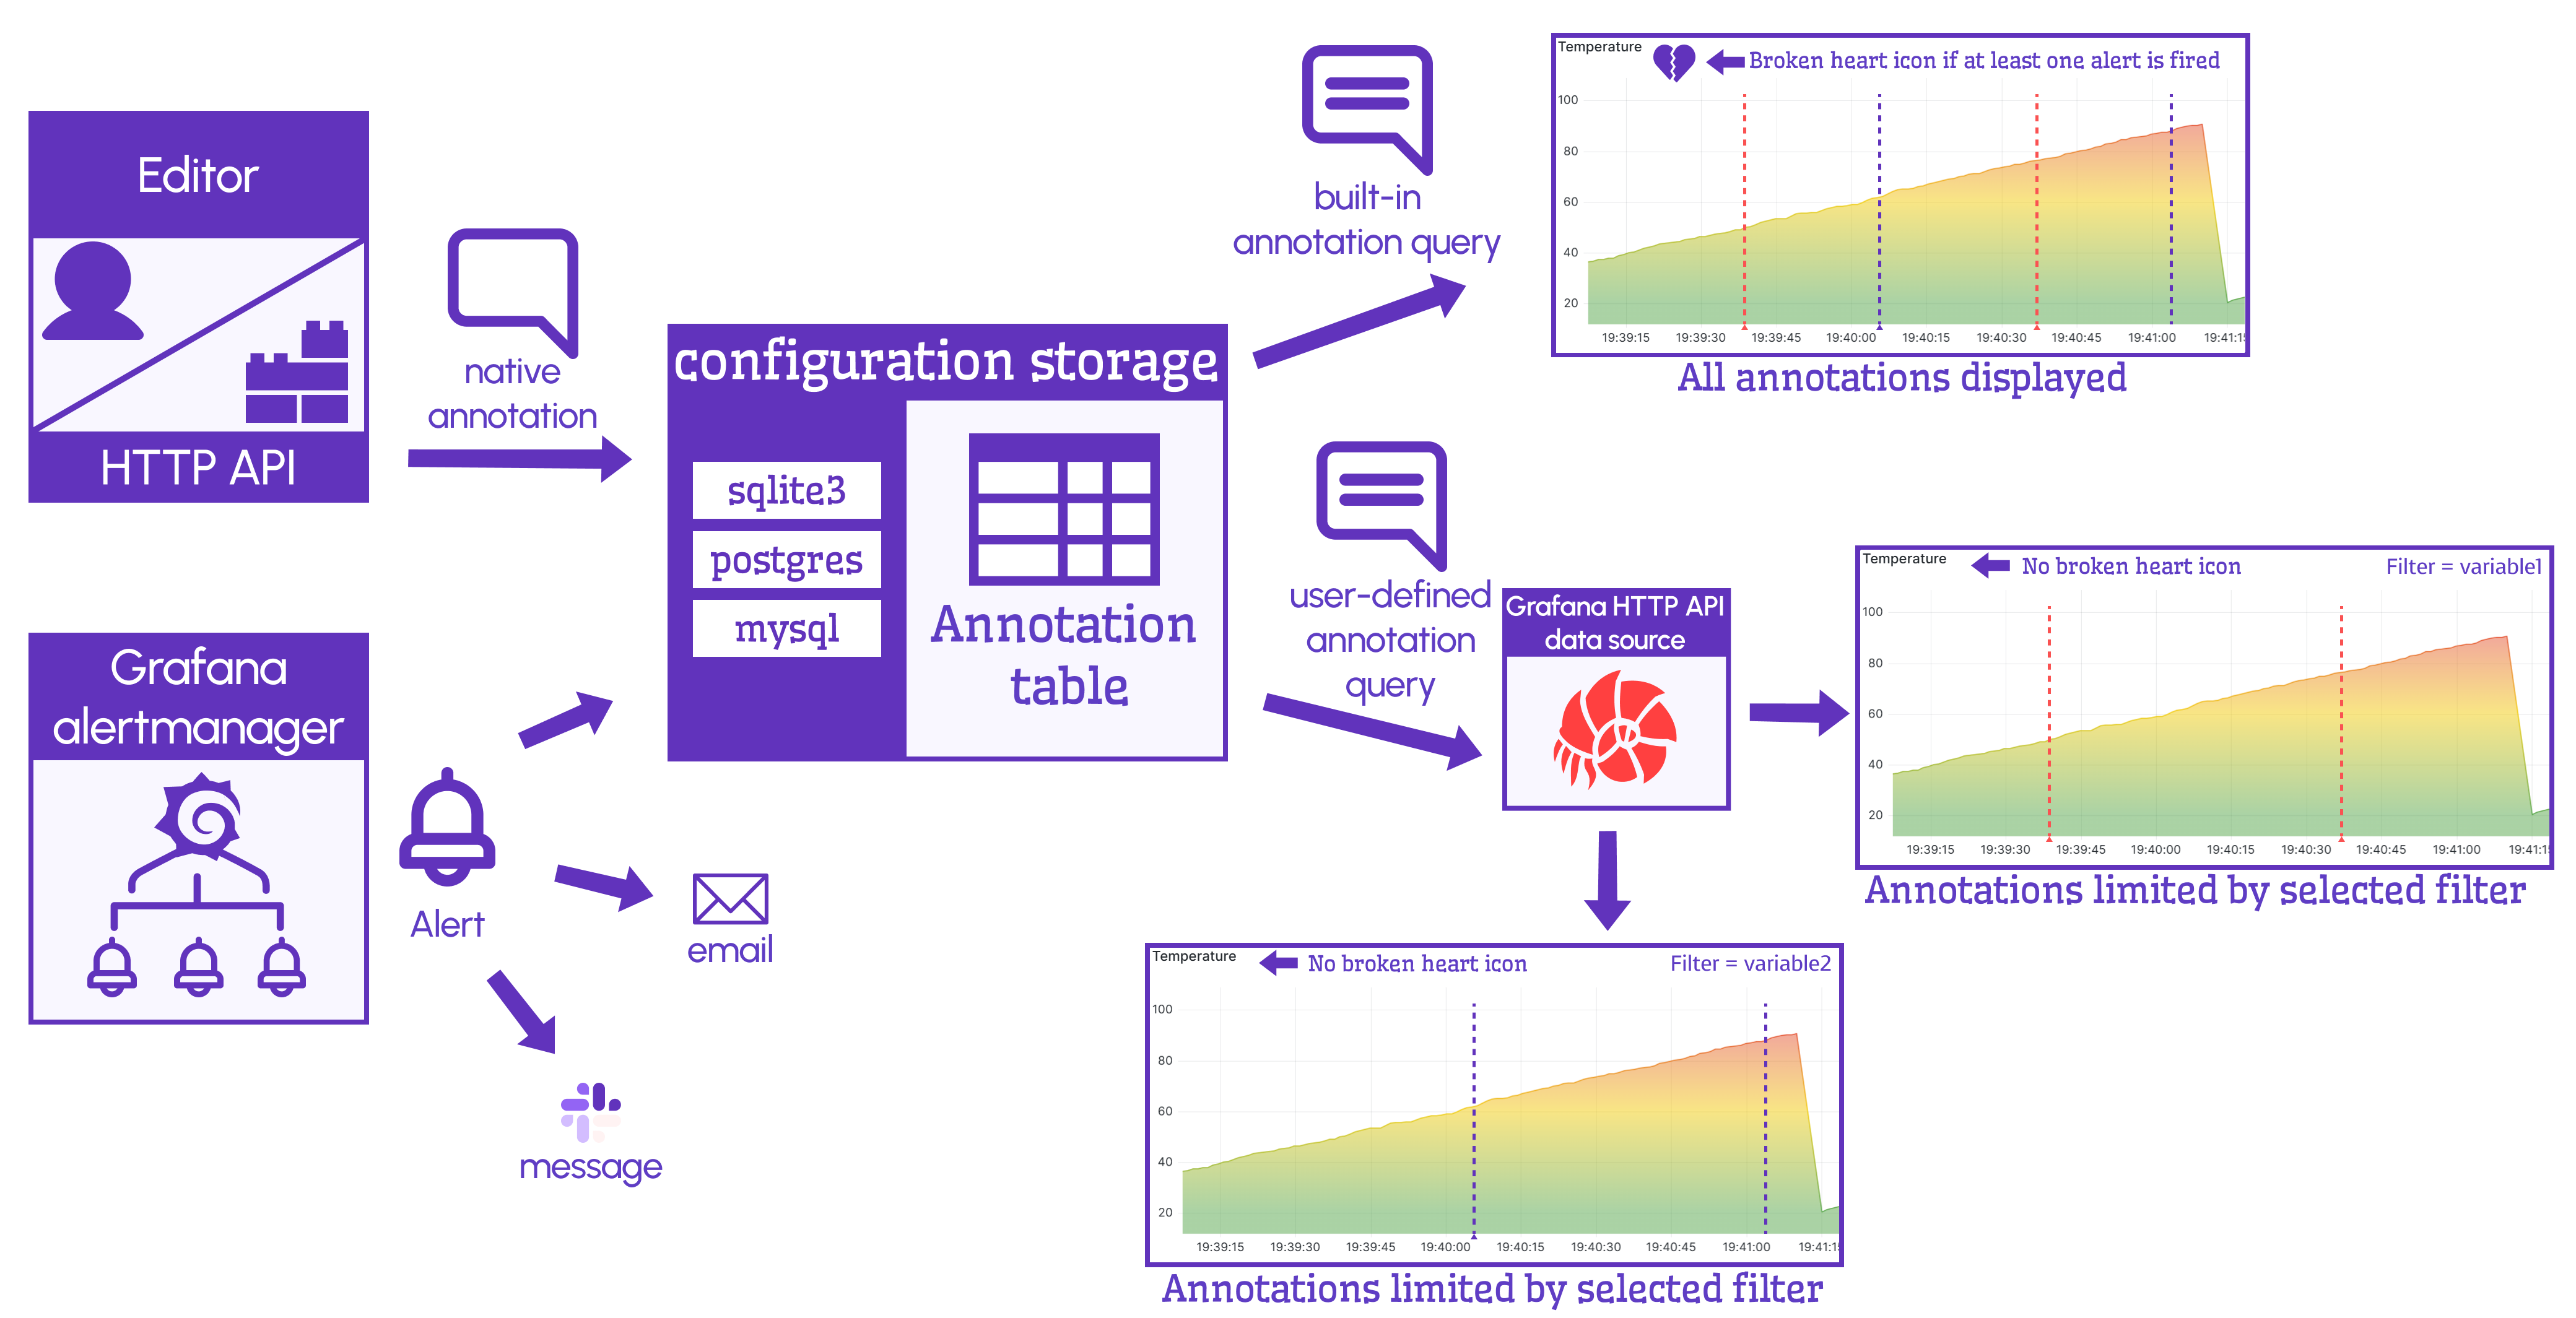
Business Satellite Data Source supports retrieving annotations to display filtered annotations and alerts from local and remote Grafana instances.
Tutorials
Annotation Types
This introductory video highlights the differences and similarities between Grafana alerts, annotations, and annotation queries.
How to and Demo
In this tutorial, we look at the concept from a data flow point of view and provide step-by-step instructions which you can follow and learn as you go.
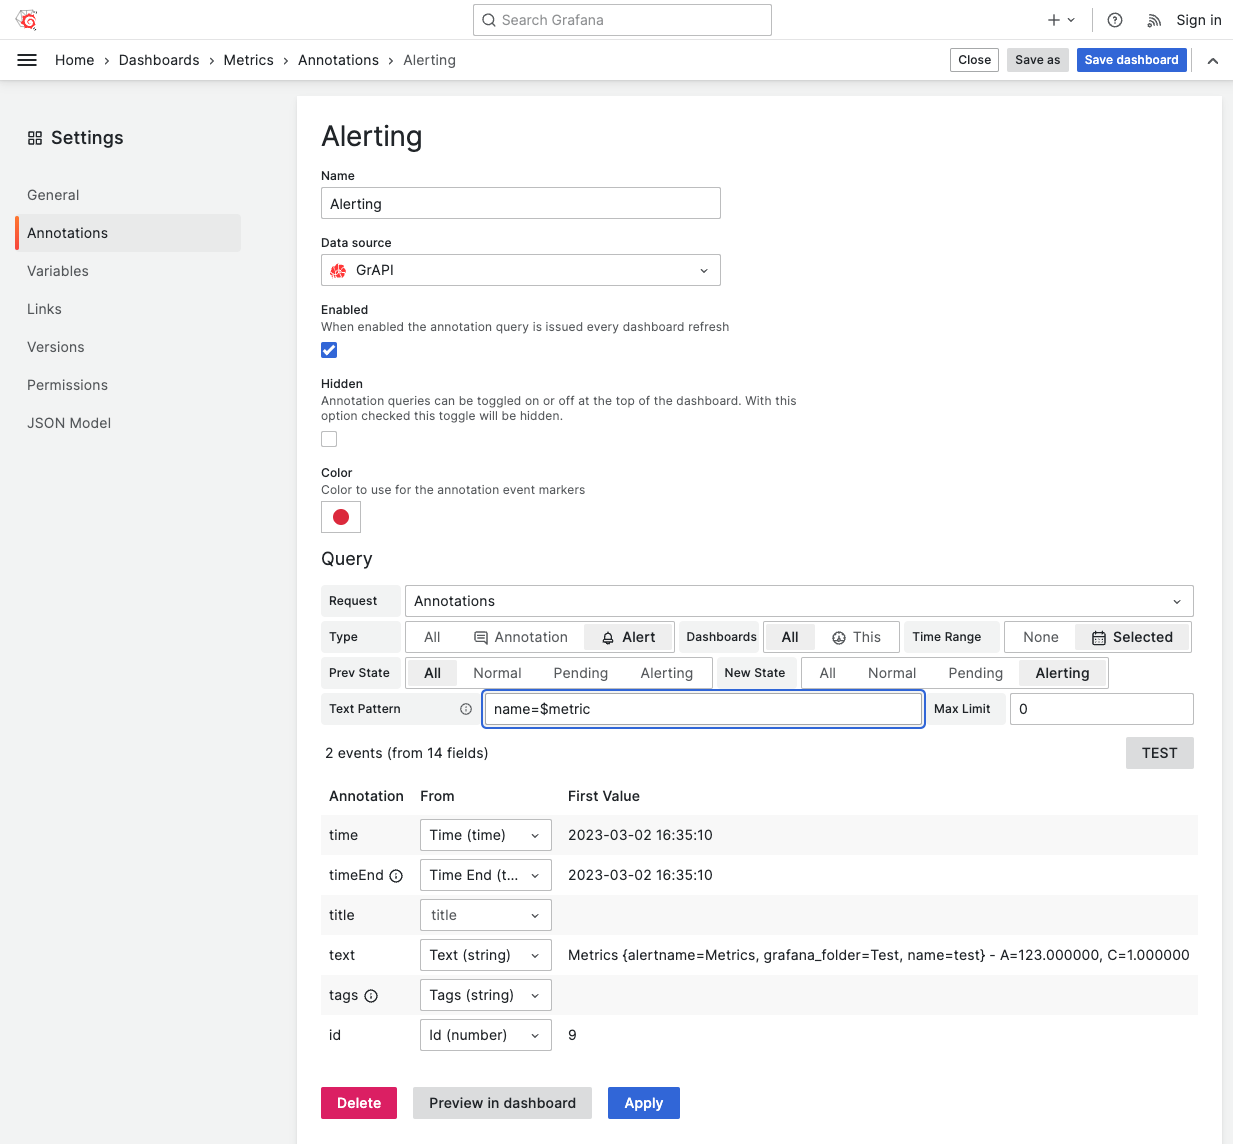
Options
| Filter | Options |
|---|---|
| Type | All, Annotation, or Alert. |
| Dashboards | All or This. |
| Time Range | None or Selected in the dashboard. |
| Prev State | All, Normal, Pending, or Alerting. |
| Next State | All, Normal, Pending, or Alerting. |
| Text Pattern | Supports Regular expressions and variables. |
| Max Limit | Maximum number of annotations to retrieve. Default 100. |
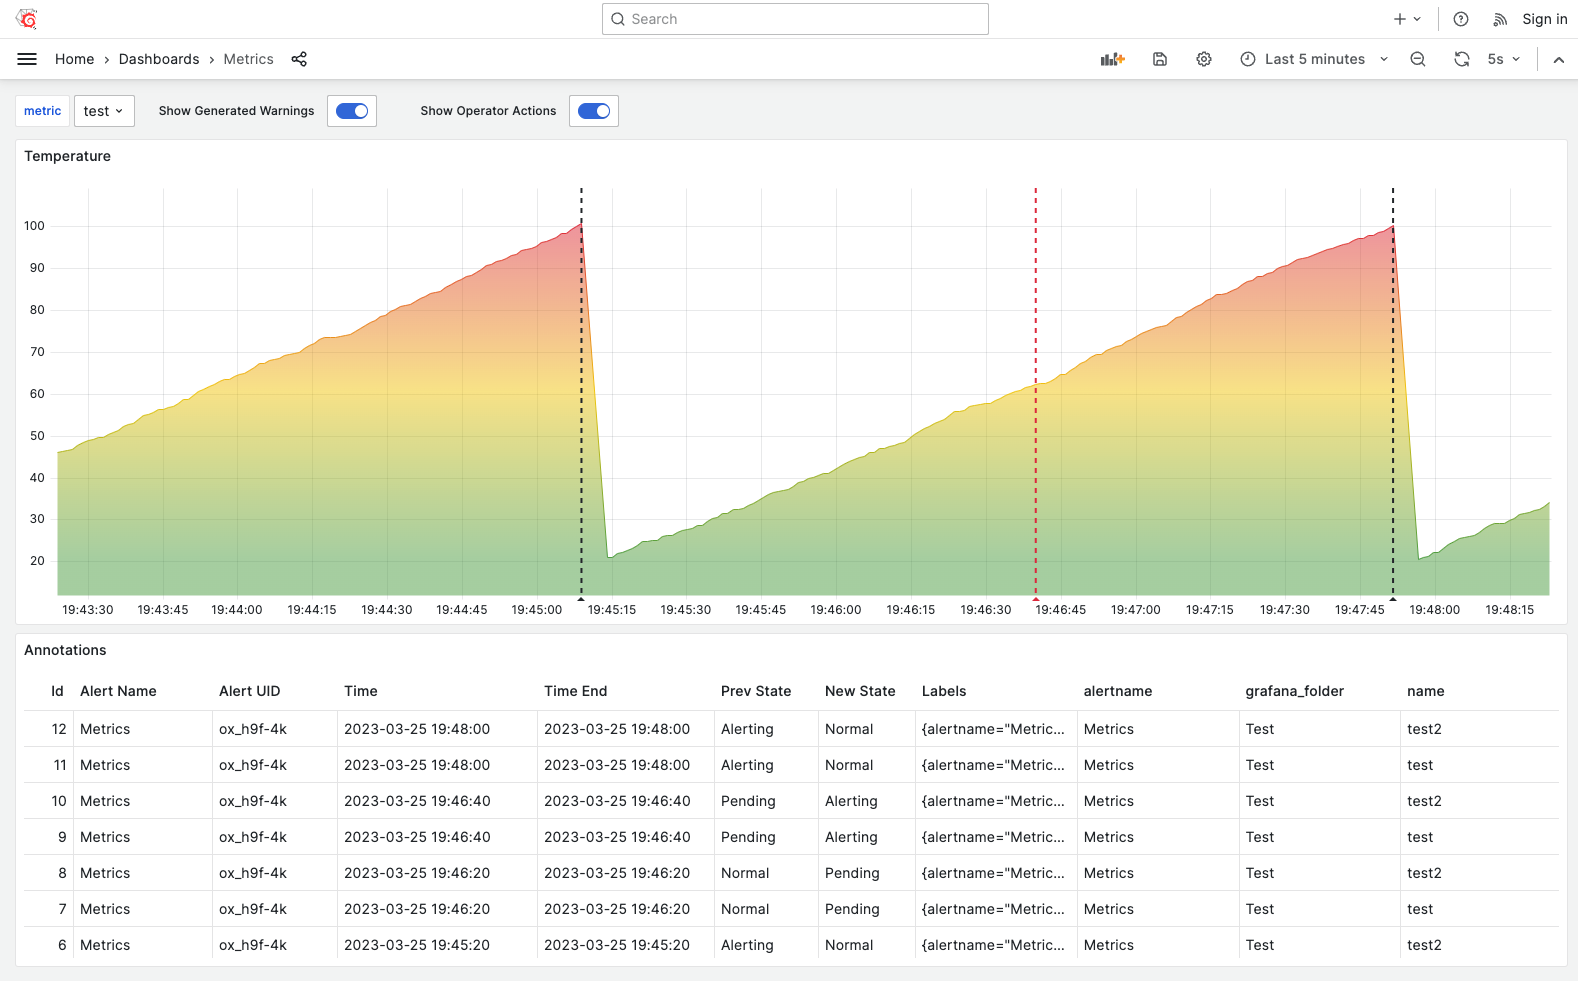
Dashboard Annotations
Alerts
Annotation List
The native Annotation List panel does not show Alerts since it's filtering annotations with a specific type.
The Business Satellite data source allows retrieving annotations and alerts to display using any available panel in your style.