Configuration
The Business Satellite Data source requires Grafana URL and a Token or API key to establish the connection to the organization and get relevant data.
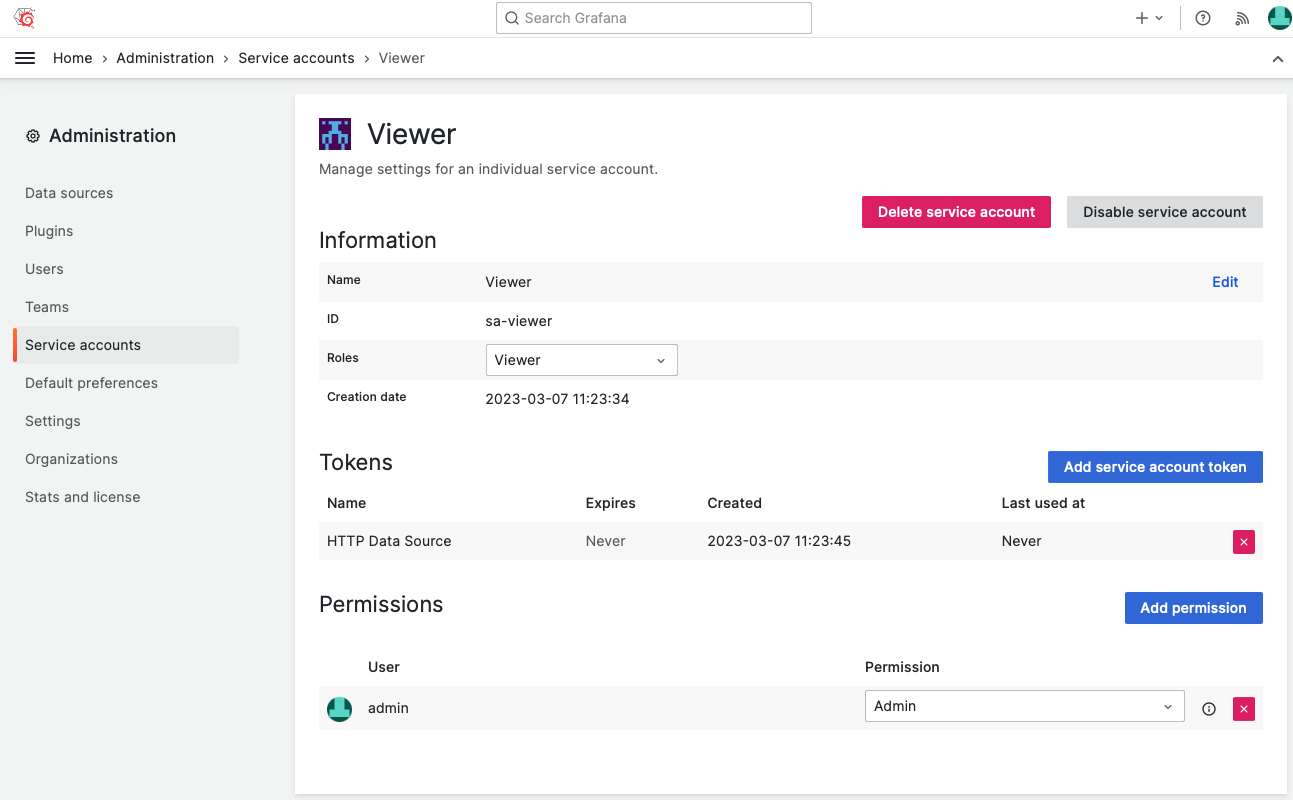
Viewer permissions may not be enough to retrieve all annotations and various data. In this case, use Editor or Administrator permissions.
Grafana URL
Grafana URL can be local or remote Grafana instance.
For the local Grafana instance running on default port 3000, the URL will look like this.
http://localhost:3000
FQDN should be provided for the remote Grafana instance. Correctly installed certificates are required to establish a secured connection using HTTPS protocol.
Authentication
The Data Source uses the internal backend proxy to avoid CORS restrictions and keep your credentials secured.
Token
The token can be generated from the Administration -> Service Accounts.
API Key
API Key can be generated from the Configuration -> API Keys.
Bad Gateway
The Bad gateway error means that Data sources are not able to reach the Grafana Server. It can be routing or misconfiguration issues.
Unknown Authority
If Grafana runs with an HTTPS port and the certificate is invalid or missing an intermediate certificate you will see the Bad Gateway error on front end.
In the Grafana logs, you will see.
level=error msg="Proxy request failed" err="x509: certificate signed by unknown authority"