Table
The Table mode provides many variations, from the simplest basic single variable view to the most loaded TreeView.
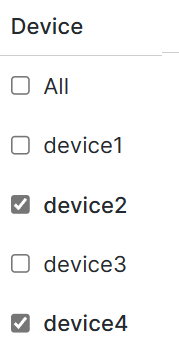
Single variable
With the minimum configuration effort, your Business Variable panel might look like a simple list to select from. Whether or not multiple selections are allowed depends on the settings you choose in the variable configuration menu. In the example below, multiple selections and the Include All option are allowed.
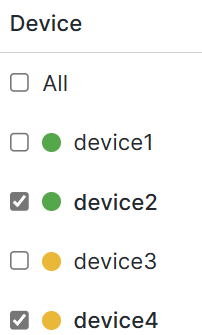
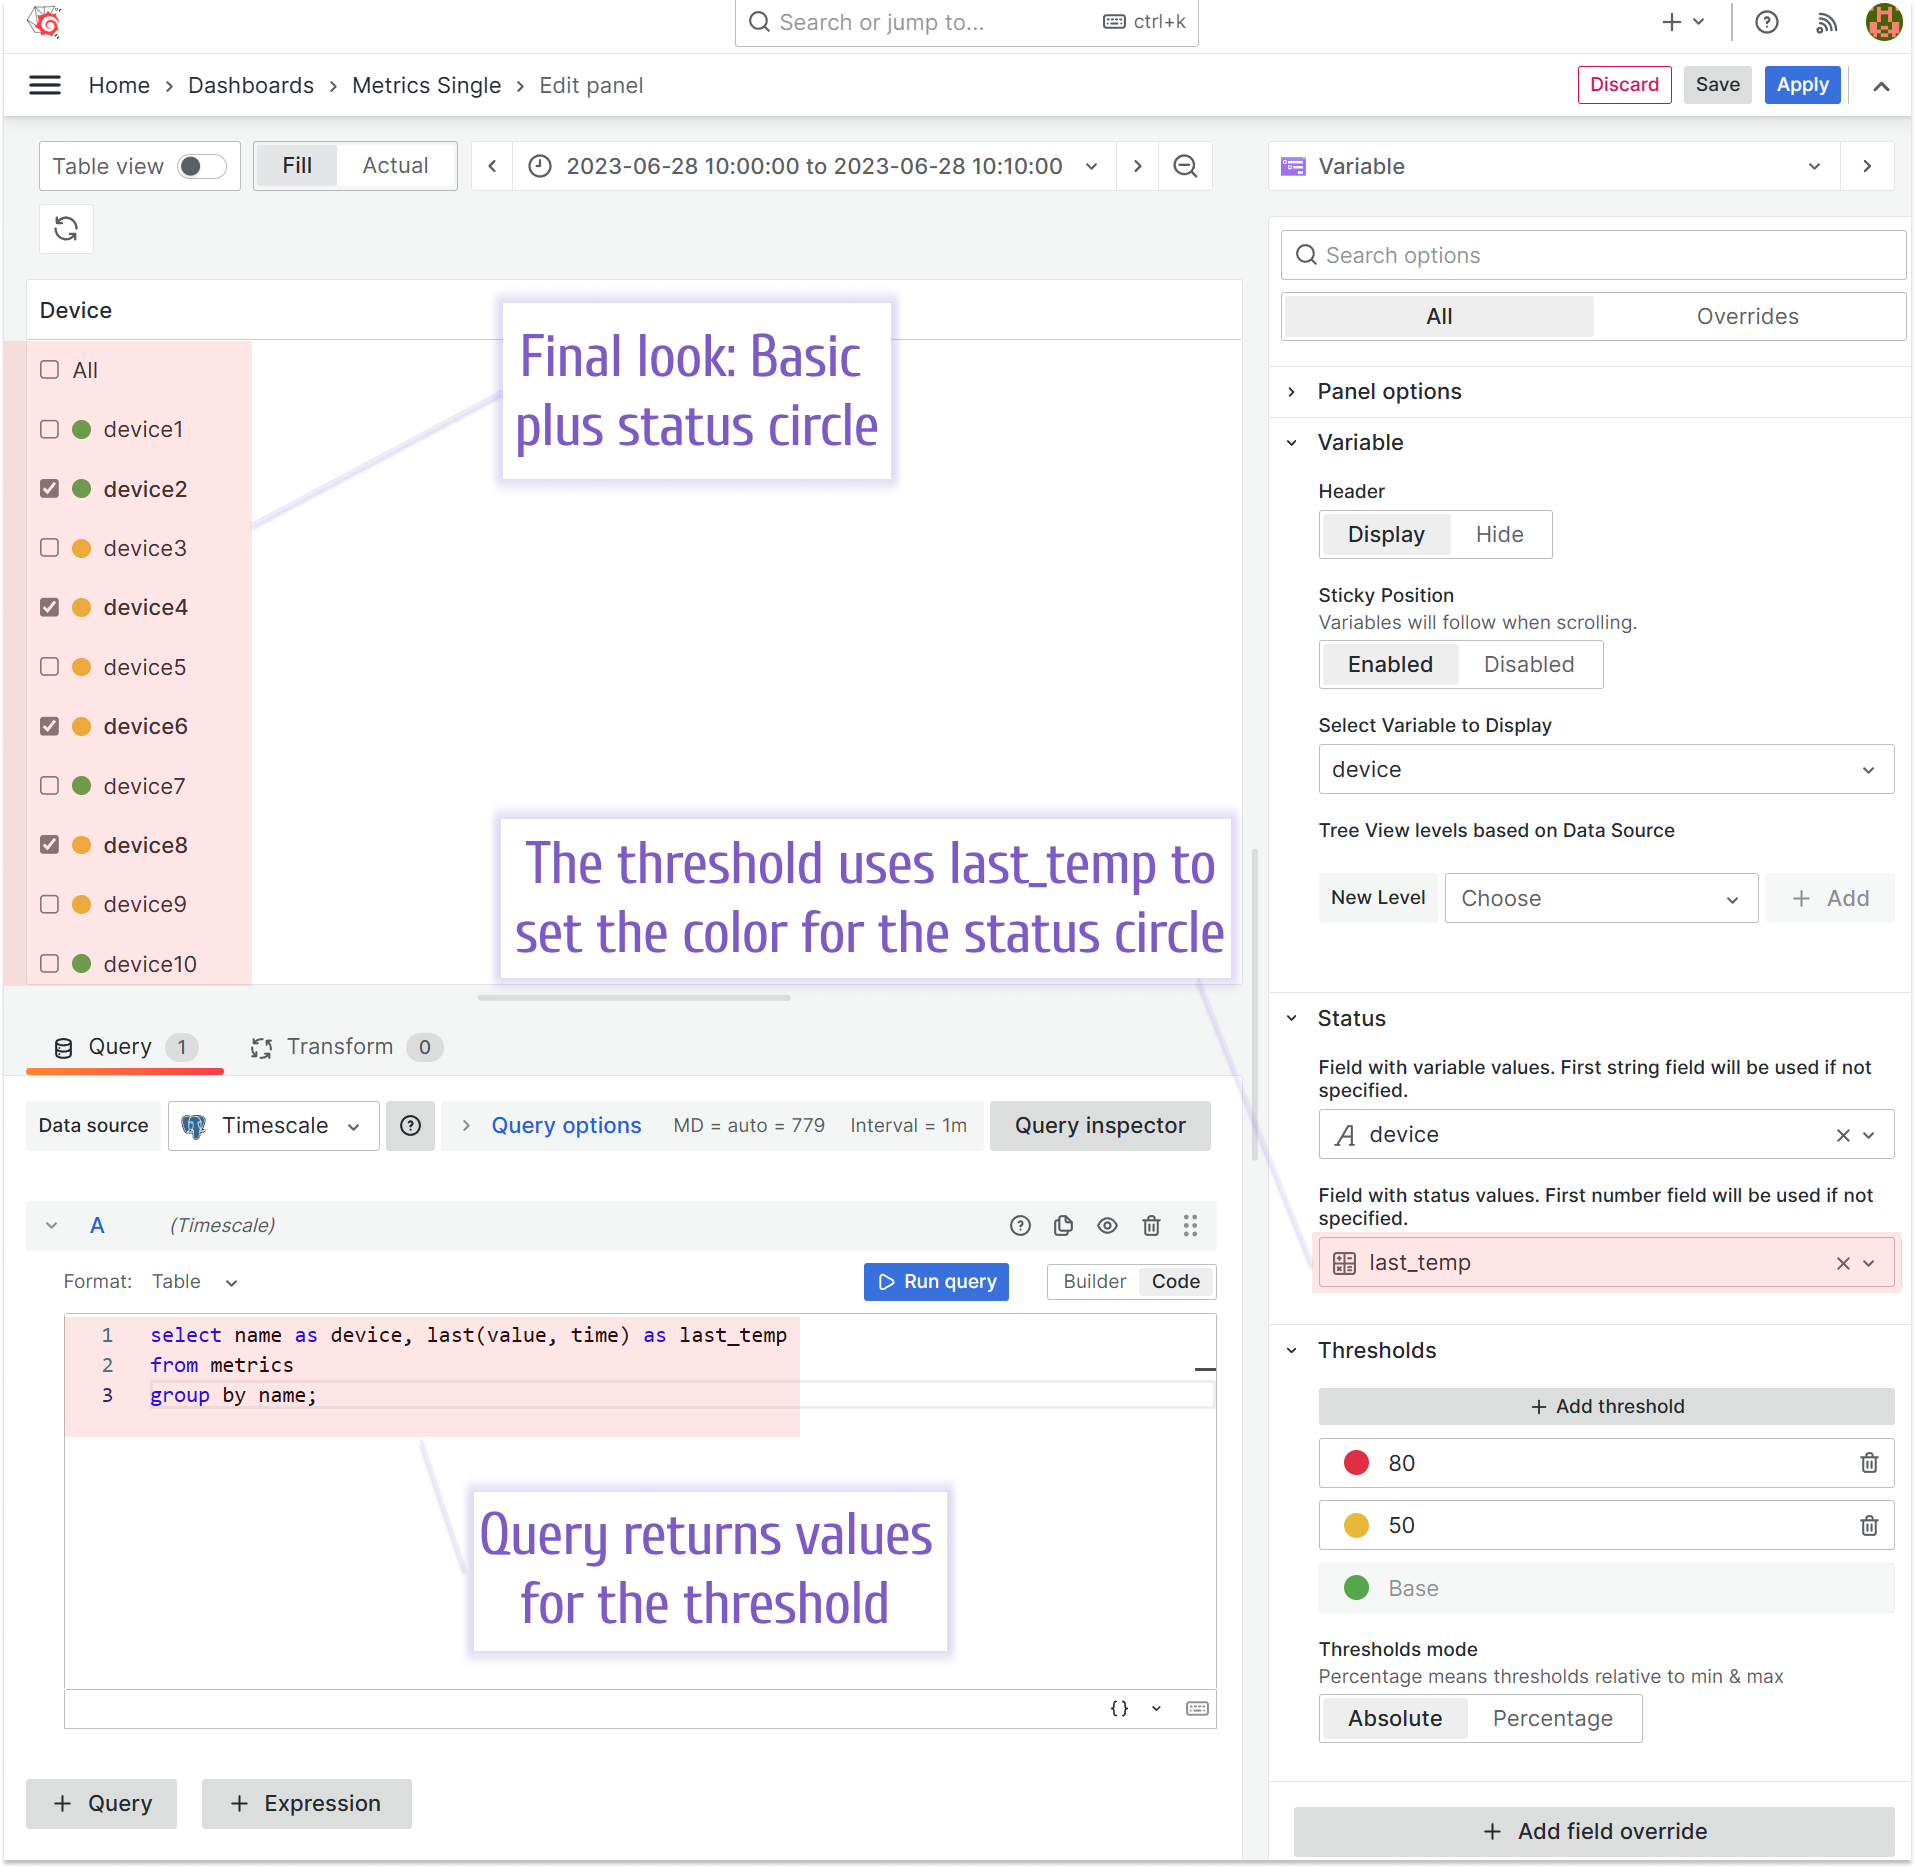
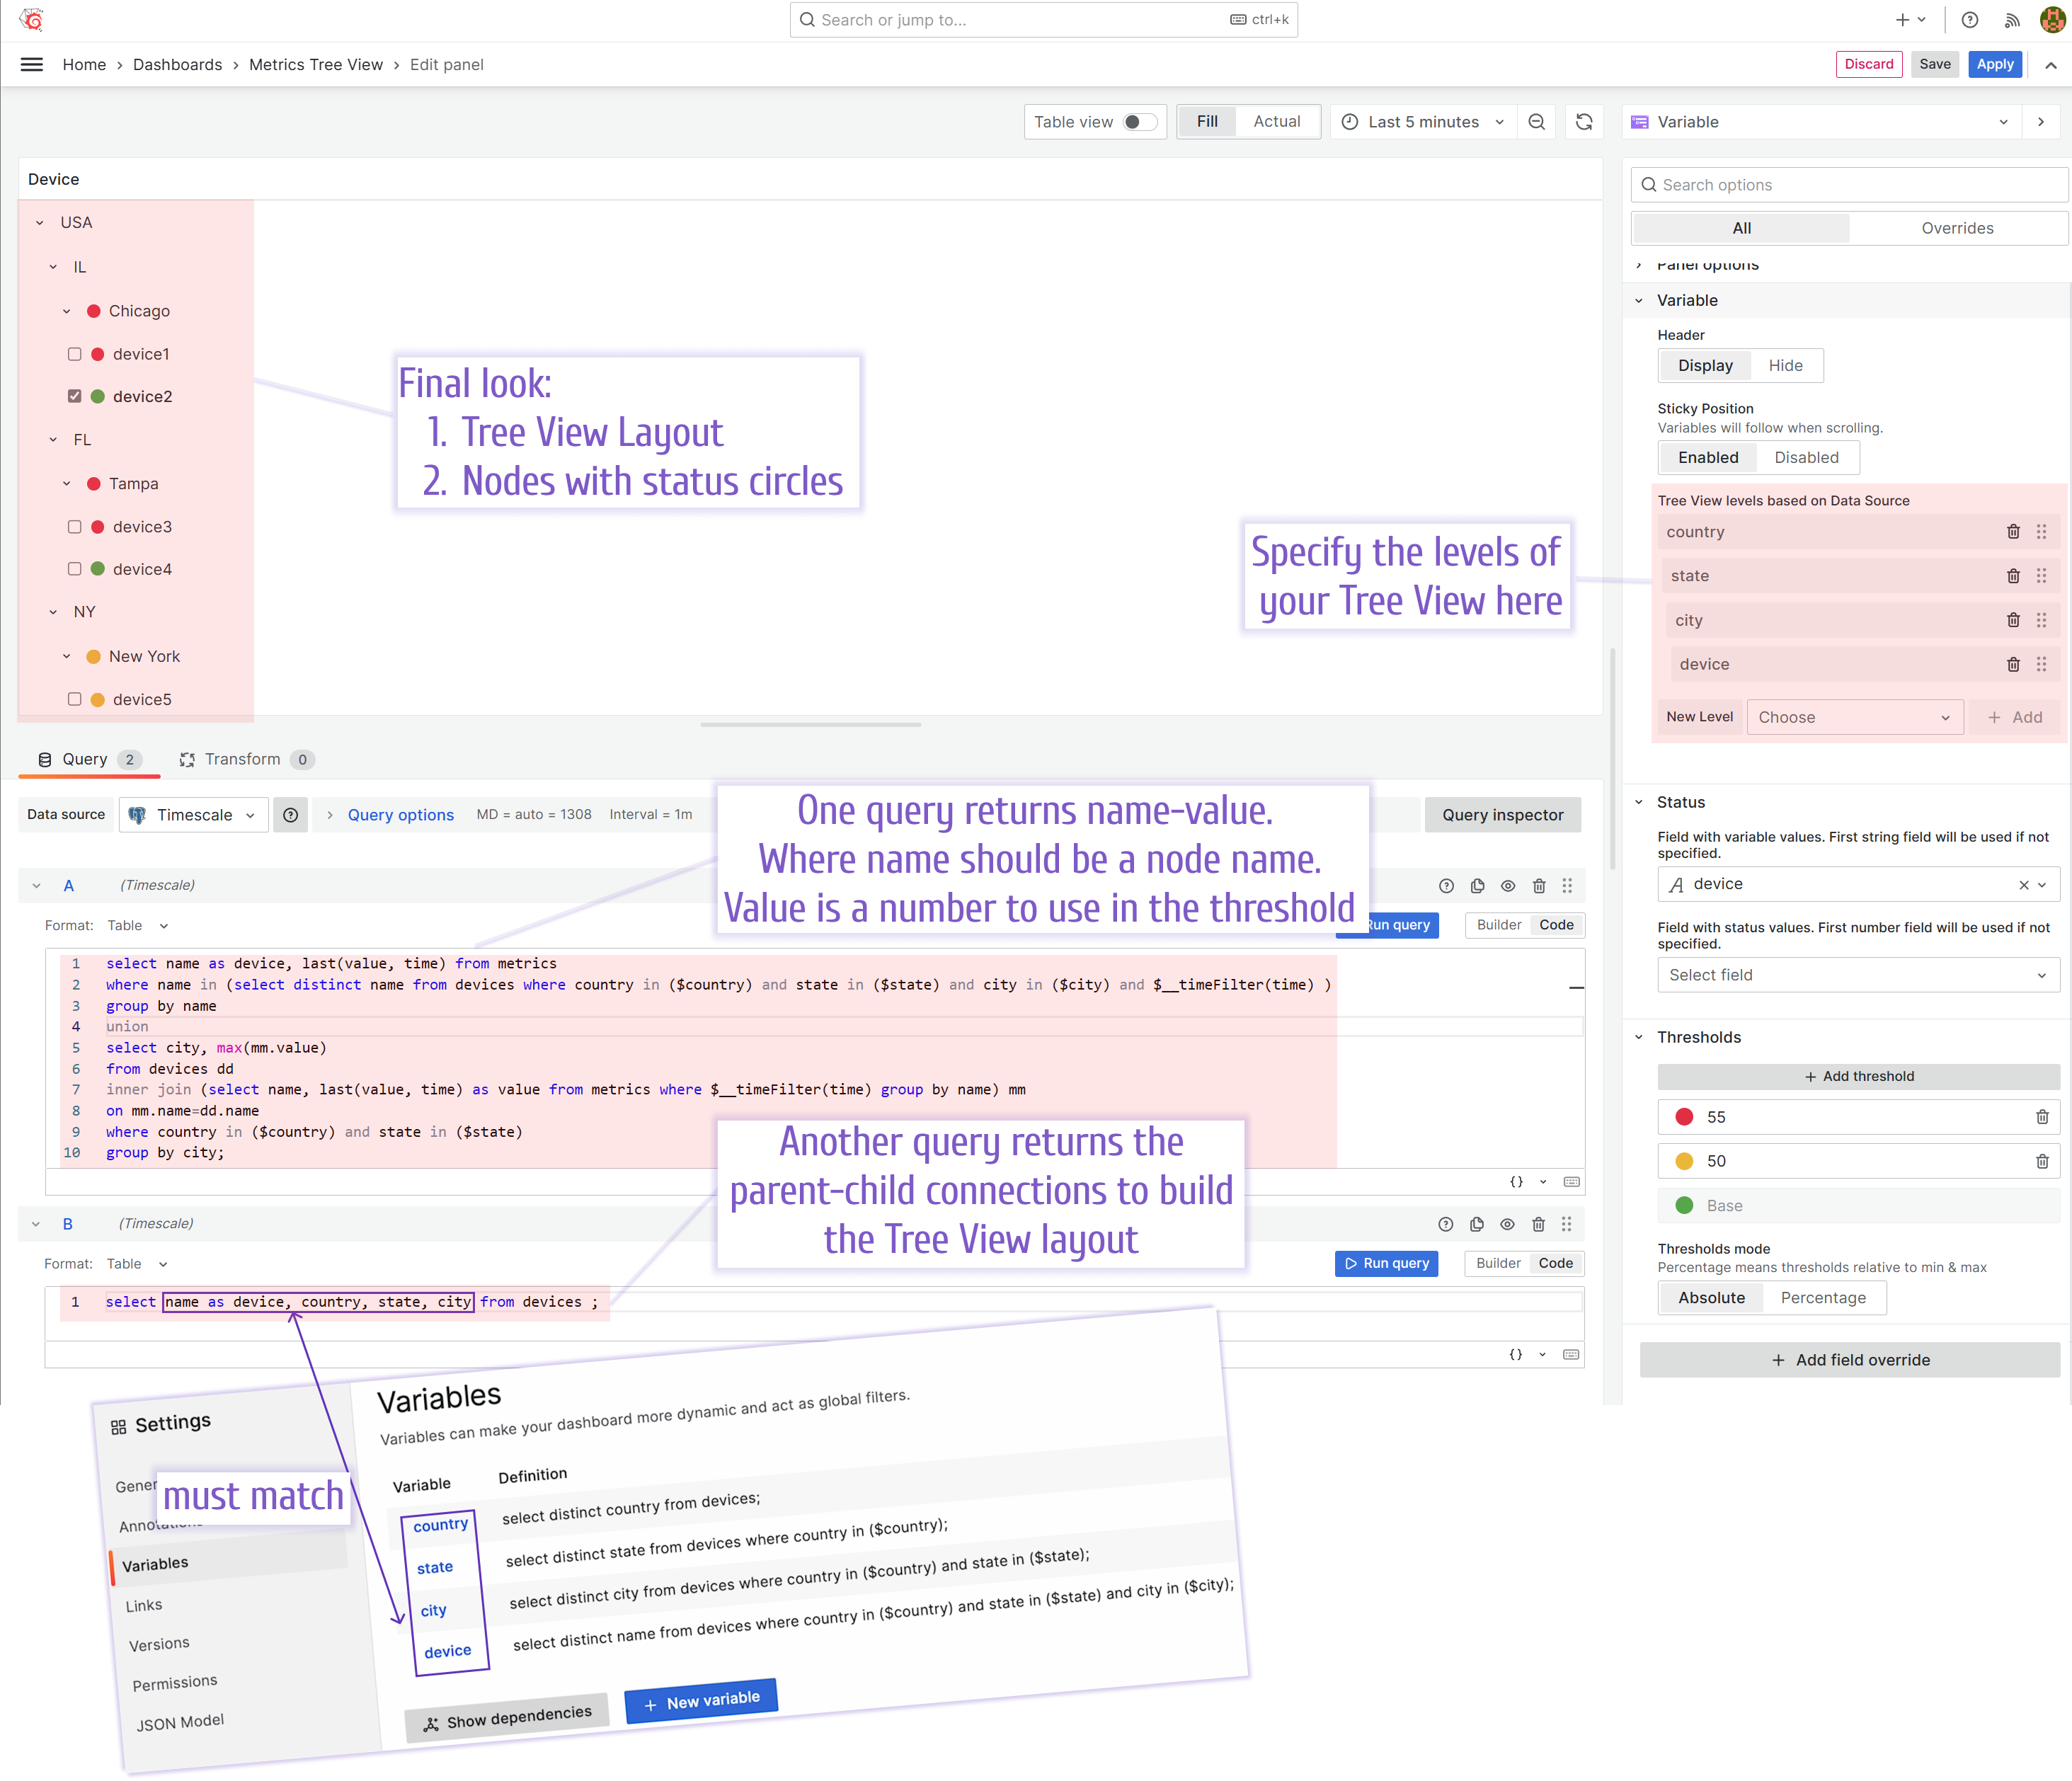
Single variable plus statuses
To add a status circle, follow these additional steps:
- Connect the data source that retrieves two fields: a variable name and a numeric value.
- Configure the threshold by specifying the color to data ranges.
Multiple variables view
This configuration is almost identical to the previous one. The differences are:
- The dashboard variables are connected to one another.
- Every level selection is a separate Business Variable panel.

TreeView
The Multiple variables view can be displayed in a TreeView structure.
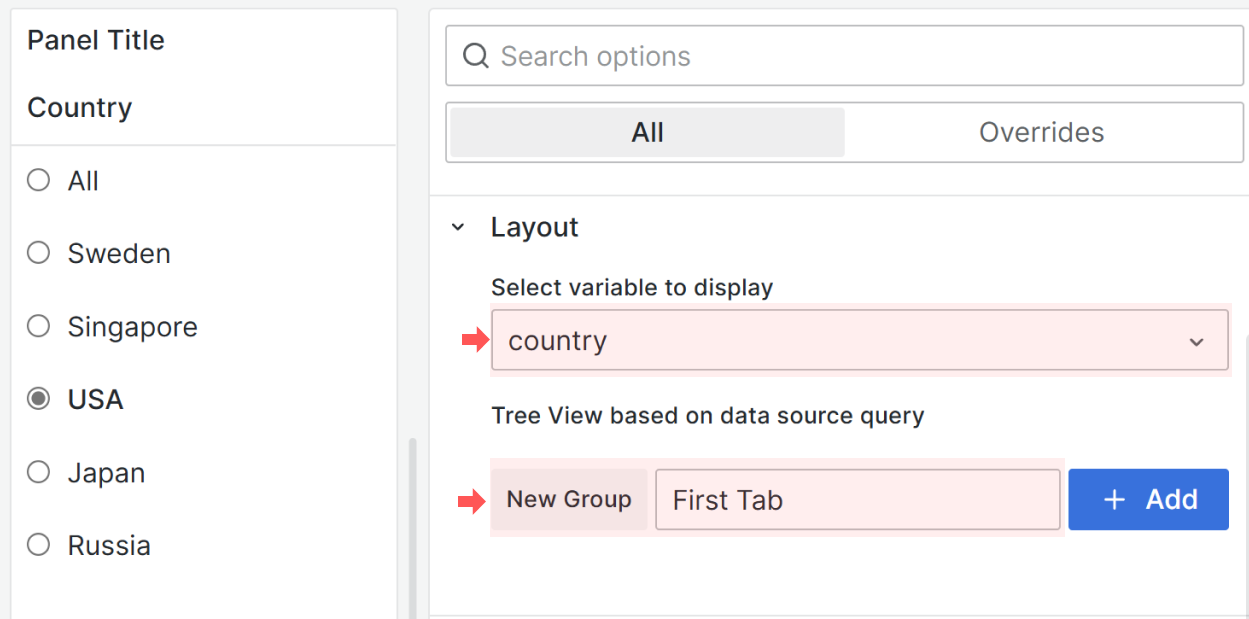
The TreeView display mode consists of groups which usually are referred to as tabs. Start with creating at least one New Group and assigning a dashboard variable to the Select variable to display parameter.
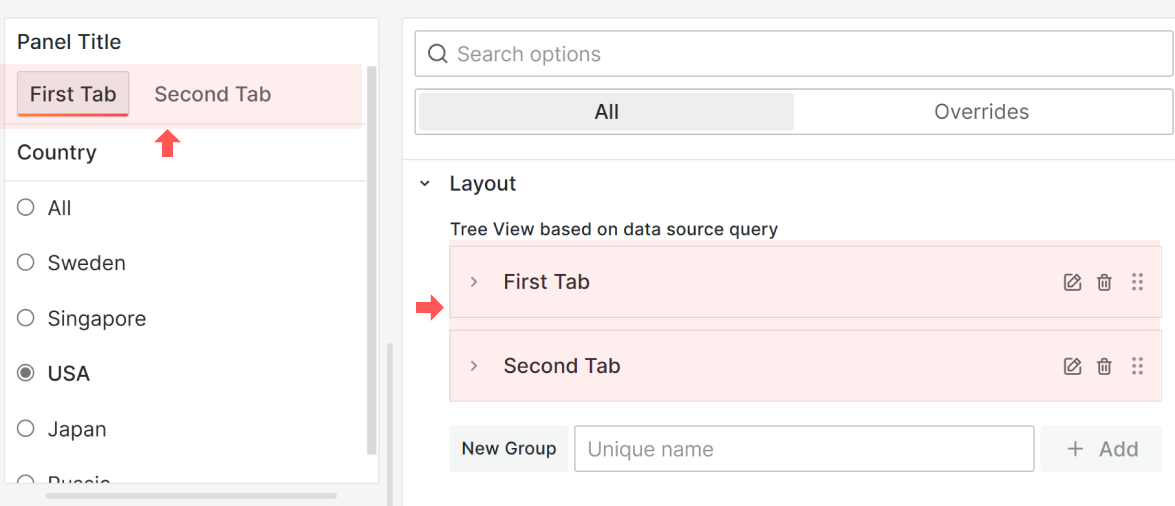
To have tabs' names displayed you need to have at least two tabs added.
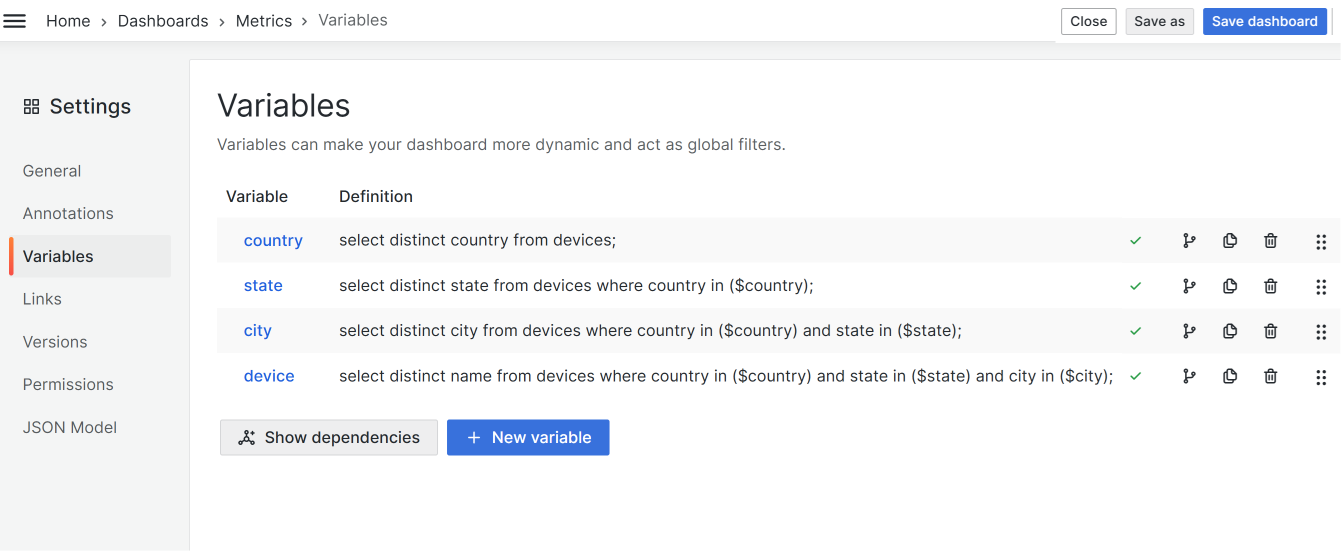
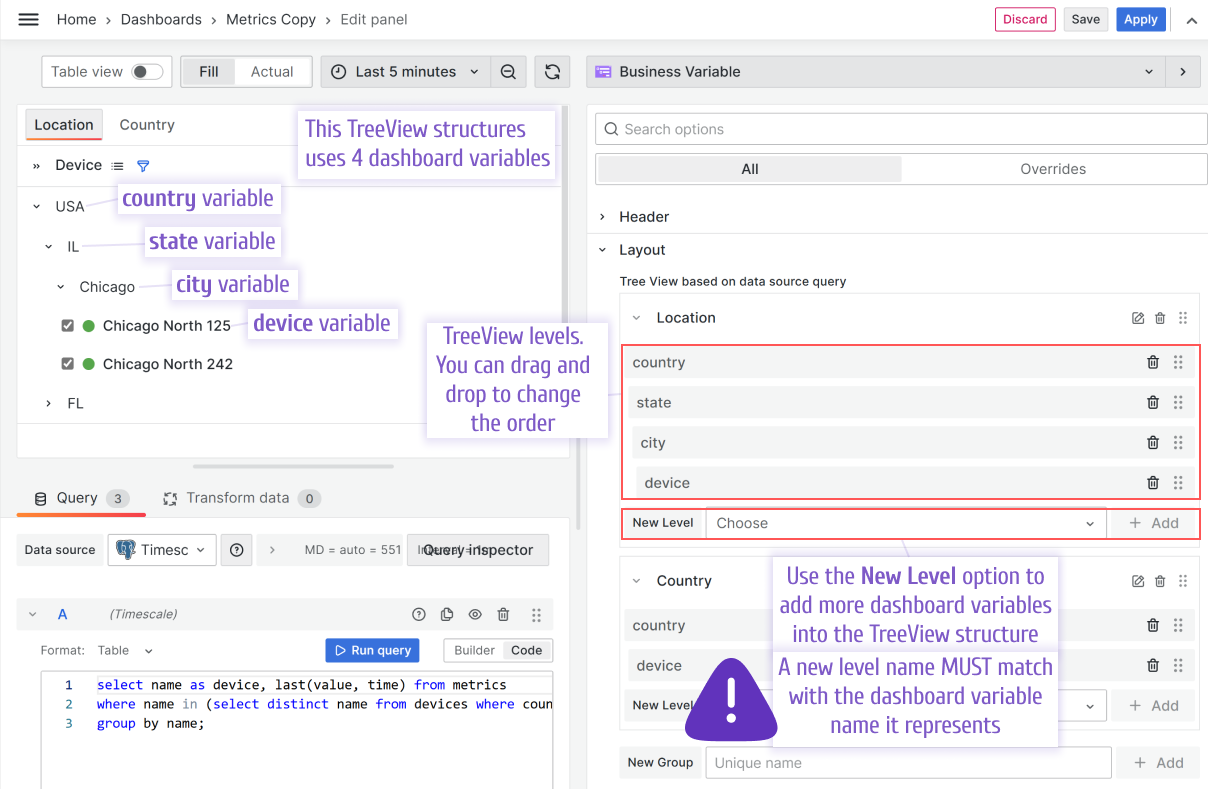
TreeView Levels
To create a TreeView with levels, you need a dashboard variable for each level.
For instance, to have a four-level TreeView (Country->State->City->Device), you need four dashboard variables:
- The
countryis the first TreeView level. - The
staterepresents the second level. It gets updated with everycountryrefresh. - The
cityvariable is for the third level. It gets updated with everystateorcountryrefresh. - The
deviceis for the fourth level. It gets updated with everystate,country, orcityrefresh.
Then in the Business Varibale panel options, add four TreeView levels. Be careful with the level names. They must match the names of the dashboard variables they represent.
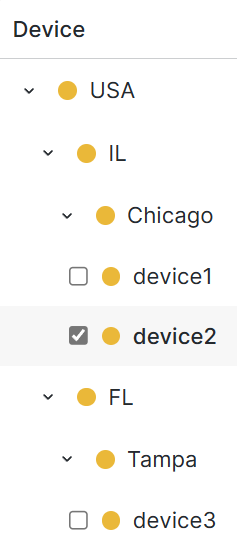
Below is an example of the TreeView with status circles.
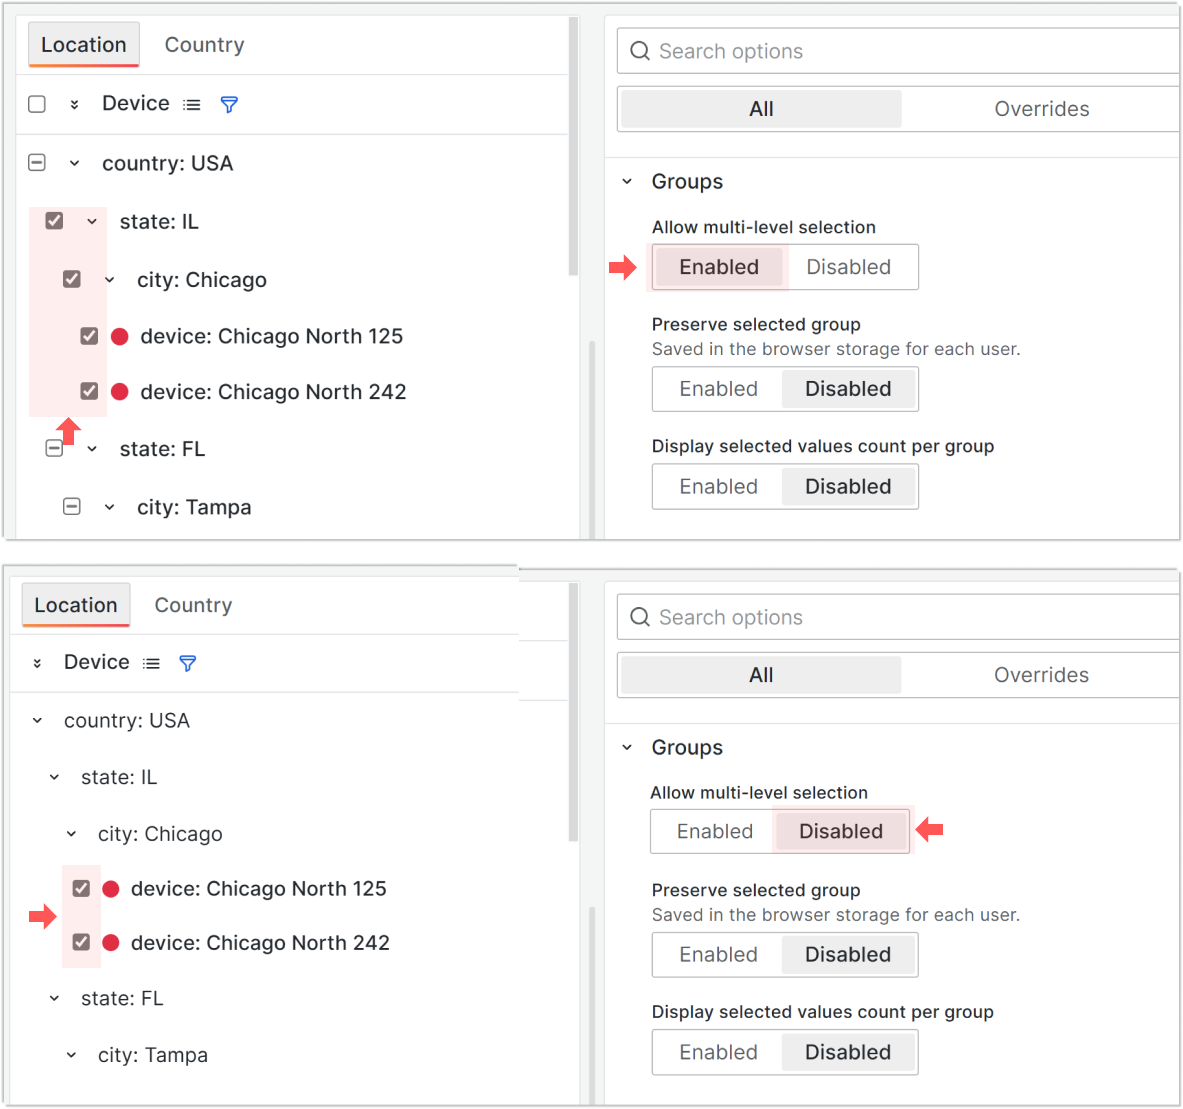
Multi-level selection
In the Groups category, when the Allow multi-level selection parameter is enabled, choosing a root of the group automatically selects all elements belonging to this group.
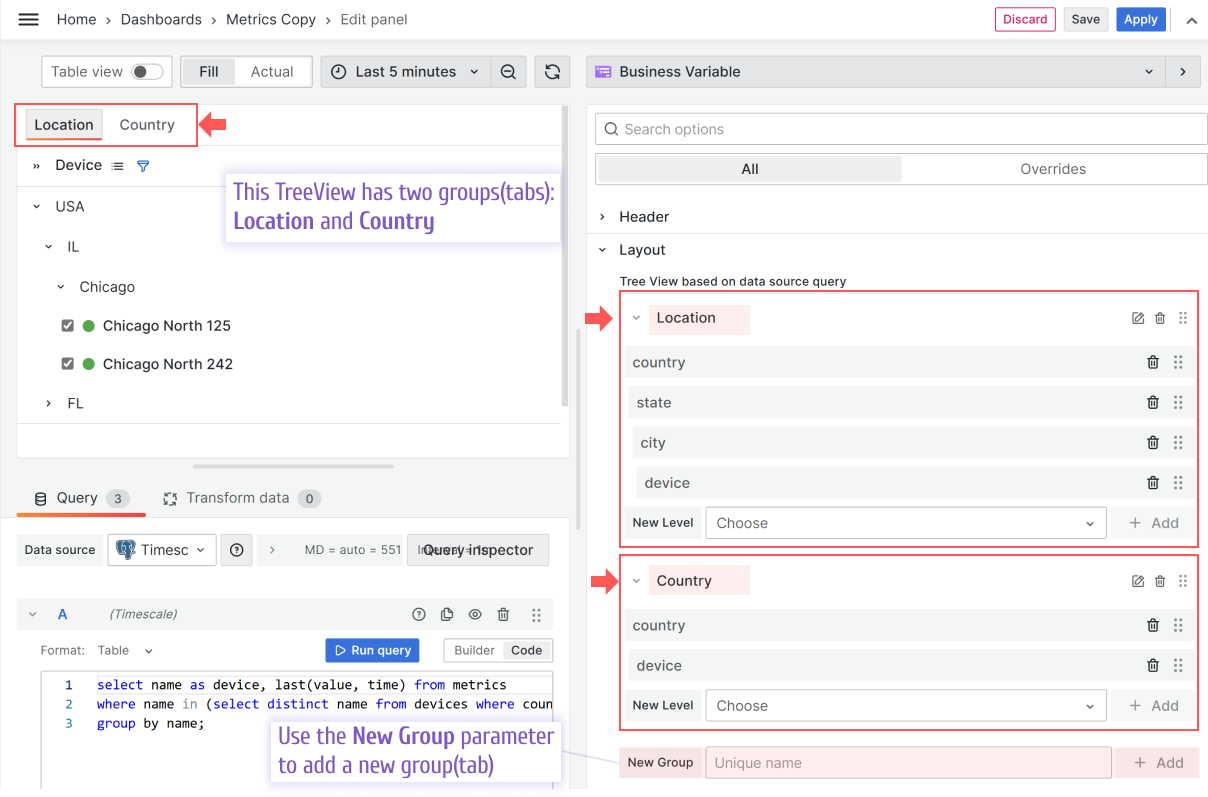
TreeView Groups/Tabs
A TreeView in the illustration below has two groups/tabs. You can add a new group/tab by using the New Group parameter.
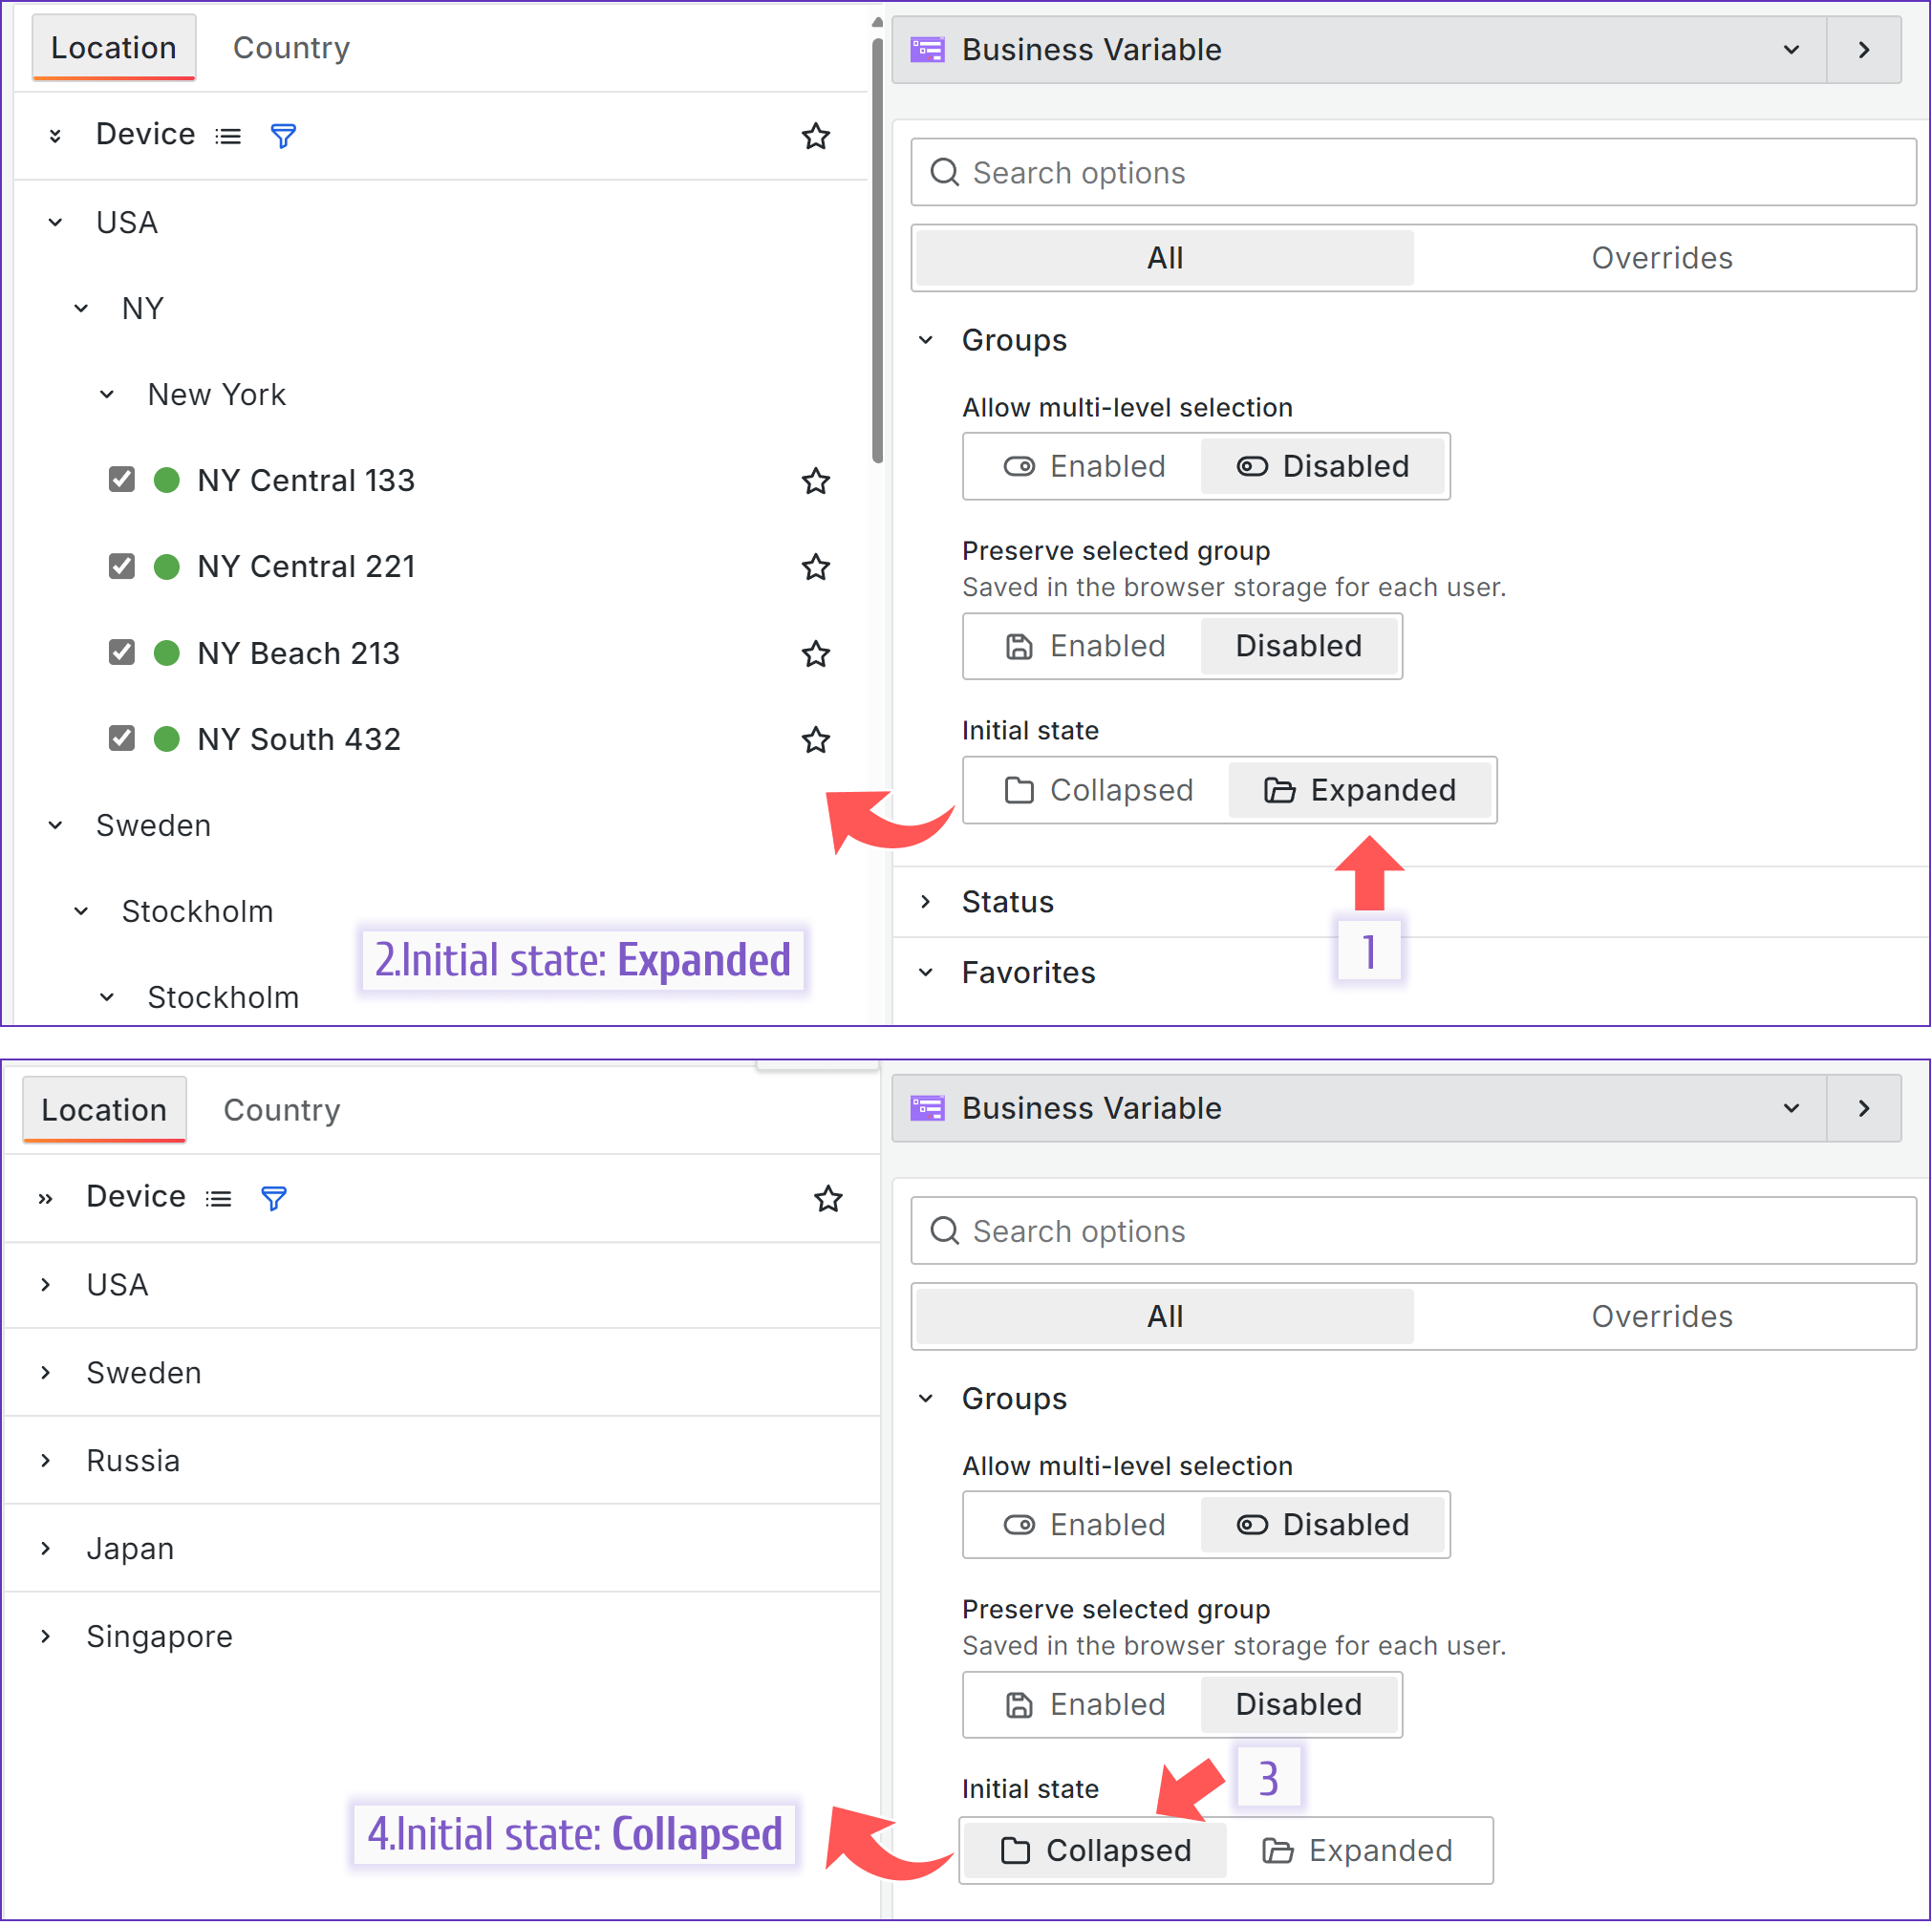
Collapse/Expand on initial load
The Business Variable supports the Collapse/Expand feature starting from version 3.4.0.
It is a self-explanatory option. You can regulate your TreeView's appearance after the dashboard is open.
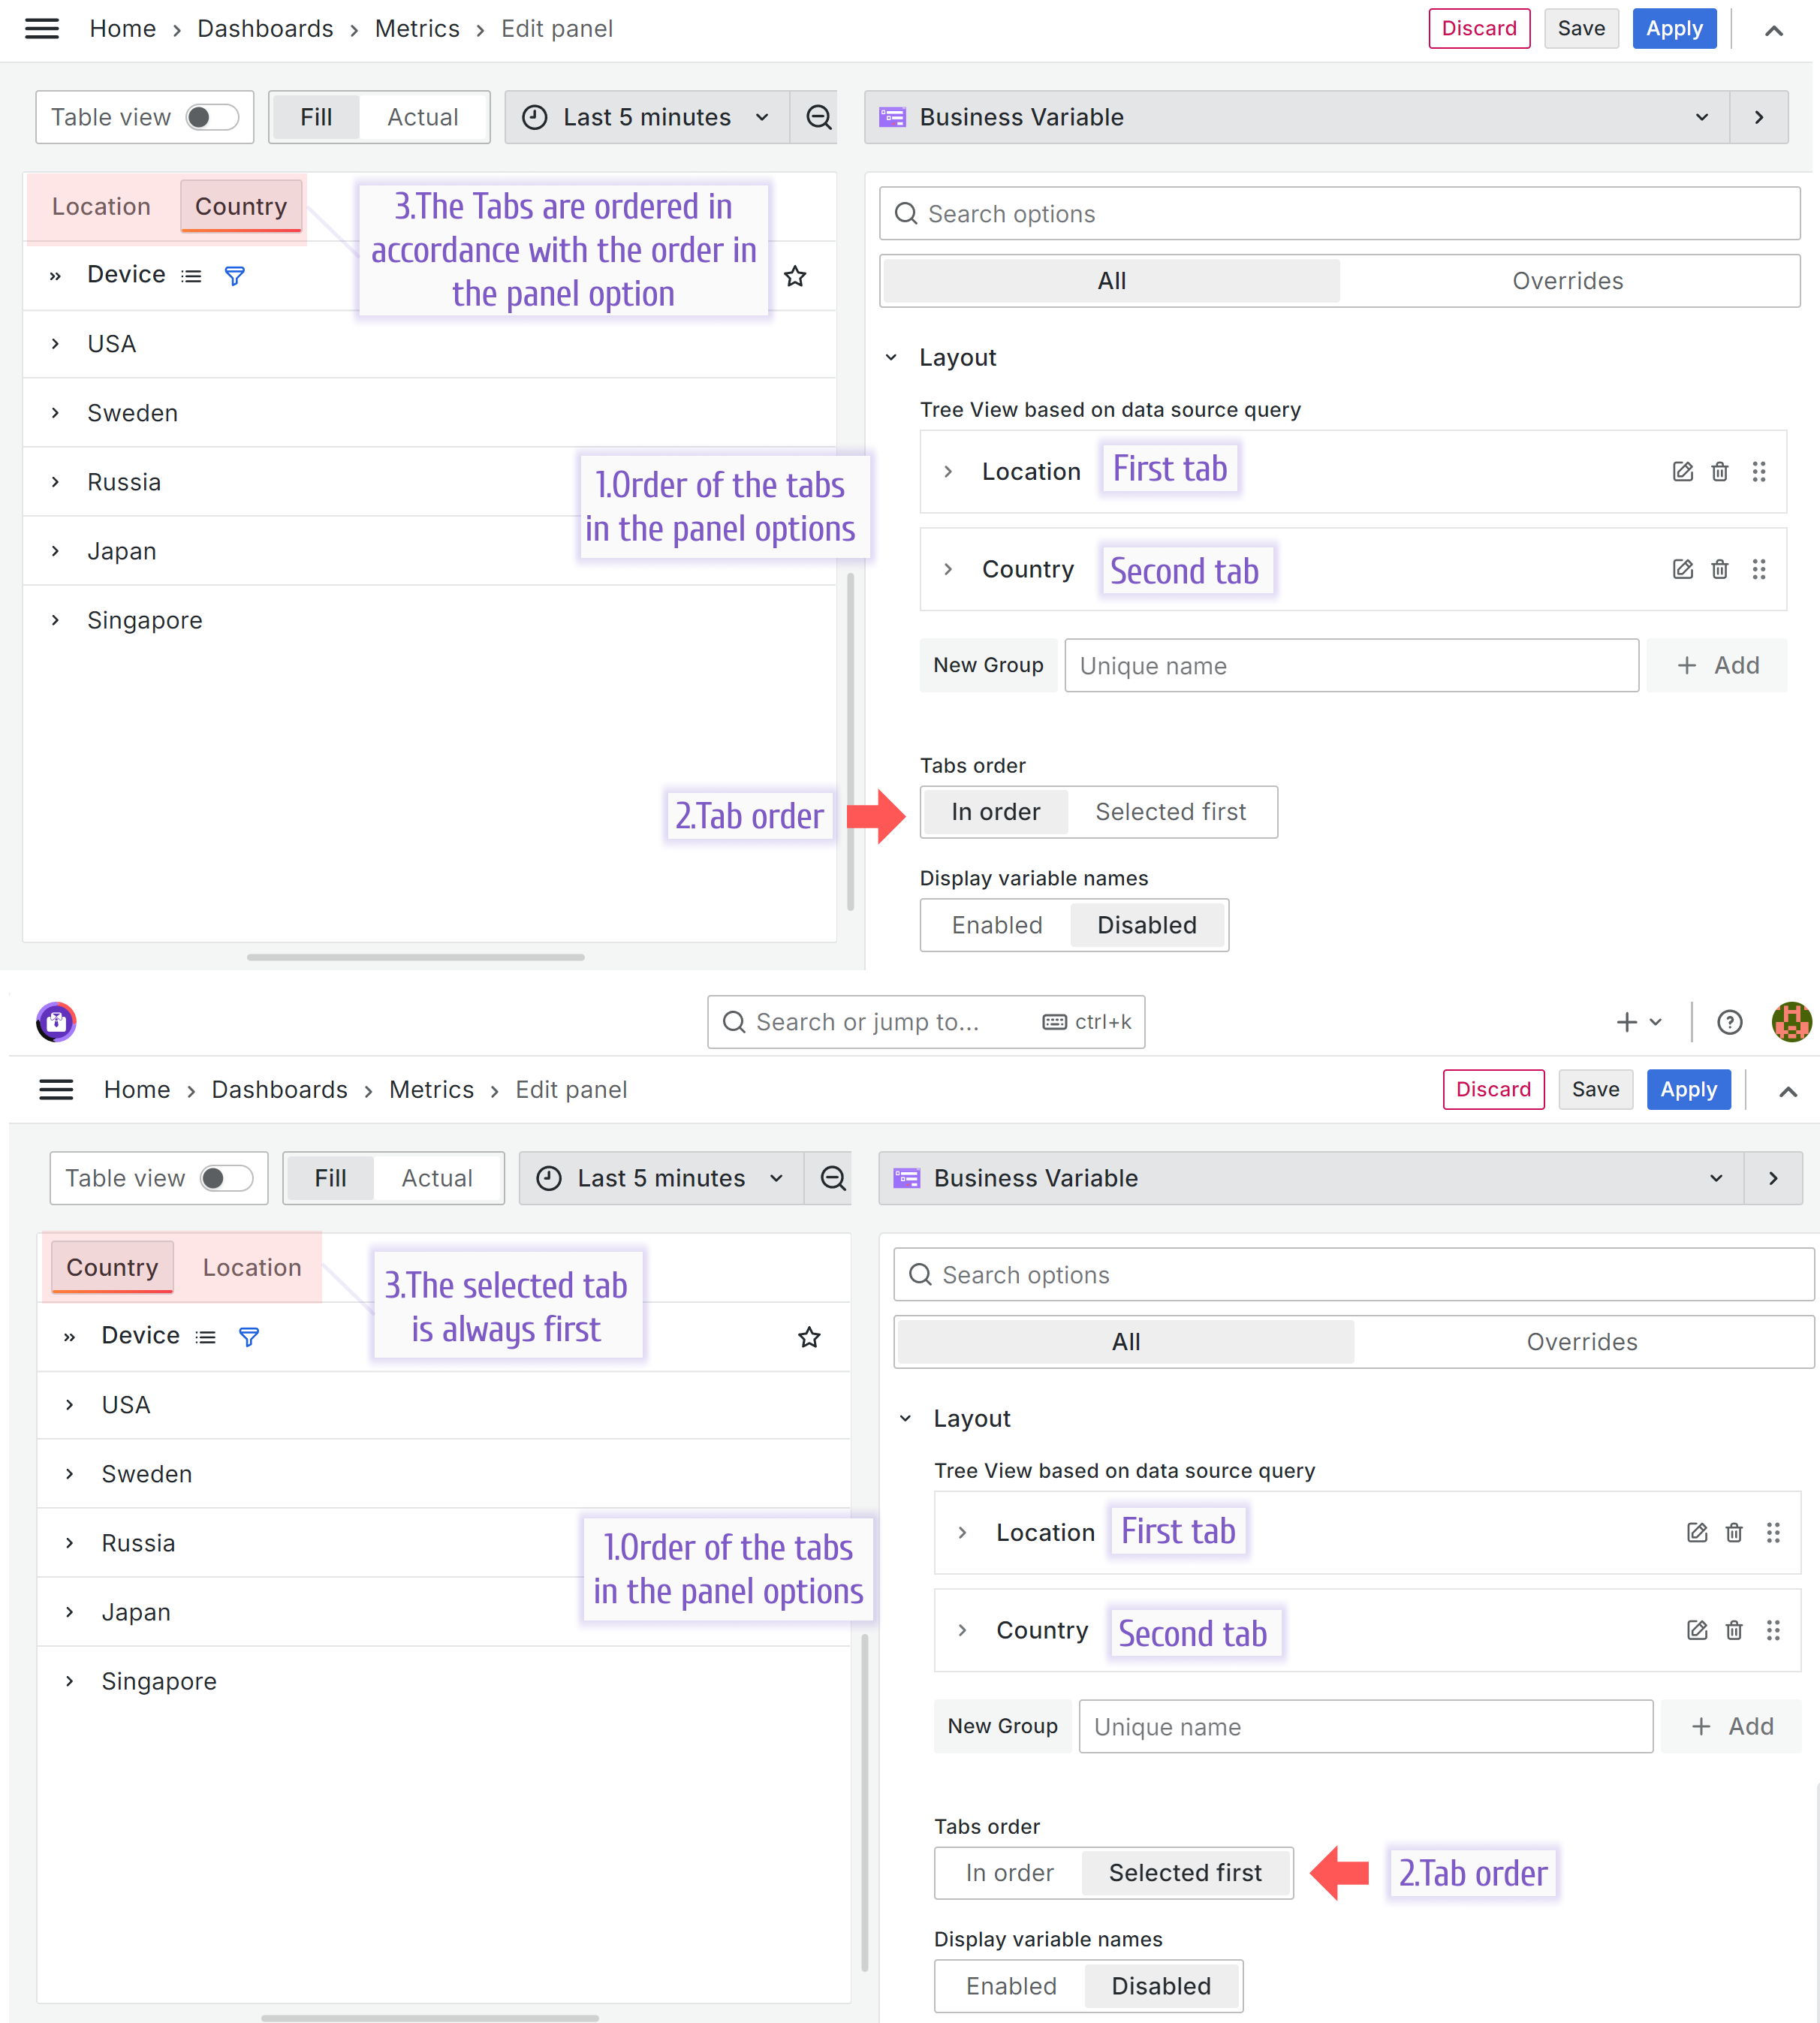
Tabs order
The Business Variable supports the Tabs order feature starting from version 3.4.0.
In case of multiple tabs, you can specify their order in the Tab order parameter:
- In order. The tabs will always be displayed in the same order as they are in the panel options.
- Selected first. The selected tab will always be displayed first.
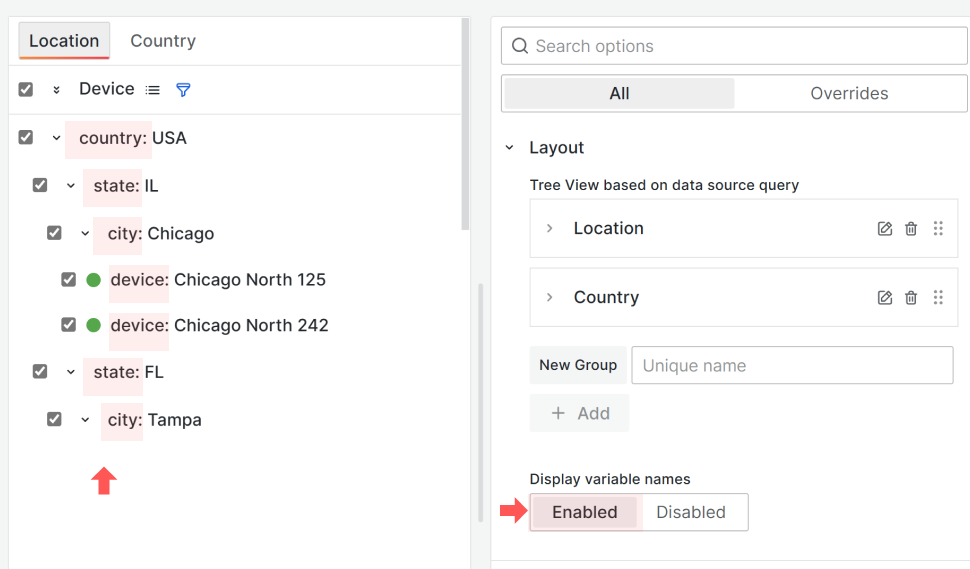
Dashboard variable name display
An additional option to display the variable name in front of the value can be enabled to provide additional context for the users.
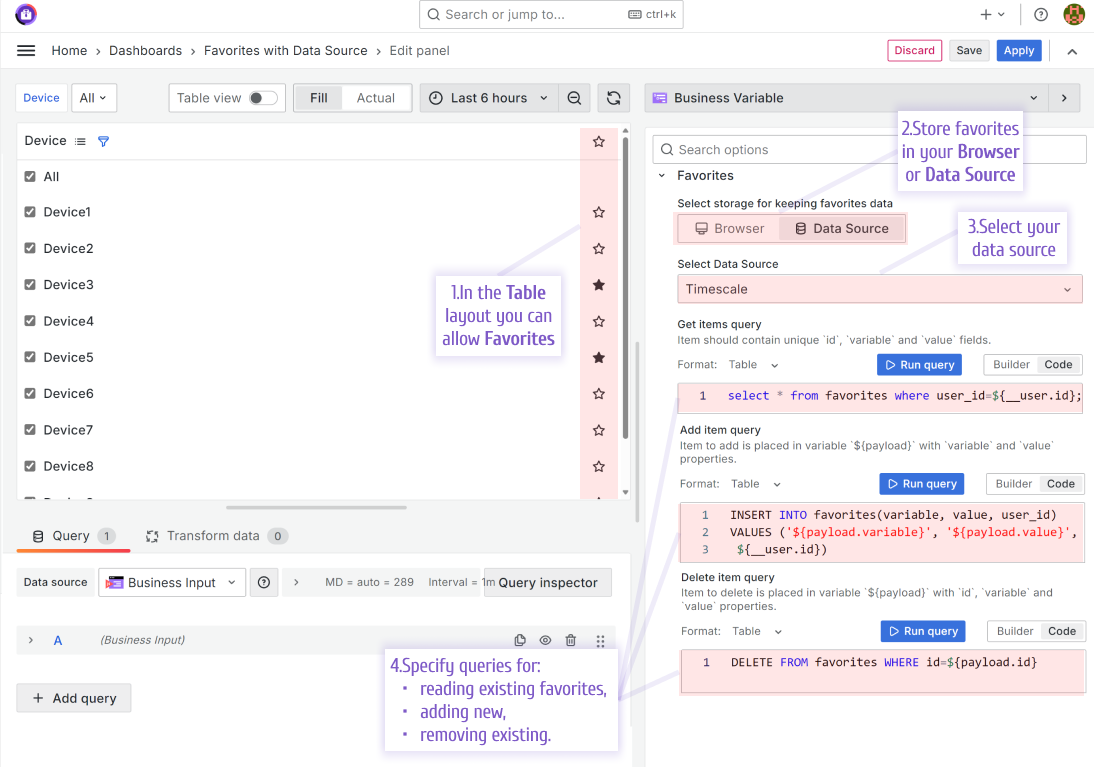
Favorites
The Business Variable panel allows selecting values as favorites. The favorite icon in the header allows you to filter all favorites for quick navigation and selection.
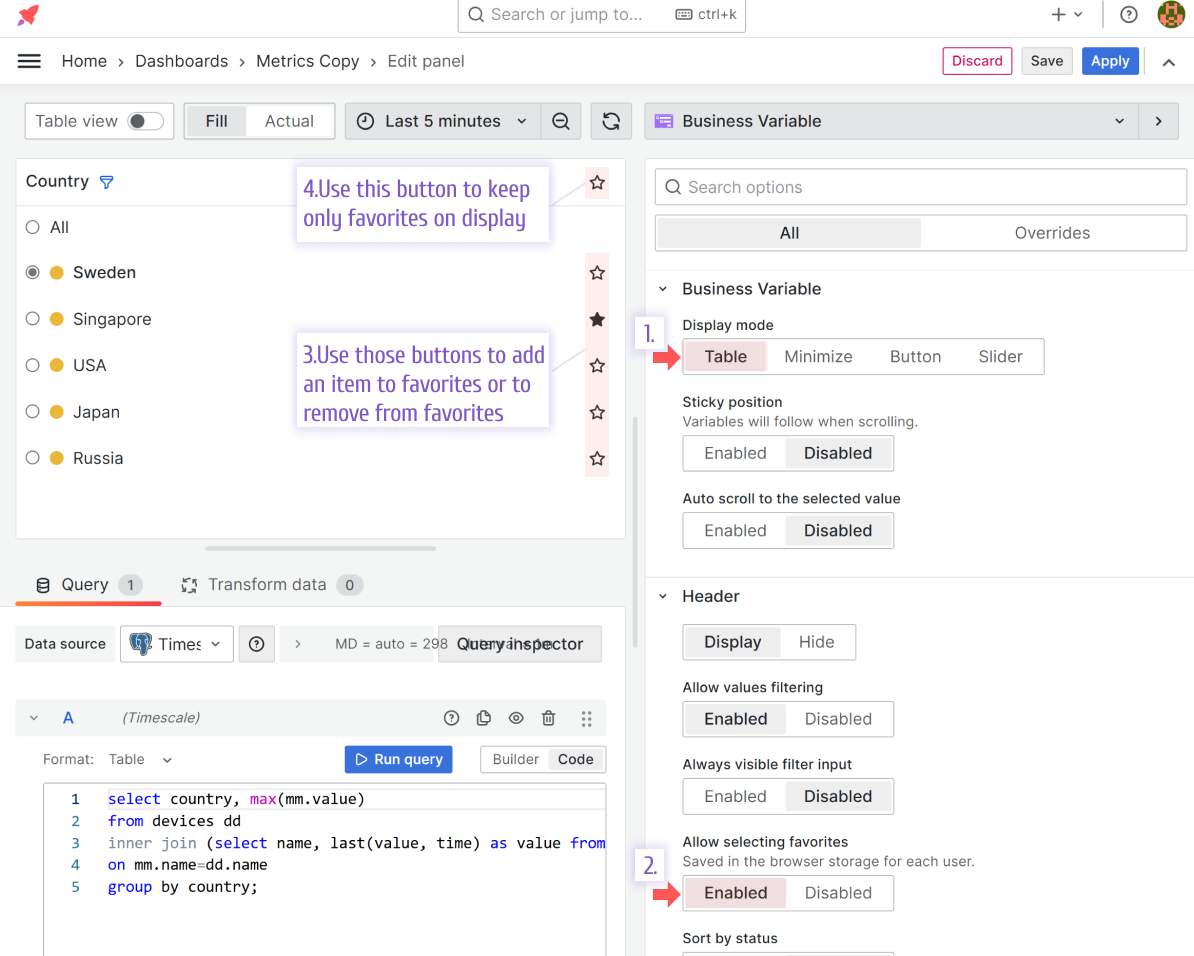
Prior to the version 3.4.0 favorites could only be stored in a web browser. Starting from the version 3.4.0, there is a second option - data source.
Store favorites in a data source
Storing the selected favorites in the browser is an excellent solution in many cases. All favorites are unique for each user.
However, some users use multiple devices and browsers to work with the Grafana dashboard or need to clear their cookies often.
These users can choose to store their favorites in a data source.
SQL to create the table used in the illustration above:
CREATE TABLE favorites (
    id serial primary key,
    variable text NOT NULL,
    value text NOT NULL,
    user_id integer NOT NULL
);
Example of how the favorites table can be populated:
| id | variable | value | user_id |
|---|---|---|---|
| 2 | device | Device5 | 1 |
| 3 | device | Device3 | 1 |
Get items query
select * from favorites where user_id=${__user.id};
Add item query
INSERT INTO favorites(variable, value, user_id)
VALUES ('${payload.variable}', '${payload.value}', ${__user.id})
Delete item query
DELETE FROM favorites WHERE id=${payload.id}
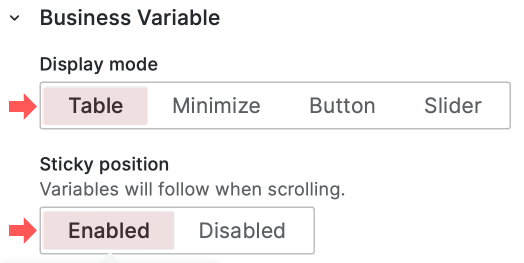
Sticky option
You can enable the Sticky option to ensure the Business Variable panel is always in sight for the user and never gets scrolled over.
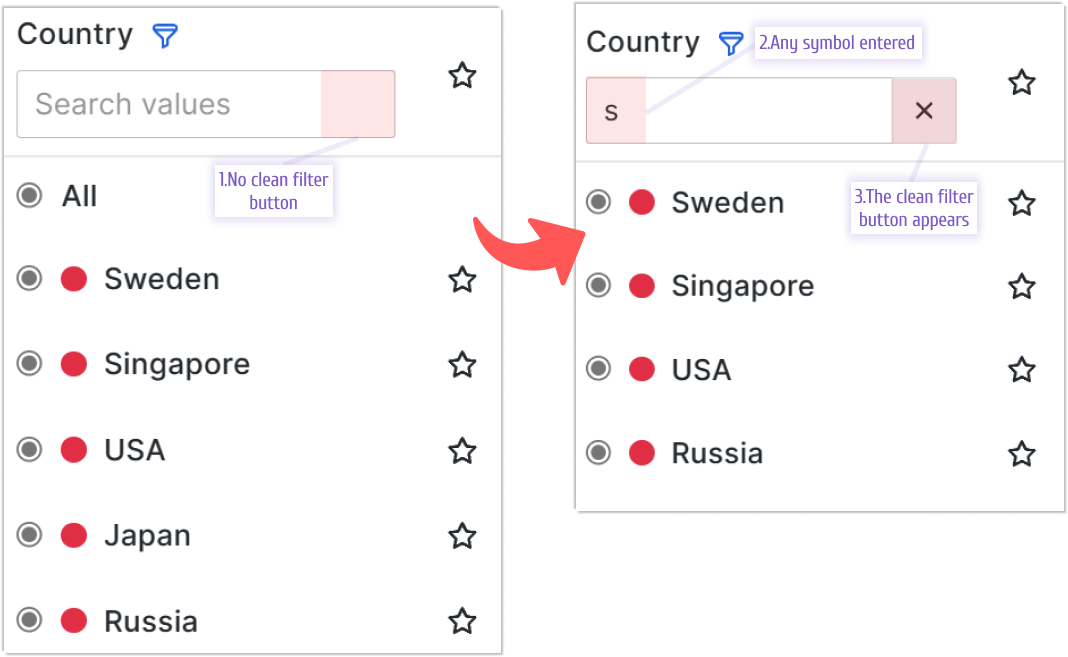
Search
Clean filter value button
The Business Variable panel supports this feature starting from version 2.2.0.
It is a small, but very nice feature. Once you start typing in the search text field, you can remove all entered symbols by using an X button appearing at the far-right corner of the search text.
Always Visible Search option
The Business Variable panel supports this feature starting from version 2.2.0.
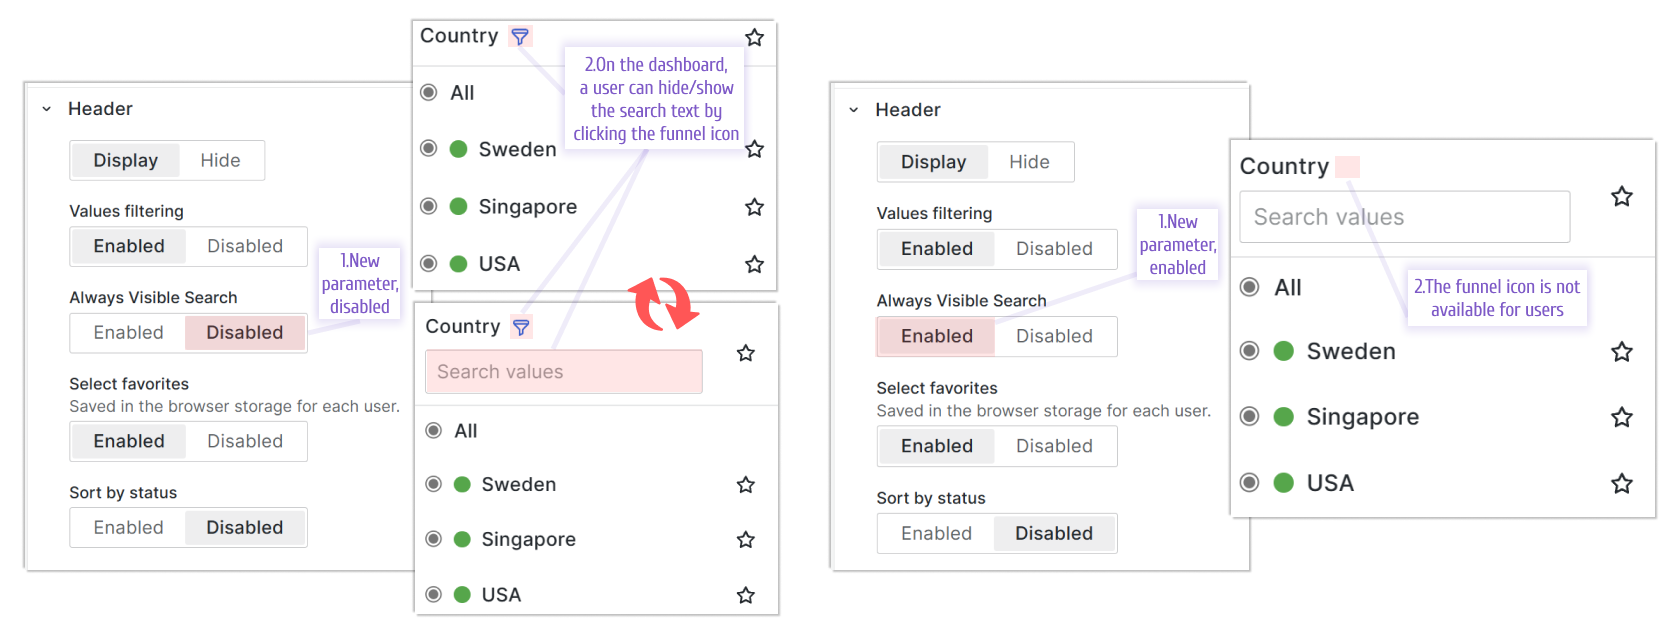
The ability to hide a search text area can be taken away from users by using the Always Visible search option.
When it is Disabled, the funnel icon is shown on the dashboard. By clicking on the funnel icon, users can alternate between hiding and showing the search text area.
When it is Enabled, the funnel icon is hidden and users are not capable of hiding the search text area.
Total and selected values count
The Business Variable panel supports this feature starting from version 3.0.0.
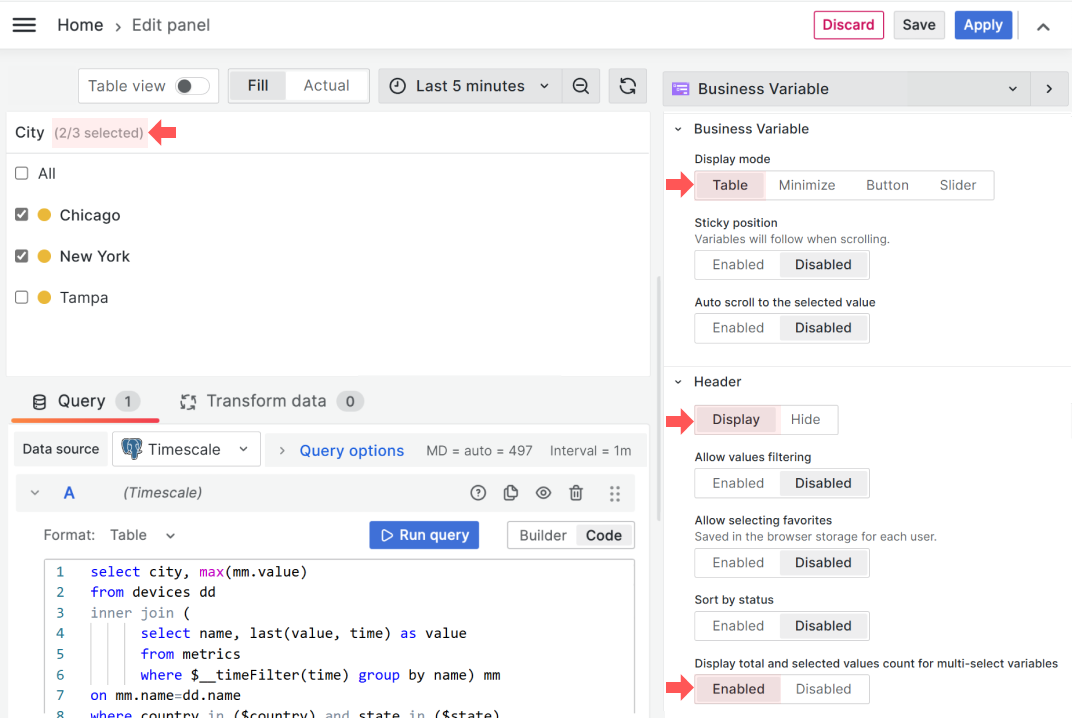
In the Table display mode, you can now choose to Display total and selected values count for multi-select variables. The Header must be in the Display mode to see the new parameter.
This parameter is the enable/disable type. The total count appears next to the header in a gray font color where the first number indicates how many values are selected and the second how many are available for selection in total.
Tab auto-grouping
The Business Variable panel supports this feature starting from version 3.0.0.
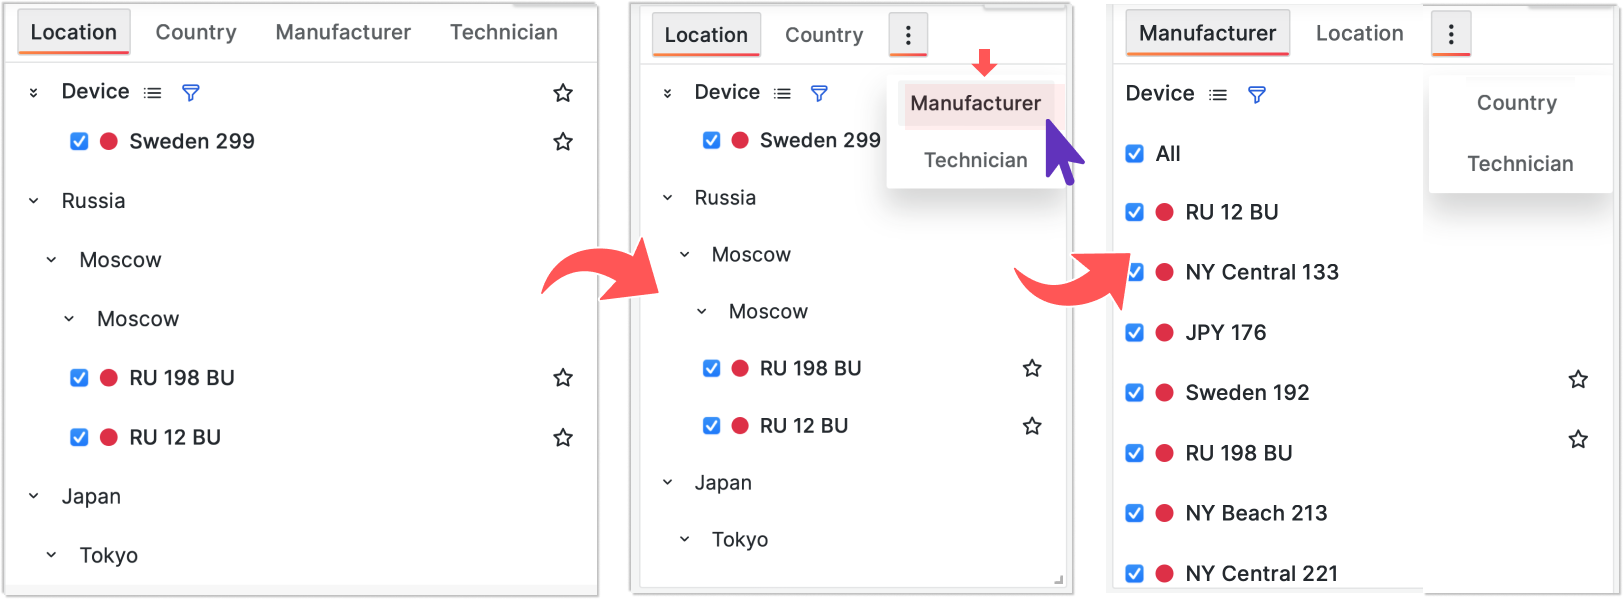
The ability to auto group tab adds even more sophistication to the Business Variable panel. When too many tabs are located side by side, the panel collects the overflowing tabs and shows the three vertical dots instead. Upon clicking on the dots, a user sees the rest of the tabs in a drop-down for selection.
The Business Variable panel shifts the selected tab on the very left among all other tabs.
Selected tab preservation
The Business Variable panel supports this feature starting from version 3.0.0.
You might have the cloned Business Variable panel across many dashboards. With that, a user can switch to a different dashboard without realizing it. To enhance the user experience even further, you can now save the selected tab while redirecting a user and open a new dashboard with the tab that the user selected prior.
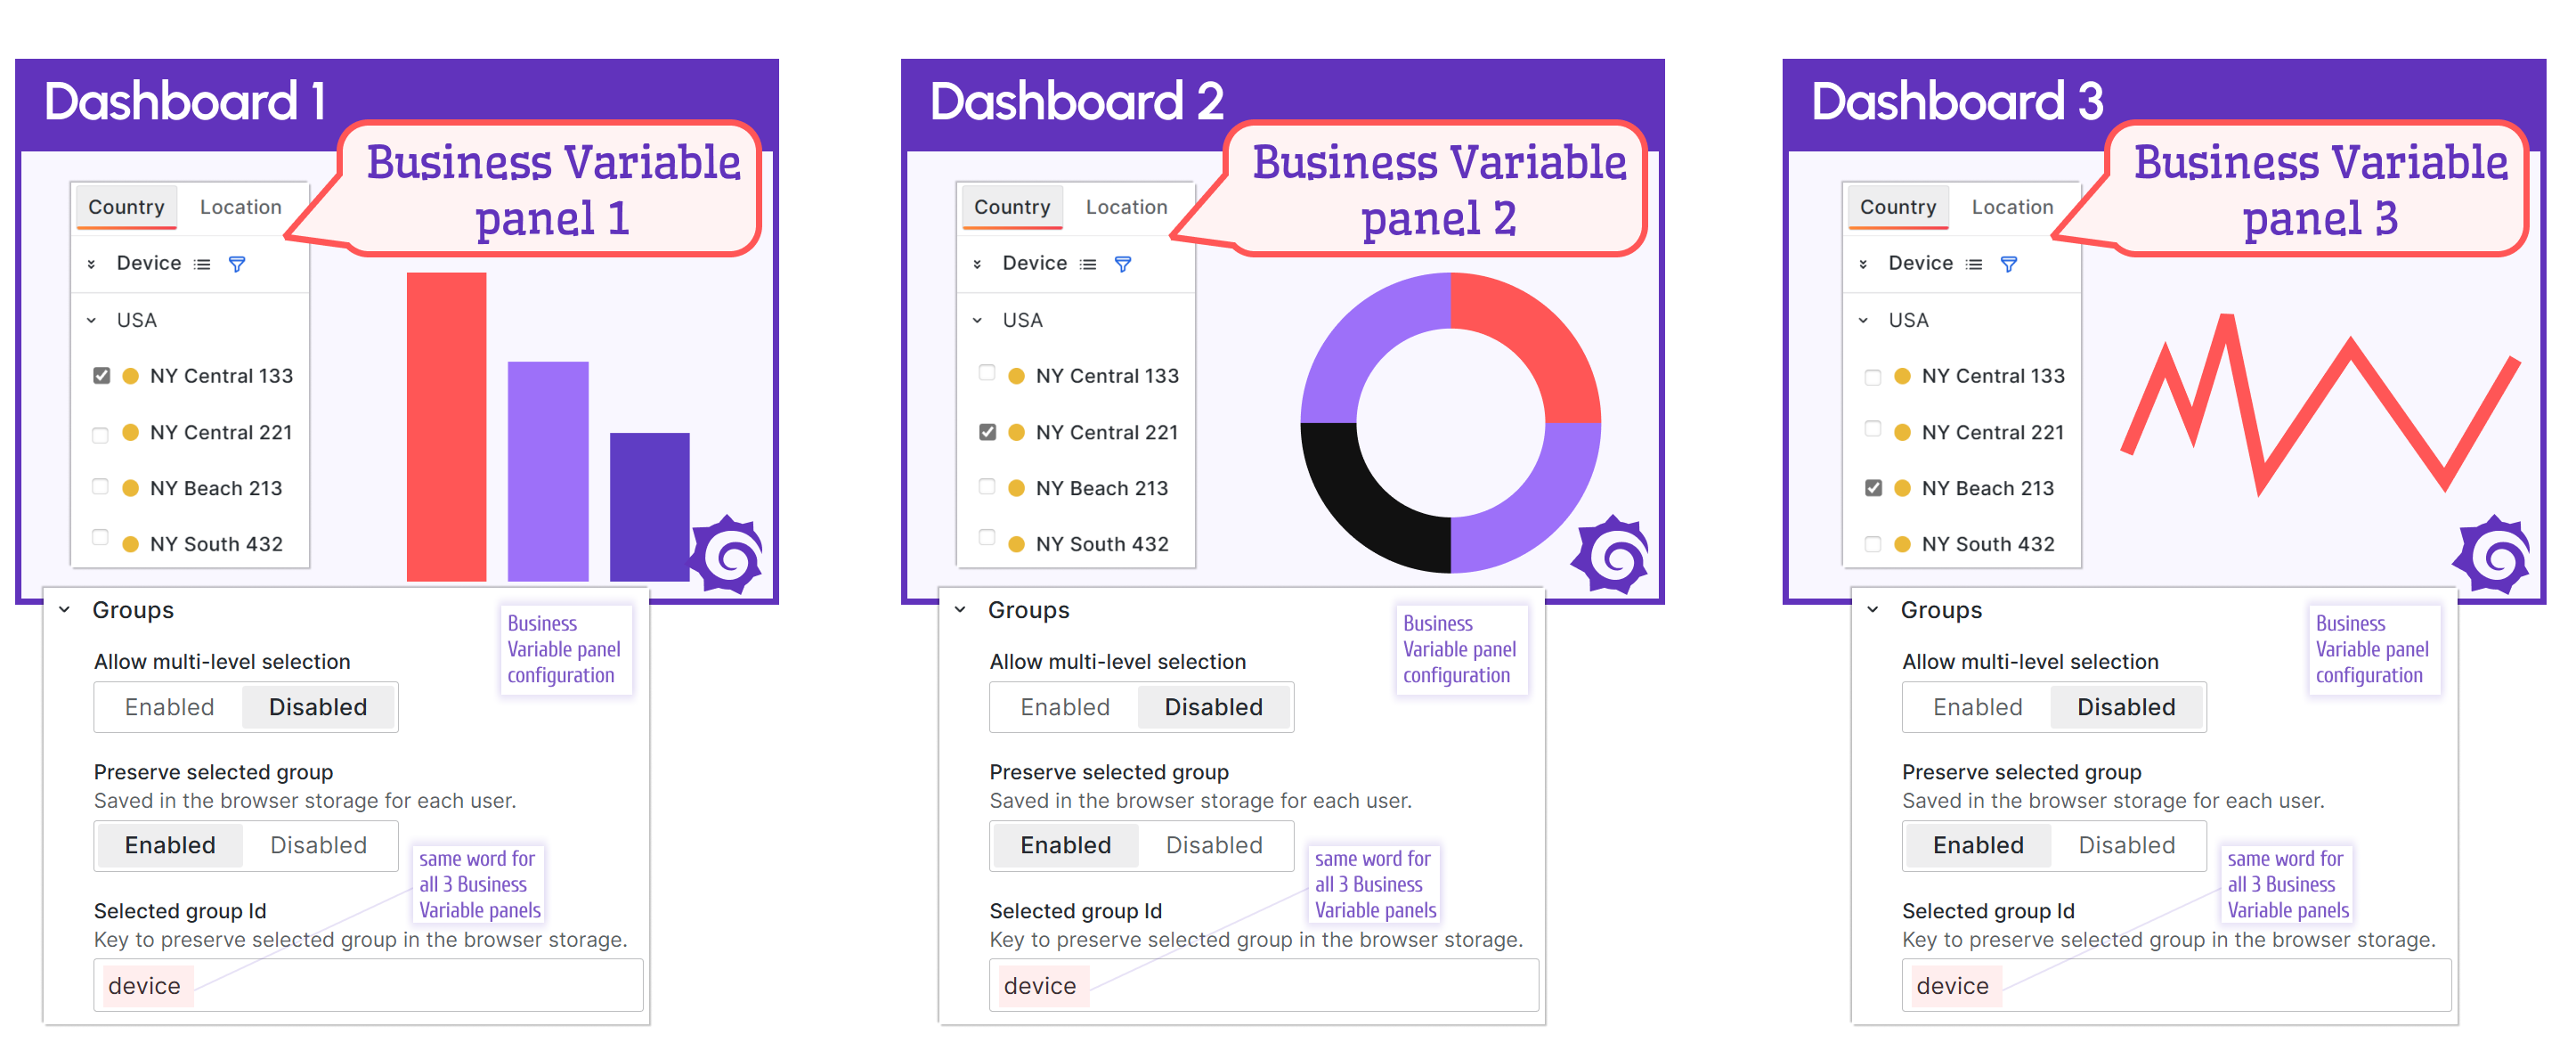
To configure the preservation of the selected tab, you need the Selected group id parameter from the Groups category. Choose a unique word and specify it across all dashboards where you have the Business Variable panel and need to preserve the selected tab.
In the illustration below, you can see three different dashboards with an identical Business Variable panel on each. All three Business Variable panels have the same word device in the Selected group id parameter.
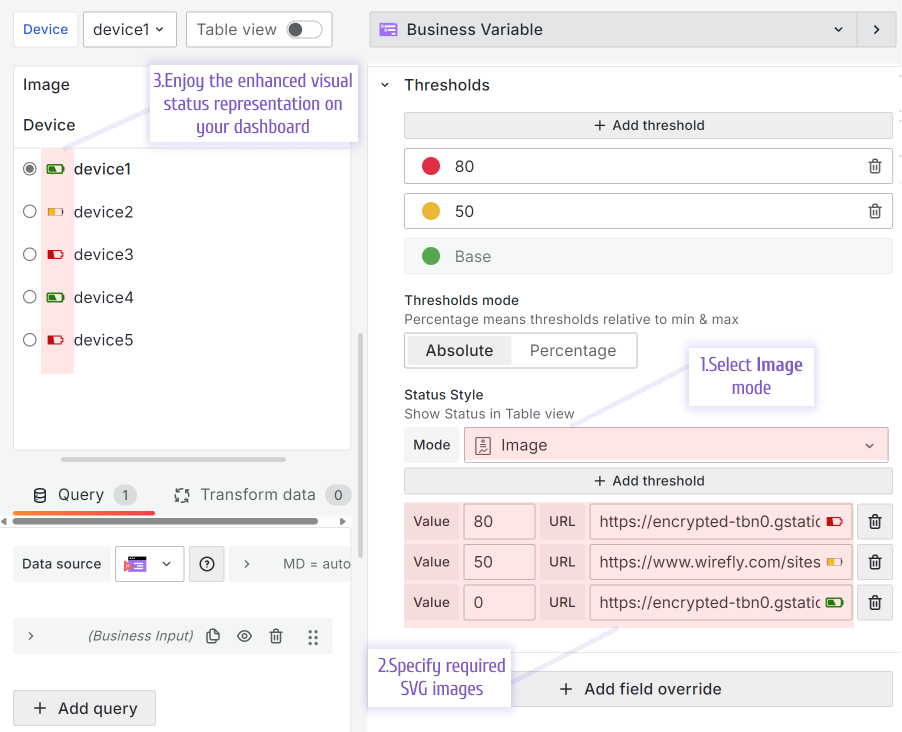
Custom image for the Grafana Thresholds
The Business Variable supports the Custom image feature starting from version 3.4.0.
Grafana Thresholds functionality provides a better visual representation of data on your dashboard. To enhance it, we added the possibility of specifying an SVG image instead of a simple colored circle!
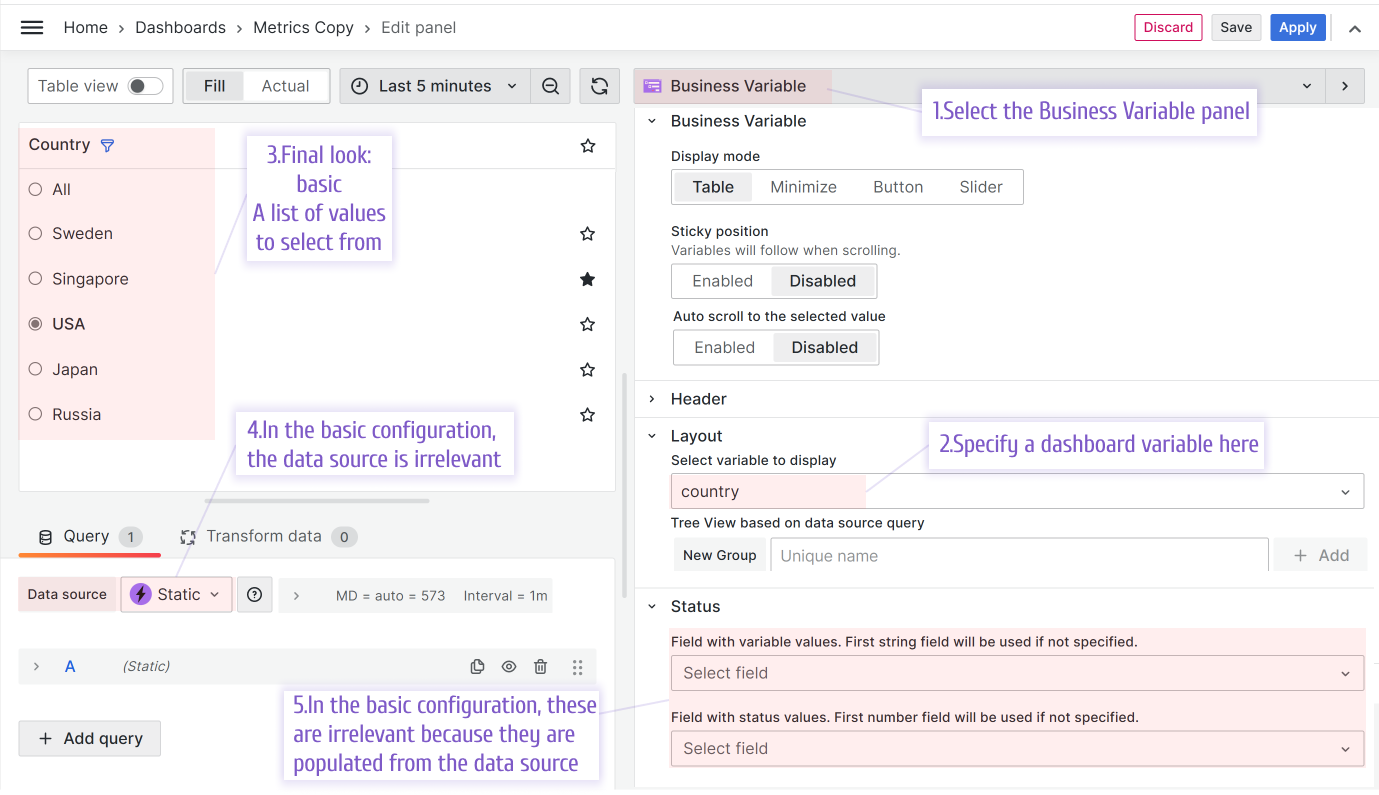
Advanced. Select dependent variable to reset
The Business Variable panel supports this feature starting from version 3.0.0.
The Select dependent variable to reset option is for advanced Business Variable panel users. This option is created to jump over some default Grafana functionality.
Grafana saves the dashboard variable values for better performance and reuses them whenever possible. This is majorly helpful. However, there are some scenarios when it is not aligned with the best user experience.
To better understand the new parameter, first, outline the participating concepts:
- dashboard variable,
- dashboard variable query,
- selected current value,
- dashboard variable refresh/update,
- dashboard variable reset.
A dashboard variable usually is a set of values retrieved following the rules set by a dashboard developer. Though, there could be many possible ways to set the rules, for simplicity, let's call them all a dashboard variable query.
A dashboard variable might have a selected current value (or values).
A dashboard variable refresh/update is when the dashboard variable query is called to retrieve the whole set of values. If previously the selected current value existed, Grafana specifies it as well right after the refresh/update.
Thus, there are two steps in the dashboard variable refresh/update.
The Select dependent variable to reset option instructs Grafana to perform only the first step: to rerun the dashboard variable query and omit the second step, meaning NOT to assign a selected current value.
The first step without the second is called dashboard variable reset.
With all that in mind, we can define what Select dependent variable to reset option does.
It links two dashboard variables and instructs Grafana to reset one of them after the value of the first one is changed.
The two scenarios below provide use-case examples of when the dashboard variable reset is needed.
Scenario 1
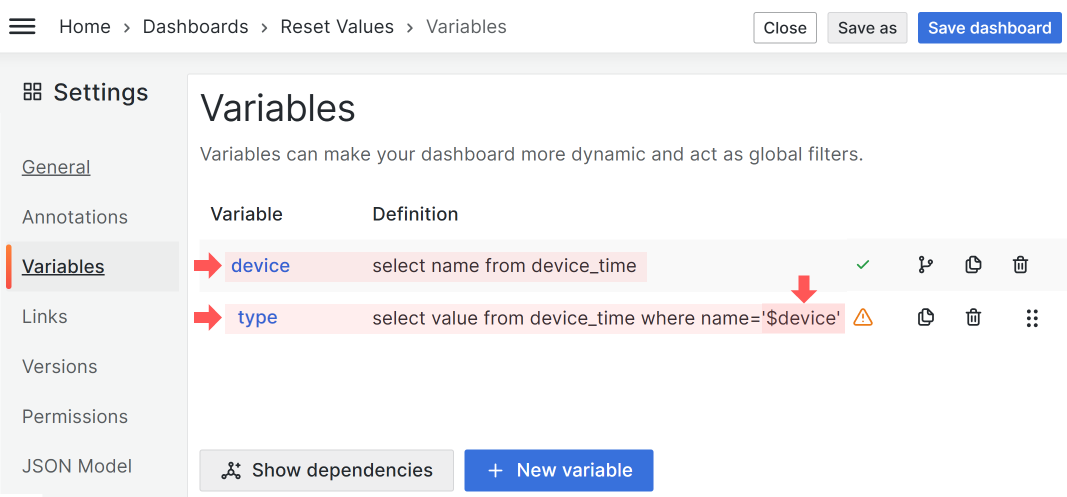
In this scenario, we have two dashboard variables:
devicewhich is populated by the query
select name from device_time;
typewhich is populated by the query that is dependent on the first variable
select value from device_time where name='$device';
With this configuration, whenever the device variable is updated (a value is selected in the dashboard drop-down, etc.), the other variable type automatically gets refreshed/updated. That means that the query to populate the type variable is run with every device variable value update.
Let's say that some of the values of the type variable overlap. In the example below, we have:
 - device 1, type in ('1', '2', '3'),
 - device 2, type in ('2', '3'),
 - device 3, type in ('3'),
The value '3' is common for all devices. The value '2' is shared by device 1 and device 2 and the value '1' is unique for the first device.
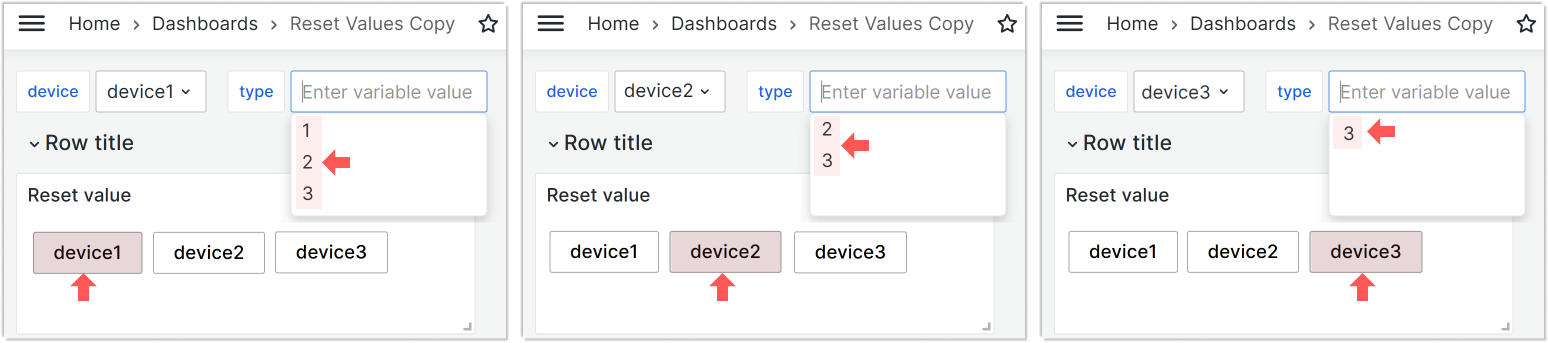
If you set type to '3', then with switching devices in the device variable, you will always see '3' in the type variable. The type variable gets refreshed/updated (the underlying query is rerun), and following that Grafana will set it to '3' (to the previously selected value).
If you set type to 1 (not overlapping value, the value '1' is unique to one device), then with every switch of the device variable, the type gets refreshed/updated (the underlying query is rerun) and the first retrieved value is displayed. Grafana can not set to the value selected previously since there is no such value for device 2, and for device 3.
The Select dependent variable to reset parameter ensures that overlapping values do not matter.
The variable name you specify in the Select dependent variable to reset always will be reset and the value to display will be taken from the first retrieved, not from the previous selections.
Scenario 2
Variables do not have to depend on each other. In this scenario, the type variable has the Custom type. The values are specified directly separated by a comma.
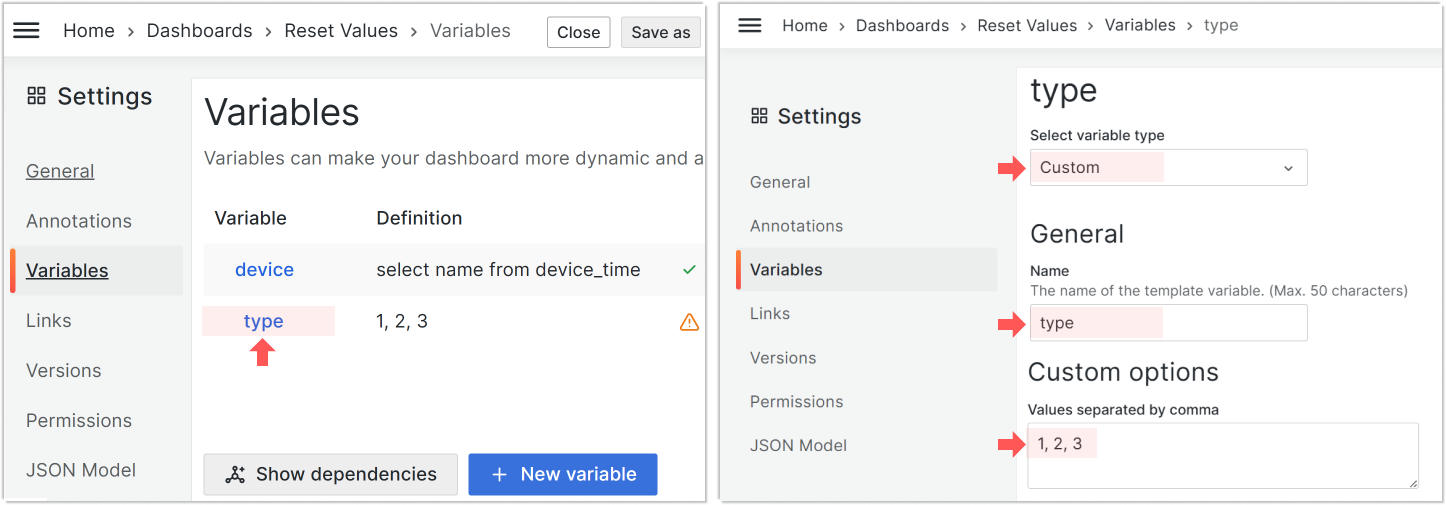
With the Custom dashboard variable type, two dashboard variables are not linked in any way and act independently. This means the refresh/update of the device variable does nothing to the type variable.
In this scenario, using the new Select dependent variable to reset parameter is the only option to trigger the type variable reset following the device variable refresh/update.