Dashboard redirect, search improvements, and tree view updates in Business Variable 2.2.0

We are happy to announce the release of the Variable panel 2.2.0. This release includes the following updates:
- Added dashboard redirect option.
- Search usability improvements:
- Added clean filter value button.
- Added a new option Always Visible Search.
- TreeView usability improvements:
- Added group rename functionality(edit button).
- Expanded action area to expand a treeview node.
- Updated Safari layout and alignment for favorites.
- Added compatibility with Grafana 10.2.1.
Dashboard redirect option
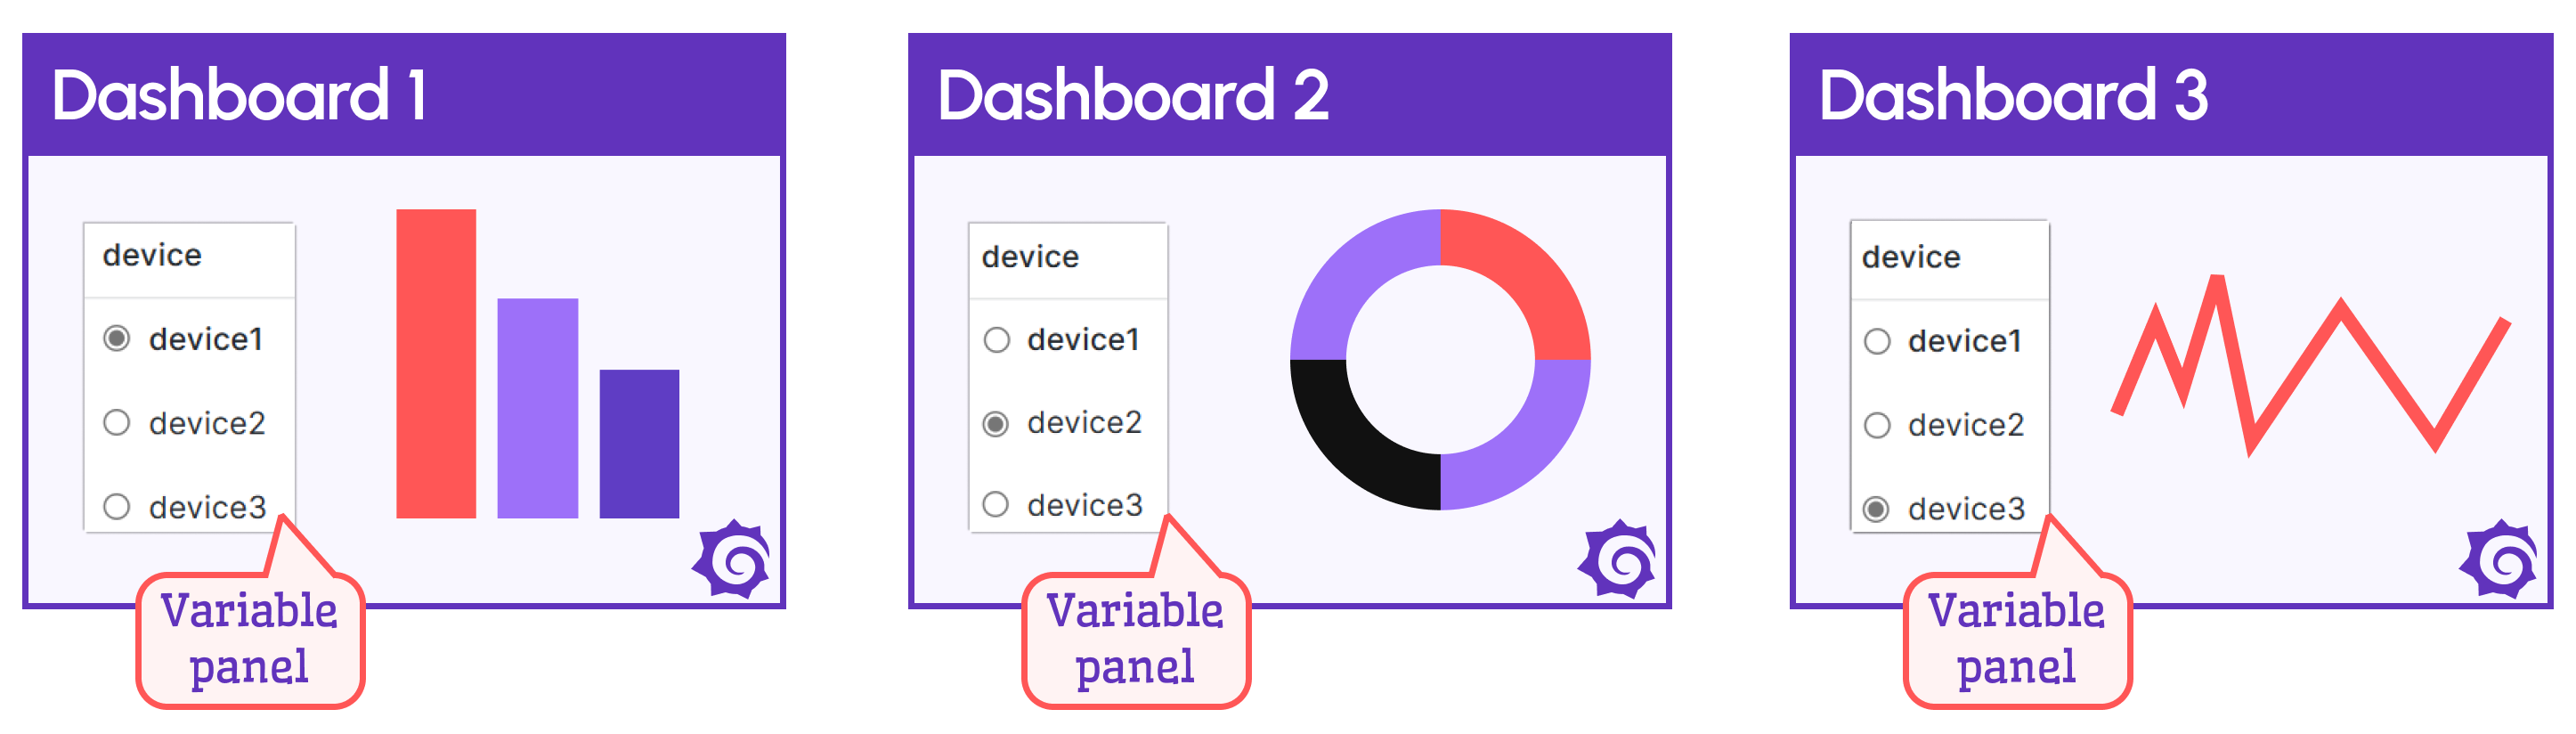
This feature allows opening the corresponding dashboard to a variable value. It is useful, for instance, if a variable panel displays a list of some devices where every device requires a specific dashboard.
When a user selects a device in the variable panel, the corresponding dashboard opens. With that, the dashboard switch is not obvious for the users. For them, it might seem they stay in one place.
Let us review, how to make it work.
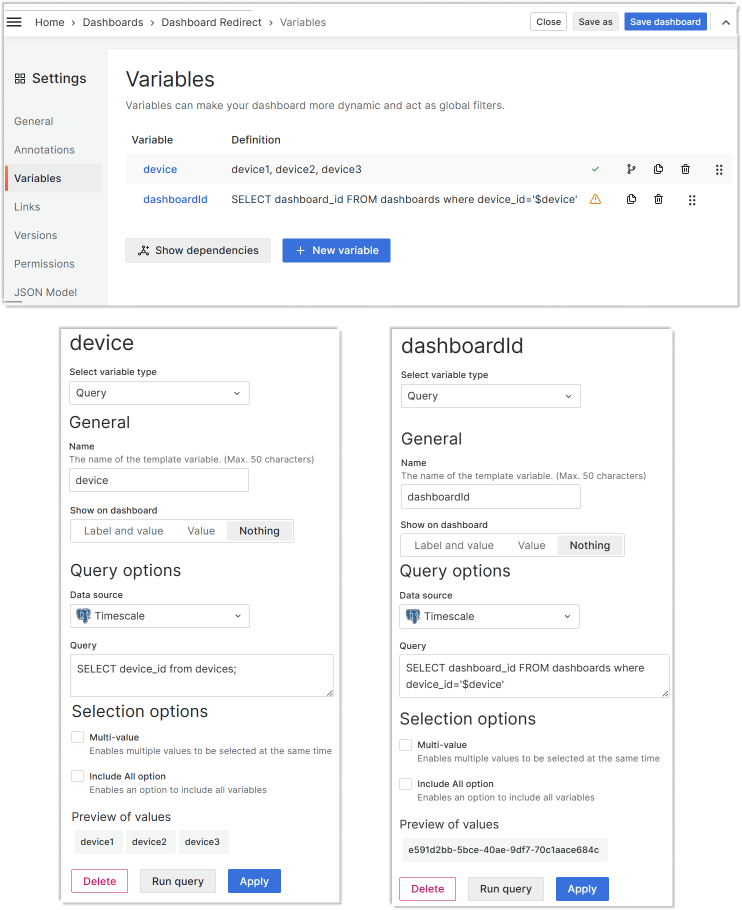
Map dashboard variables
Create two dashboard variables. One to retrieve all devices needed. The second is to contain one dashboard_id at a time following the device from the first variable.
Dashboards
Create specific device dashboards with an identical variable panel on each dashboard.
Variable panel
Configure the variable panel. Specify a value for the new parameter Dashboard.
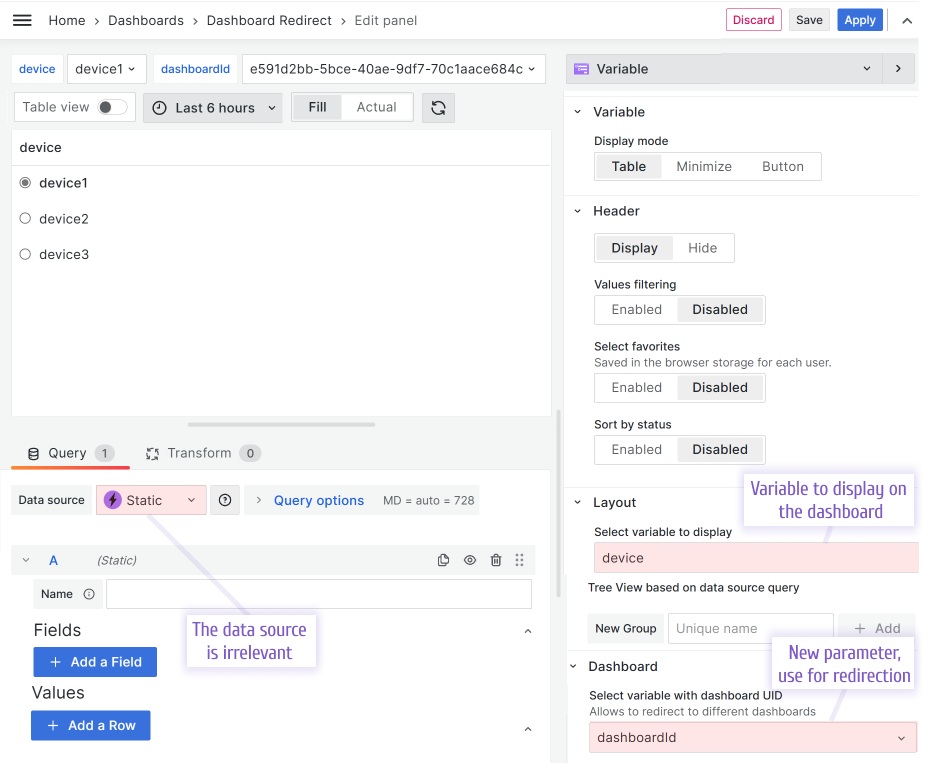
After the above-presented configuration, the variable panel switches dashboards when a user selects a device. A sleek transition makes the user experience smooth and pleasant.
Search usability
Two features make the search user experience better.
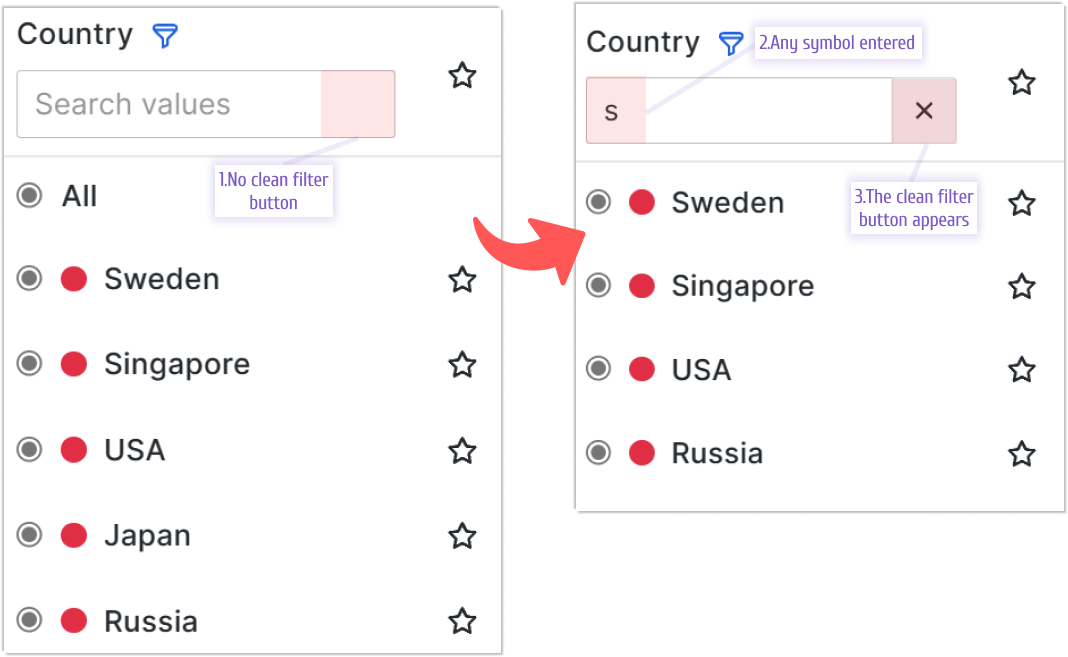
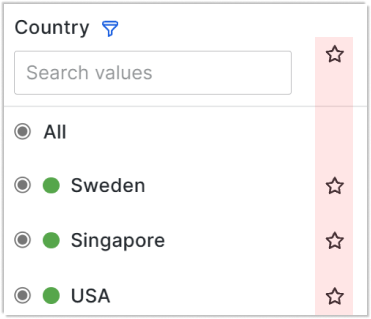
Clean filter value button
It is a small, but very nice improvement. Once you start typing in the search text field, you can remove all entered symbols by using an X button appearing at the far-right corner of the search text.
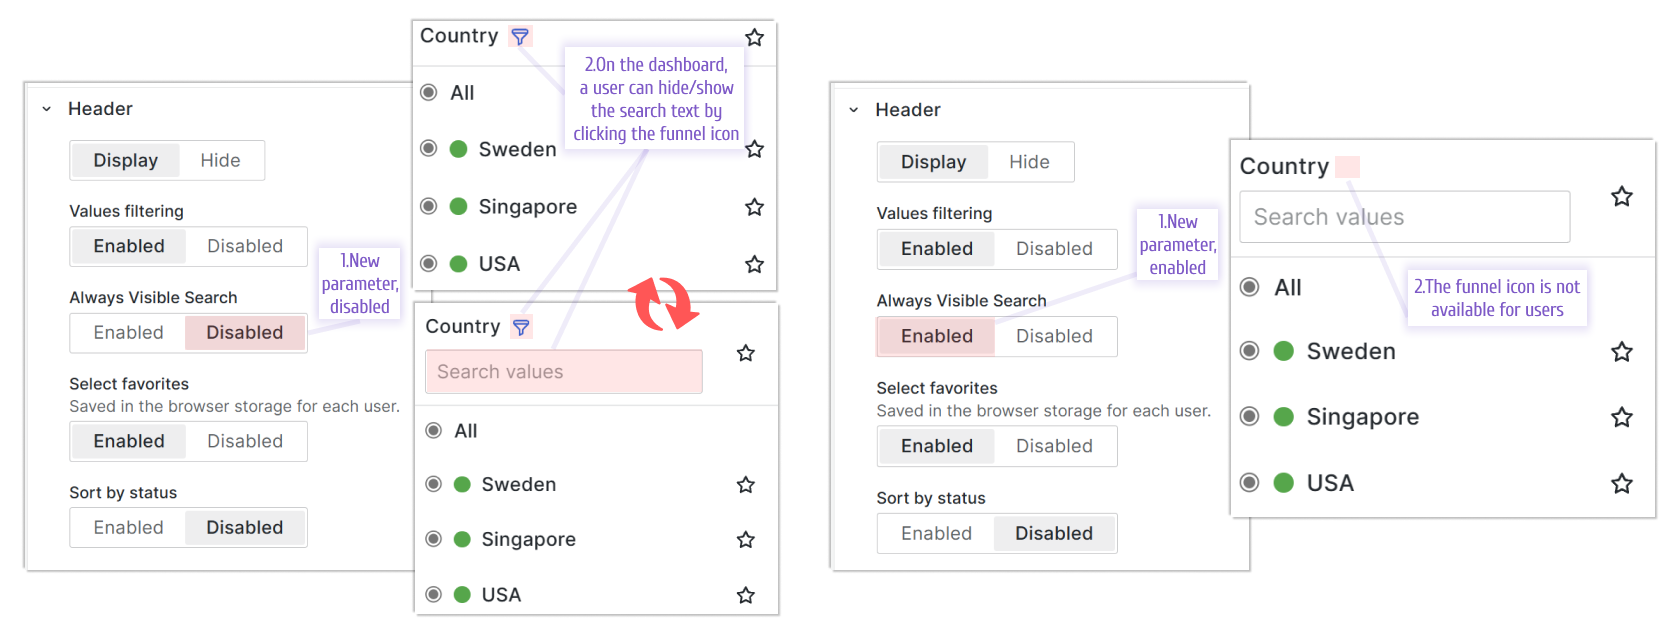
Always Visible Search option
The ability to hide a search text area can be taken away from users by using a new option Always Visible search.
When it is Disabled, the funnel icon is shown on the dashboard. By clicking on the funnel icon, users can alternate between hiding and showing the search text area.
When it is Enabled, the funnel icon is hidden and with that users are not capable of hiding the search text area.
Tree View improvements
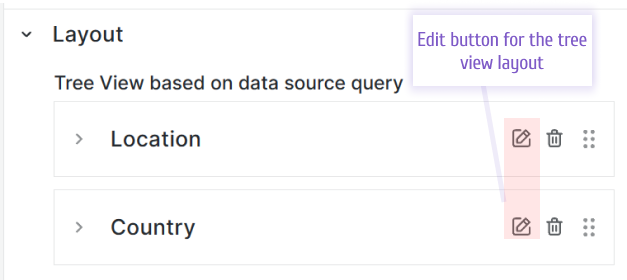
Group rename
Now you can rename a group in the TreeView layout.
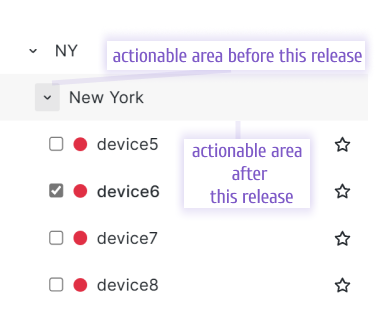
Expand by clicking anywhere
Before this feature, in order to expand the tree node, you had to be very precise and aim exactly at the arrow next to the name. After this release, clicking anywhere on the whole row with the name expands the tree node.
Updated Safari layout
In the Safari web browser, the positioning of star icons indicating the favorites is now aligned in the same style as in all other browsers.
Getting Started
The Business Variable panel can be installed from the Grafana Catalog or utilizing the Grafana command line tool.
For the latter, please use the following command.
grafana cli plugins install volkovlabs-variable-panel
Tutorial
This video reviews the latest features introduced in Business Variable 3.0.0.
Daria demonstrates many new options for the Minimize mode, such as
- allow empty value,
- allow custom values,
- maximum visible values.
For the Table mode, she explains how to display total and selected counts. Further, Daria introduces a Slider mode and touches upon the TreeView layout improvements and advanced features.
For the all plugin options overview, please refer the other video.
We have many other tutorials that you can find helpful. You can review all related to this plugin tutorials here.
Release Notes
Features / Enhancements in 2.2.0
- Add dashboard redirect option (#92)
- Update ESLint configuration and sort imports (#93)
- Update Safari layout for favorites (#97)
- Update to Grafana 10.2.1 (#98)
- Add clean filter value button (#99)
Features / Enhancements in 2.1.0
- Add an option for an always-visible search filter (#83)
- Add Group rename functionality (#84)
- Add selecting fields from data frames without RefId (#85)
- Add toggle expanded row state by clicking on the label (#86)
Bugfixes in 2.1.0
- Update the deselection of All variable value which is not defined in the URL (#87)
- Removed ability to add group to favorites (#88)
We're Always Happy to Hear From You!
We value your feedback and are eager to connect with our community and partners. Whether you have a question, an idea, or an issue to report, here’s how you can reach out:
- Community Members: Have a question, want to suggest a new feature, or found a bug? We’d love to hear from you! Please create a GitHub issue to start the conversation.
- Enterprise Partners: Need assistance or have an urgent request? Open a Zendesk ticket for a prompt and dedicated response from our team.
- Join the Conversation: Stay updated and share your thoughts! Subscribe to our YouTube Channel and leave your comments—we can’t wait to hear what you think.
Your input helps us improve, so don’t hesitate to get in touch!