Grafana 11, slider view, and user experience improvements in Business Variable 3.0.0

We are happy to announce the release of the Business Variable panel 3.0.0. This release includes the following updates:
- Plugin rebranding, the new name is the Business Variable panel.
- Minimize display mode. Added Maximum visible values parameter.
- Minimize display mode. Manual entry is possible.
- Table display mode. Added total and selected values count.
- New display mode: Slider.
- Enhanced the user experience within the multi-tab view.
- Advanced category. Added Select dependent variable to reset parameter.
- Tree view display mode. Smoothed the scroll and improved the user experience in general.
- Required Grafana 10 and Grafana 11. Breaking change.
Business Variable panel
The Variable panel joins the Business Suite for Grafana and with that gets an elevated name. Now, the same amazing open source plugin is called the Business Variable panel.
Please welcome the new name for the same functionality!
Downloads
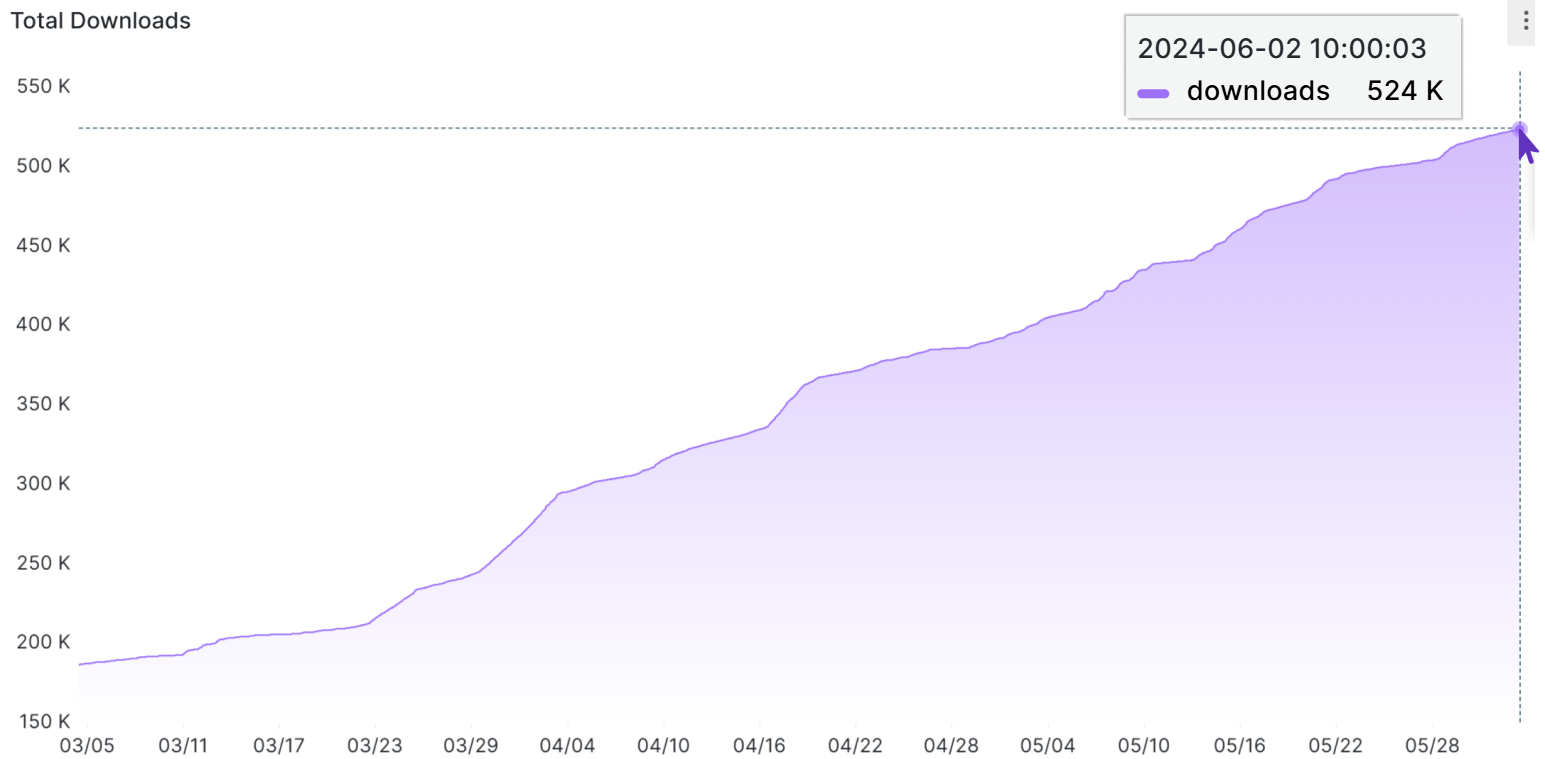
The Business Variable plugin shoots for the stars by reaching a milestone of 500,000 downloads! 👏
Maximum visible values
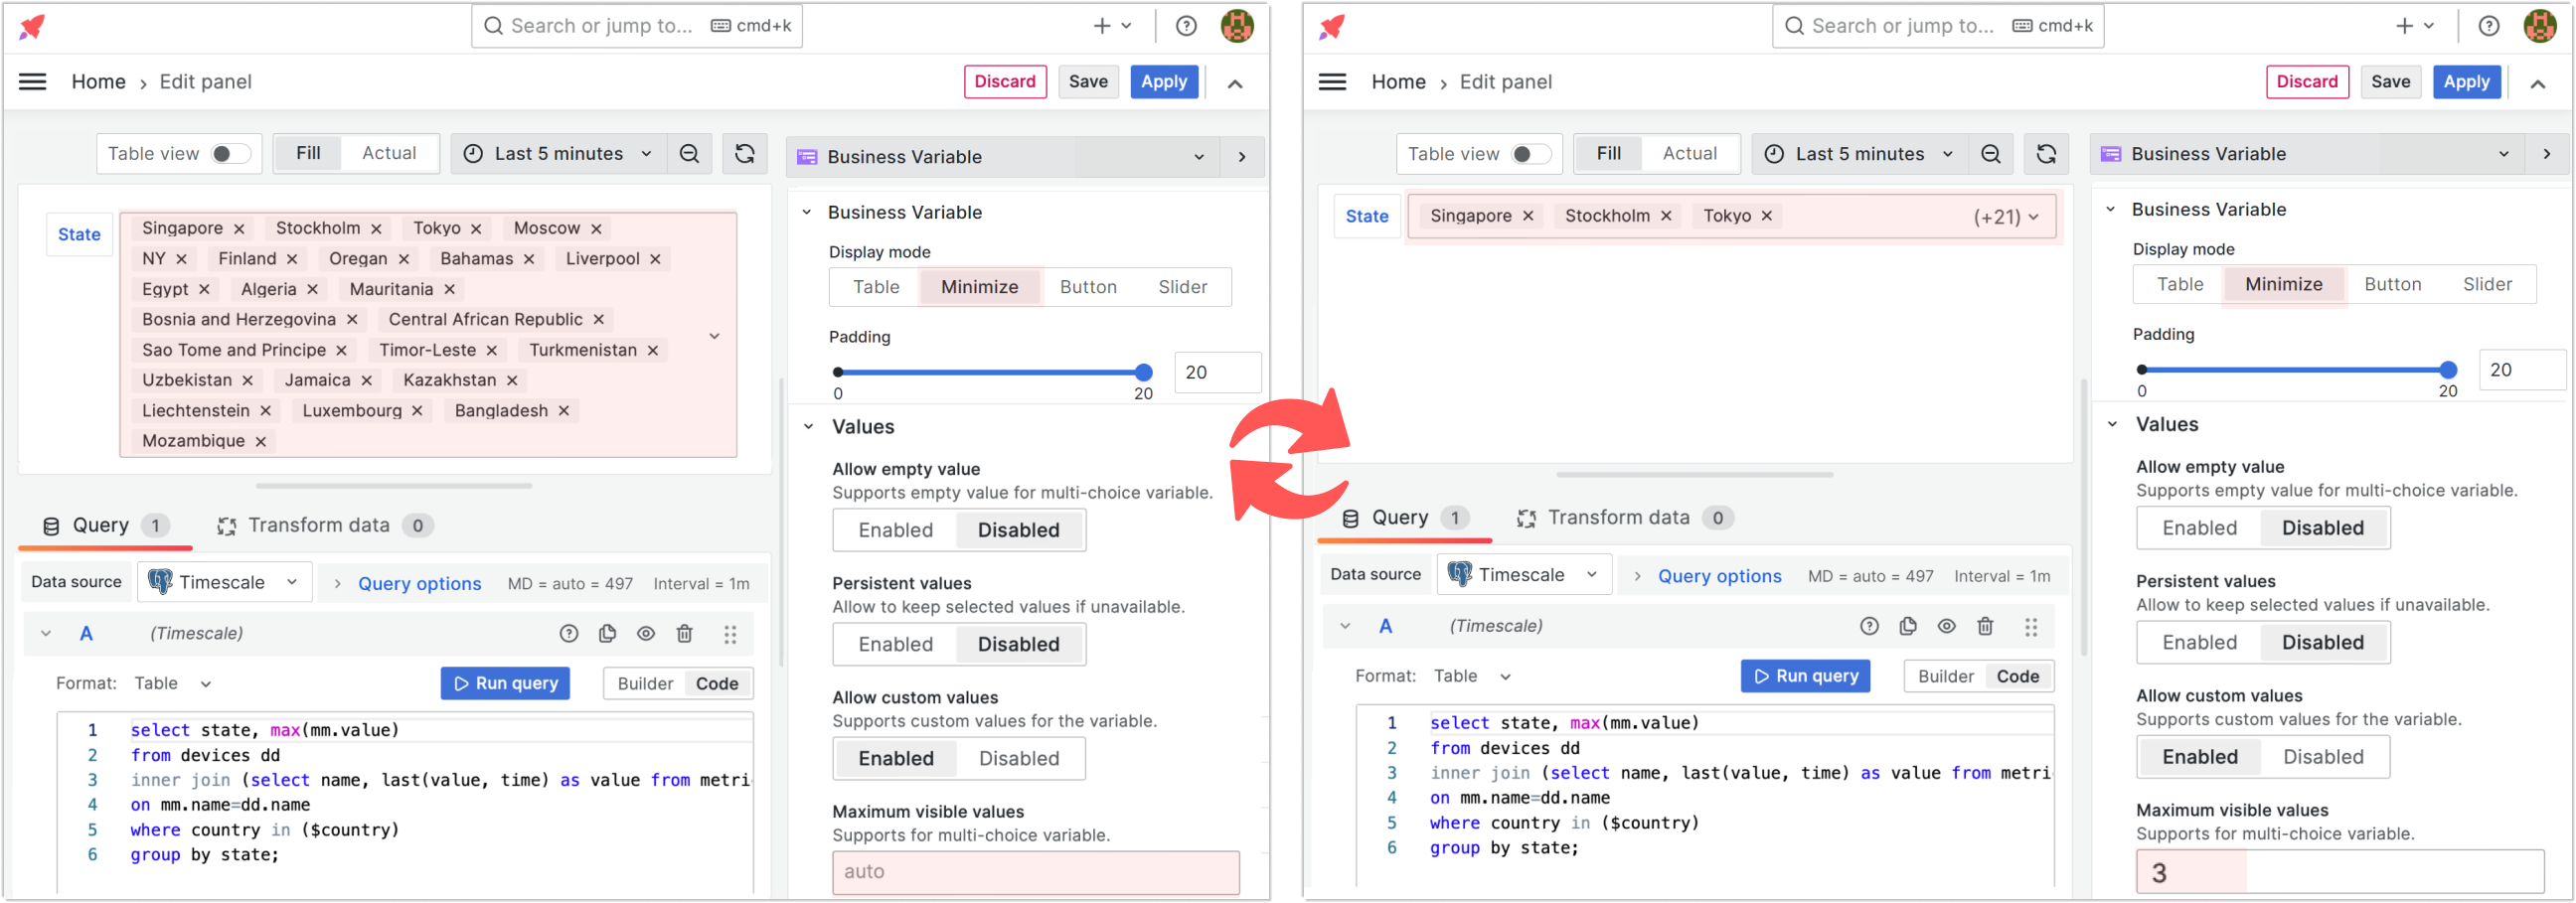
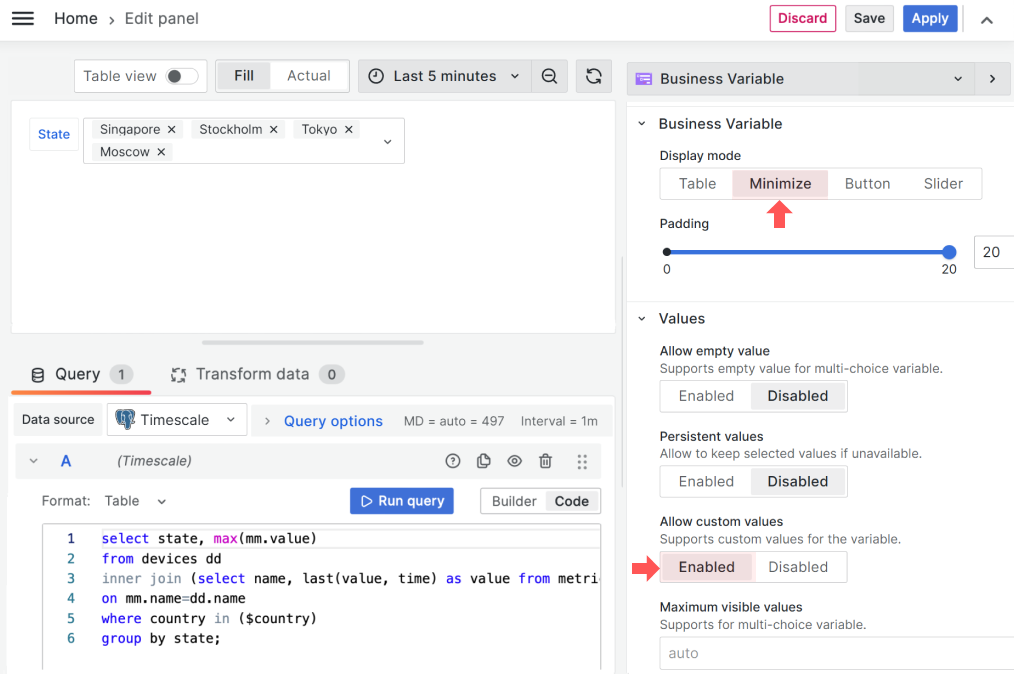
Maximum visible values is a new parameter added to the Values category. It is available when the Business Variable->Display mode is set to Minimize.
This parameter is helpful when your users select several options in the variable panel, as shown below (print screen on the left). In that event, the variable panel might take up too much screen space and distort the dashboard layout.
You have the flexibility to set the maximum number of visible on-screen options to avoid that.
For instance, in the picture below (print-screen on the right), the Maximum visible values parameter is set to 3, and the Business Variable panel looks more like what you expect from the Minimize mode - one line. Three options are left: Singapore, Stockholm, and Tokyo. The remaining are collected into (+21).
Manual entry
When in the Minimize display mode, you can allow users to enter the values to be selected manually.
The new parameter is called Allow custom values and is located in the Values category. Set it to Enabled to allow manual entry. By default, it is set to Disabled
The Allow Custom values parameter is available for the Minimize display mode.
Total and selected values count
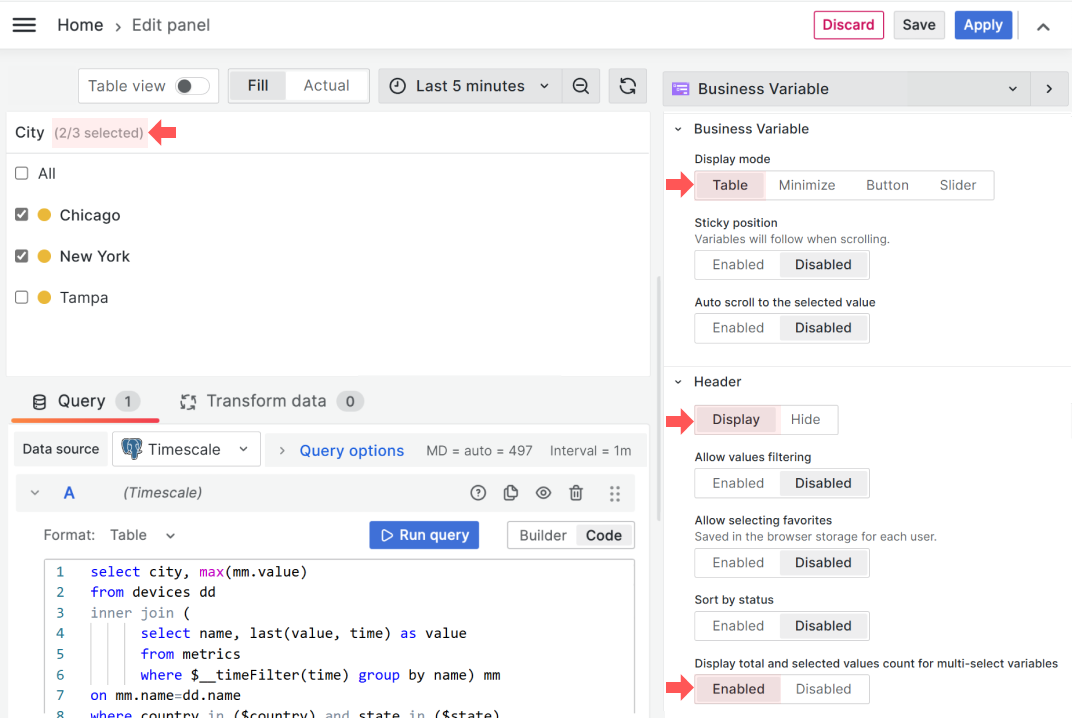
In the Table display mode, you can now choose to Display total and selected values count for multi-select variables. The Header must be in the Display mode to see the new parameter.
The new parameter is the enable/disable type. The total count appears next to the header in a gray font color where the first number indicates how many values are selected and the second how many are available for selection in total.
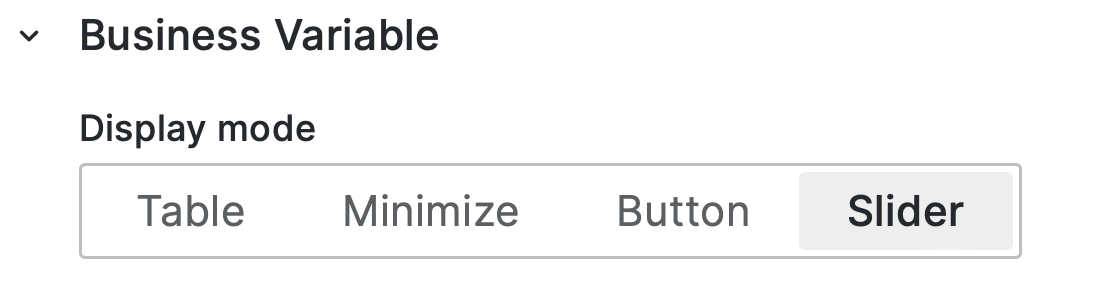
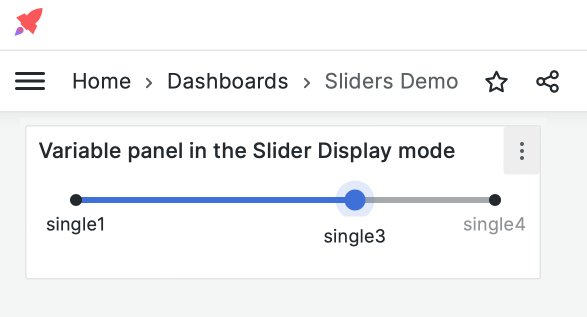
Slider display mode
The Slider is a new Display mode under the Business Variable category.
When a dashboard variable contains a massive volume of values and only one selected value is logically acceptable, the Slider display mode is your way to go. For instance, a user needs to choose a year as shown below. A standard alternative (long dropdown list) is shown for comparison.
The Slider display mode works only for the Single-value dashboard variables.
Text values also could be displayed using the Slide display mode.
Multi-tab view improvements
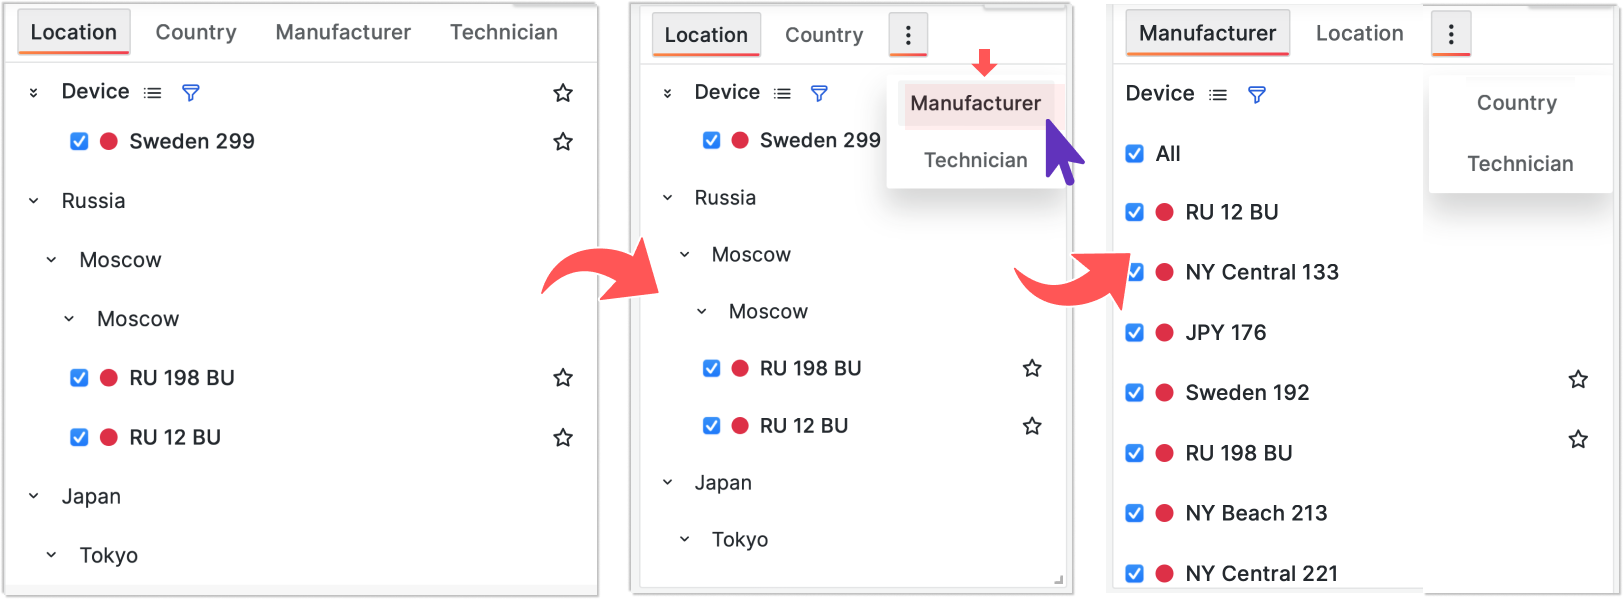
Tab auto-grouping
The ability to auto group tab adds even more sophistication to the Business Variable panel. When too many tabs are located side by side, the panel collects the overflowing tabs and shows the three vertical dots instead. Upon clicking on the dots, a user sees the rest of the tabs in a drop-down for selection.
The Business Variable panel shifts the selected tab on the very left among all other tabs.
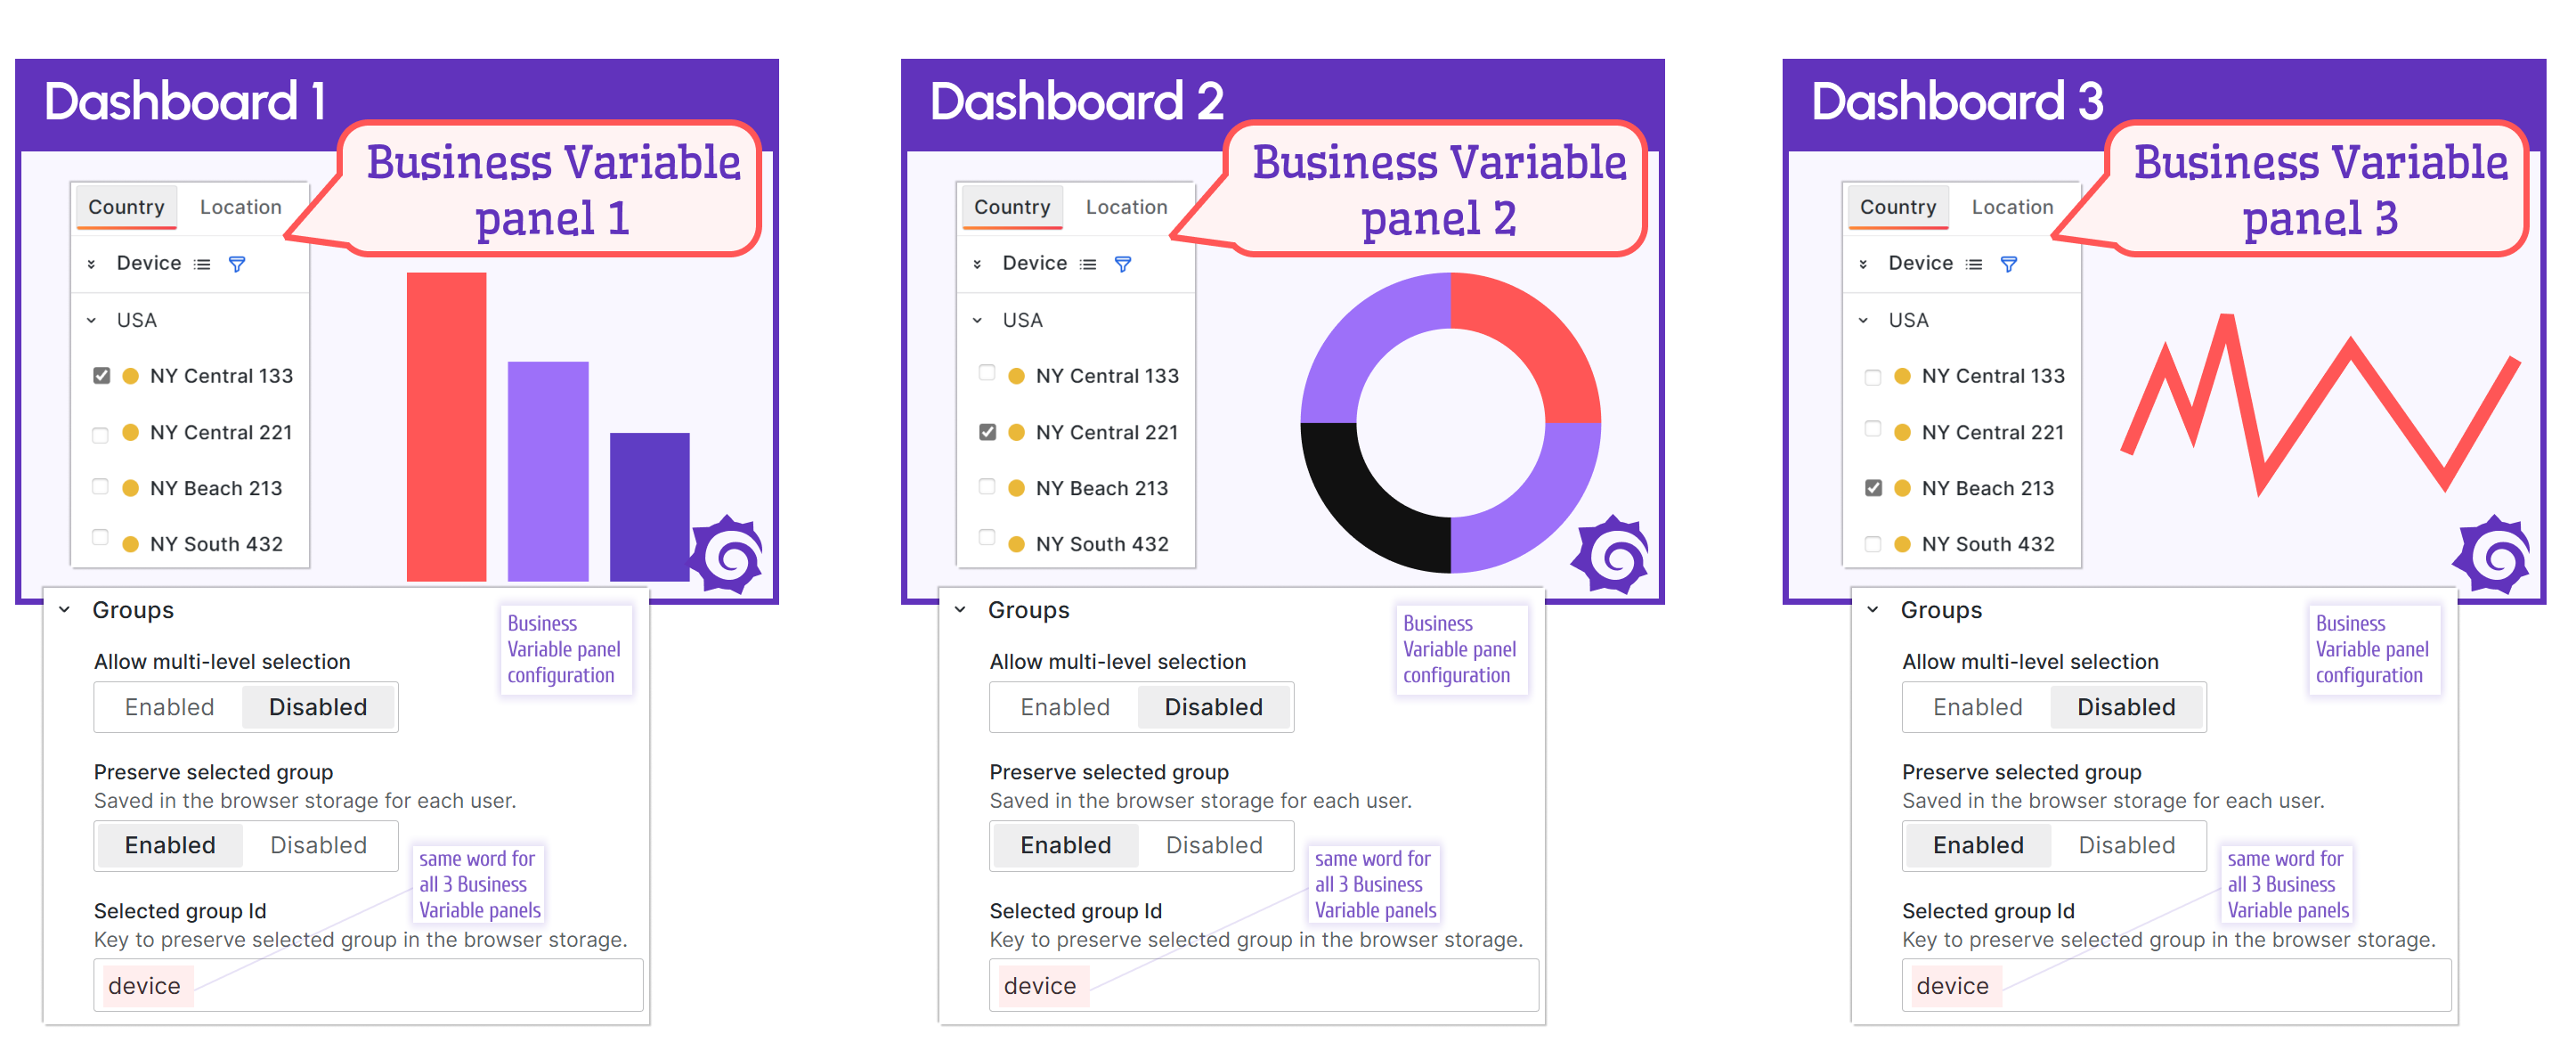
Selected tab preservation
You might have the cloned Business Variable panel across many dashboards. With that, a user can switch to a different dashboard without realizing it. To enhance the user experience even further, you can now save the selected tab while redirecting a user and open a new dashboard with the tab that the user selected prior.
To configure the preservation of the selected tab, you need the Selected group id parameter from the Groups category. Choose a unique word and specify it across all dashboards where you have the Business Variable panel and need to preserve the selected tab.
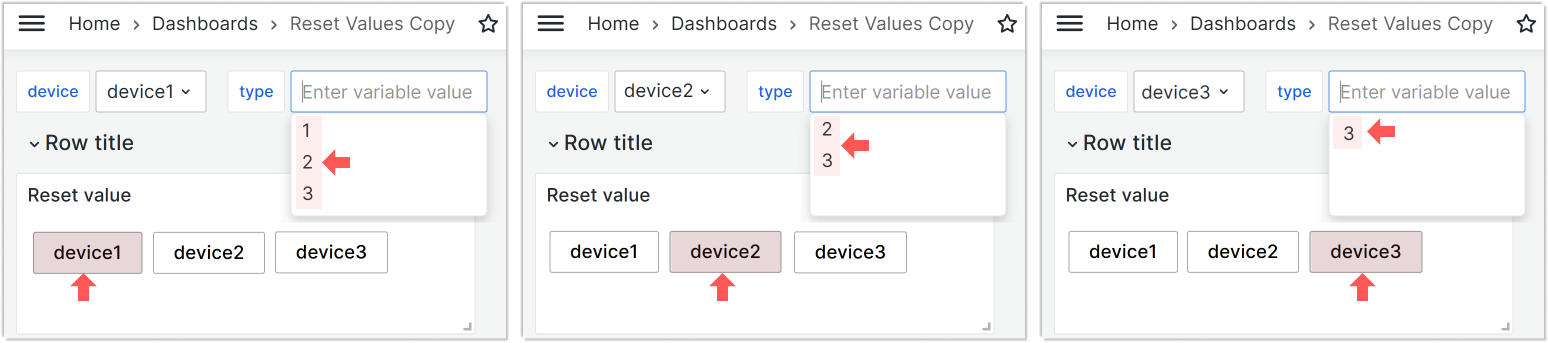
In the illustration below, you can see three different dashboards with an identical Business Variable panel on each. All three Business Variable panels have the same word device in the Selected group id parameter.
Advanced. Select dependent variable to reset
The Select dependent variable to reset option is for advanced Business Variable panel users. This option is created to jump over some default Grafana functionality.
Grafana saves the dashboard variable values for better performance and reuses them whenever possible. This is majorly helpful. However, there are some scenarios when it is not aligned with the best user experience.
To better understand the new parameter, first, outline the participating concepts:
- dashboard variable,
- dashboard variable query,
- selected current value,
- dashboard variable refresh/update,
- dashboard variable reset.
A dashboard variable usually is a set of values retrieved following the rules set by a dashboard developer. Though, there could be many possible ways to set the rules, for simplicity, let's call them all a dashboard variable query.
A dashboard variable might have a selected current value (or values).
A dashboard variable refresh/update is when the dashboard variable query is called to retrieve the whole set of values. If previously the selected current value existed, Grafana specifies it as well right after the refresh/update.
Thus, there are two steps in the dashboard variable refresh/update.
The Select dependent variable to reset option instructs Grafana to perform only the first step: to rerun the dashboard variable query and omit the second step, meaning NOT to assign a selected current value.
The first step without the second is called dashboard variable reset.
With all that in mind, we can define what Select dependent variable to reset option does.
It links two dashboard variables and instructs Grafana to reset one of them after the value of the first one is changed.
The two scenarios below provide use-case examples of when the dashboard variable reset is needed.
Scenario 1
In this scenario, we have two dashboard variables:
devicewhich is populated by the query
select name from device_time;
typewhich is populated by the query that is dependent on the first variable
select value from device_time where name='$device';
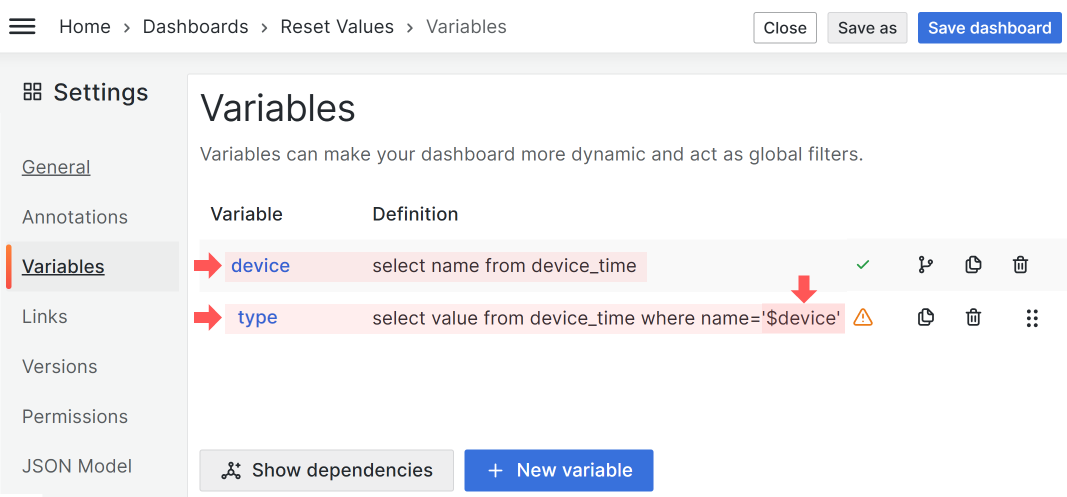
With this configuration, whenever the device variable is updated (a value is selected in the dashboard drop-down, etc.), the other variable type automatically gets refreshed/updated. That means that the query to populate the type variable is run with every device variable value update.
Let's say that some of the values of the type variable overlap. In the example below, we have:
 - device 1, type in ('1', '2', '3'),
 - device 2, type in ('2', '3'),
 - device 3, type in ('3'),
The value '3' is common for all devices. The value '2' is shared by device 1 and device 2 and the value '1' is unique for the first device.
If you set type to '3', then with switching devices in the device variable, you will always see '3' in the type variable. The type variable gets refreshed/updated (the underlying query is rerun), and following that Grafana will set it to '3' (to the previously selected value).
If you set type to 1 (not overlapping value, the value '1' is unique to one device), then with every switch of the device variable, the type gets refreshed/updated (the underlying query is rerun) and the first retrieved value is displayed. Grafana can not set to the value selected previously since there is no such value for device 2, and for device 3.
The Select dependent variable to reset parameter ensures that overlapping values do not matter.
The variable name you specify in the Select dependent variable to reset always will be reset and the value to display will be taken from the first retrieved, not from the previous selections.
Scenario 2
Variables do not have to depend on each other. In this scenario, the type variable has the Custom type. The values are specified directly separated by a comma.
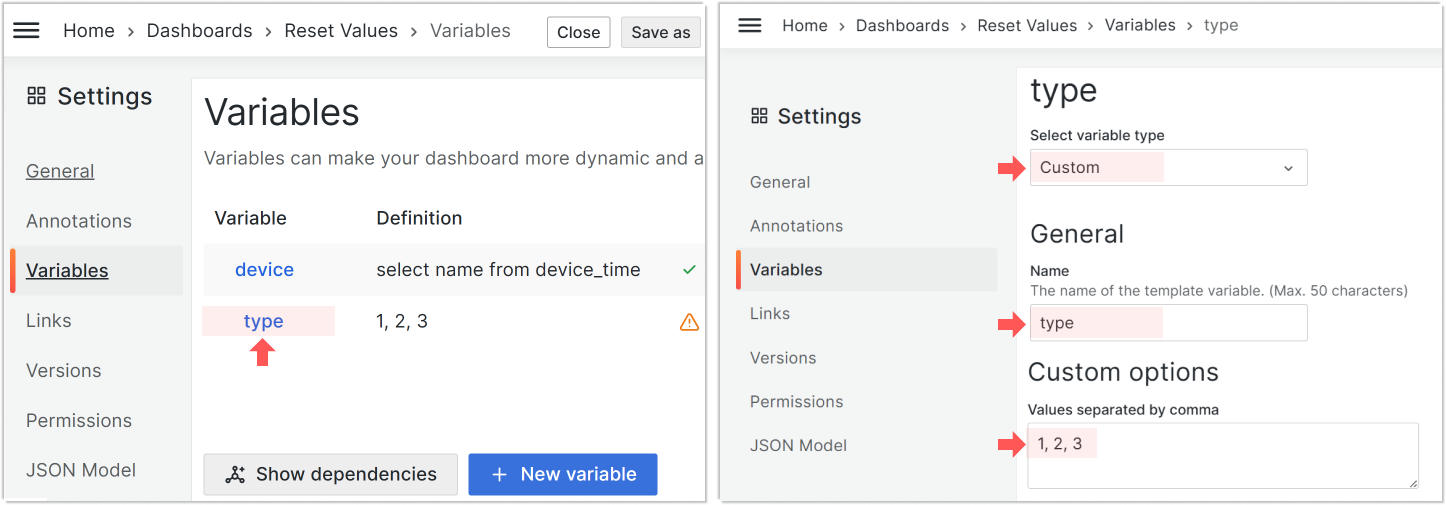
With the Custom dashboard variable type, two dashboard variables are not linked in any way and act independently. This means the refresh/update of the device variable does nothing to the type variable.
In this scenario, using the new Select dependent variable to reset parameter is the only option to trigger the type variable reset following the device variable refresh/update.
Improved Tree View display mode
In this release, we paid close attention to the user experience. We smoothed the scroll, worked on performance in general and improved a lot of little things.
Grafana 10 and Grafana 11
Grafana 9 is not supported.
Our plugins always follow the latest Grafana versions and stay compatible with the most recent releases. That means, however, that we have to sunset the support of obsolete releases.
The latest Business Variable panel 3.0.0 fully supports Grafana 10 and the upcoming 11 releases.
Getting Started
The Business Variable panel can be installed from the Grafana Catalog or utilizing the Grafana command line tool.
For the latter, please use the following command.
grafana cli plugins install volkovlabs-variable-panel
Tutorial
This video reviews the latest features introduced in Business Variable 3.0.0.
Daria demonstrates many new options for the Minimize mode, such as
- allow empty value,
- allow custom values,
- maximum visible values.
For the Table mode, she explains how to display total and selected counts. Further, Daria introduces a Slider mode and touches upon the TreeView layout improvements and advanced features.
For the all plugin options overview, please refer the other video.
We have many other tutorials that you can find helpful. You can review all related to this plugin tutorials here.
Release Notes
- Requires Grafana 10 and Grafana 11
Features / Enhancements in 3.0.0
- Updated selecting and deselecting multi-levels (#139)
- Updated Auto/Static Minimize label width (#144)
- Added show and hide Minimize label (#144)
- Added maximum visible values option in minimize view (#147)
- Added plugin e2e tests and remove cypress (#149)
- Added Row count in Table view (#148)
- Updated AutoScroll Behavior (#152)
- Added Slider View (#154)
- Prepared for Grafana 11 (#155)
- Updated Grafana 10.4.2 and dependencies (#158)
Features / Enhancements in 2.5.0
- Added the indeterminate state to the checkboxes (#127)
- Updated Tree View scrolling (#128)
- Added Responsive tabs (#130)
- Added support new items in Variable (minimize mode) (#134)
- Added Preserve selection of the group between dashboards (#135)
- Improved Tree view display and scroll (#136)
- Added Reset dependent variables when selecting the value (#138)
- Requires Grafana 9.2 and Grafana 10
Features / Enhancements in 2.4.0
- Updated video tutorial in README (#111)
- Updated timescale data (#119)
- Updated dependencies and Actions (#120)
- Updated the default color contrast (#122)
- Added preserve selected group option (#124)
- Added label for Button view (#125)
We're Always Happy to Hear From You!
We value your feedback and are eager to connect with our community and partners. Whether you have a question, an idea, or an issue to report, here’s how you can reach out:
- Community Members: Have a question, want to suggest a new feature, or found a bug? We’d love to hear from you! Please create a GitHub issue to start the conversation.
- Enterprise Partners: Need assistance or have an urgent request? Open a Zendesk ticket for a prompt and dedicated response from our team.
- Join the Conversation: Stay updated and share your thoughts! Subscribe to our YouTube Channel and leave your comments—we can’t wait to hear what you think.
Your input helps us improve, so don’t hesitate to get in touch!