Analyze alert rules
You can analyze the alert event details by utilizing the following interface elements.
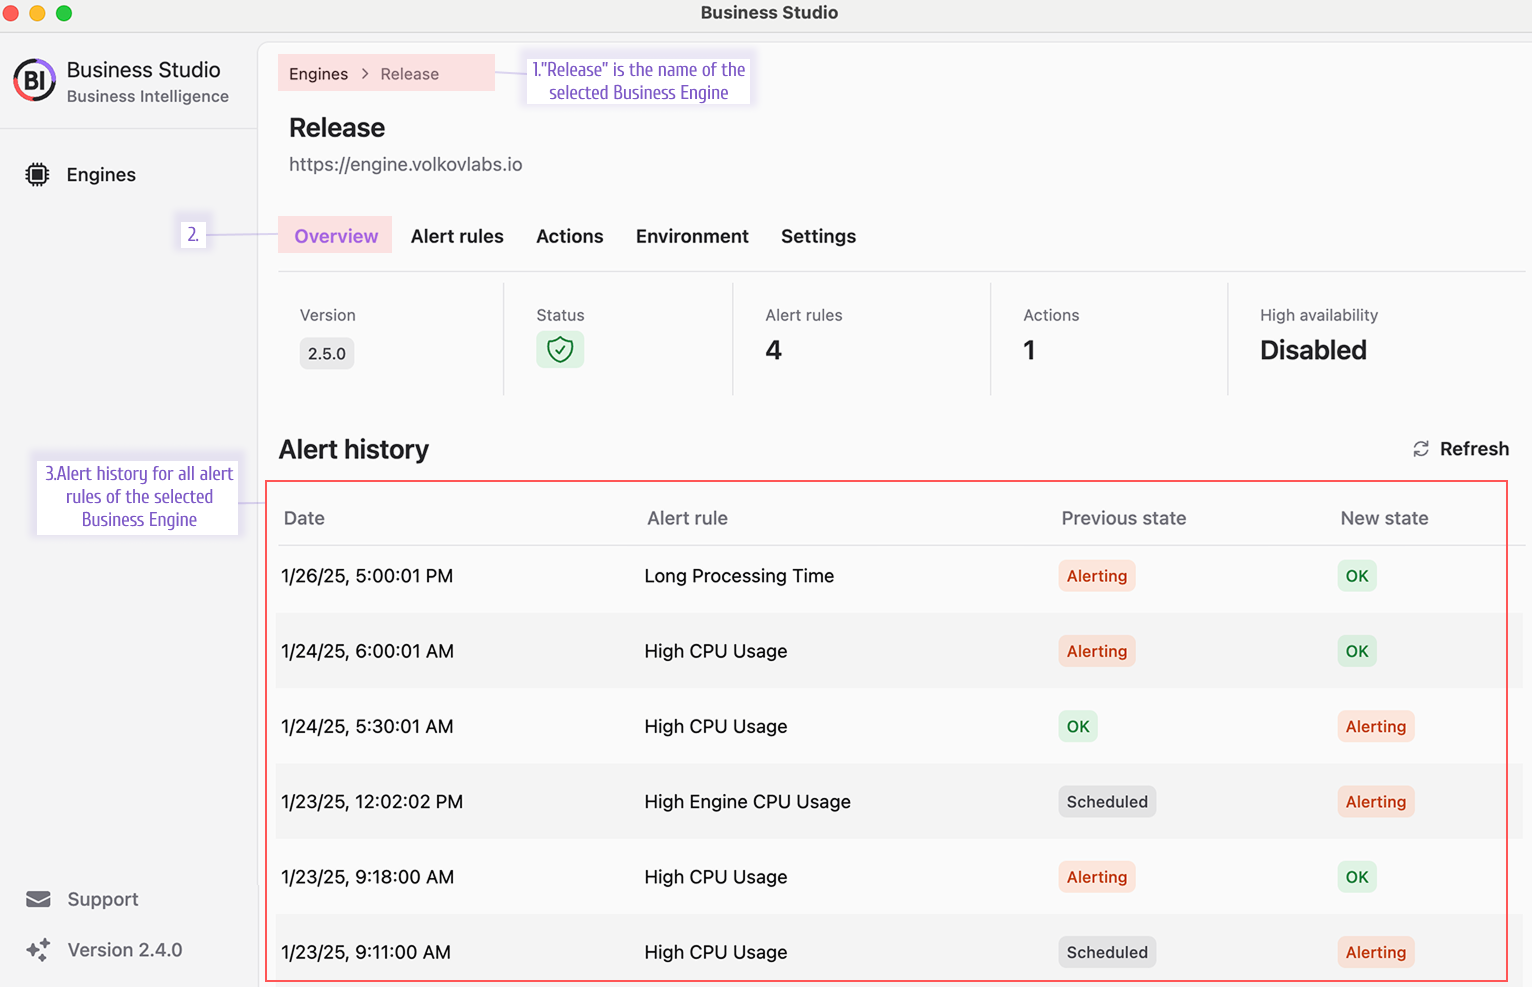
All alert rules
- Open a Business Engine of your interest.
- Open the Overview page.
- Review the Alert history of all alert records generated for the selected Business Engine.
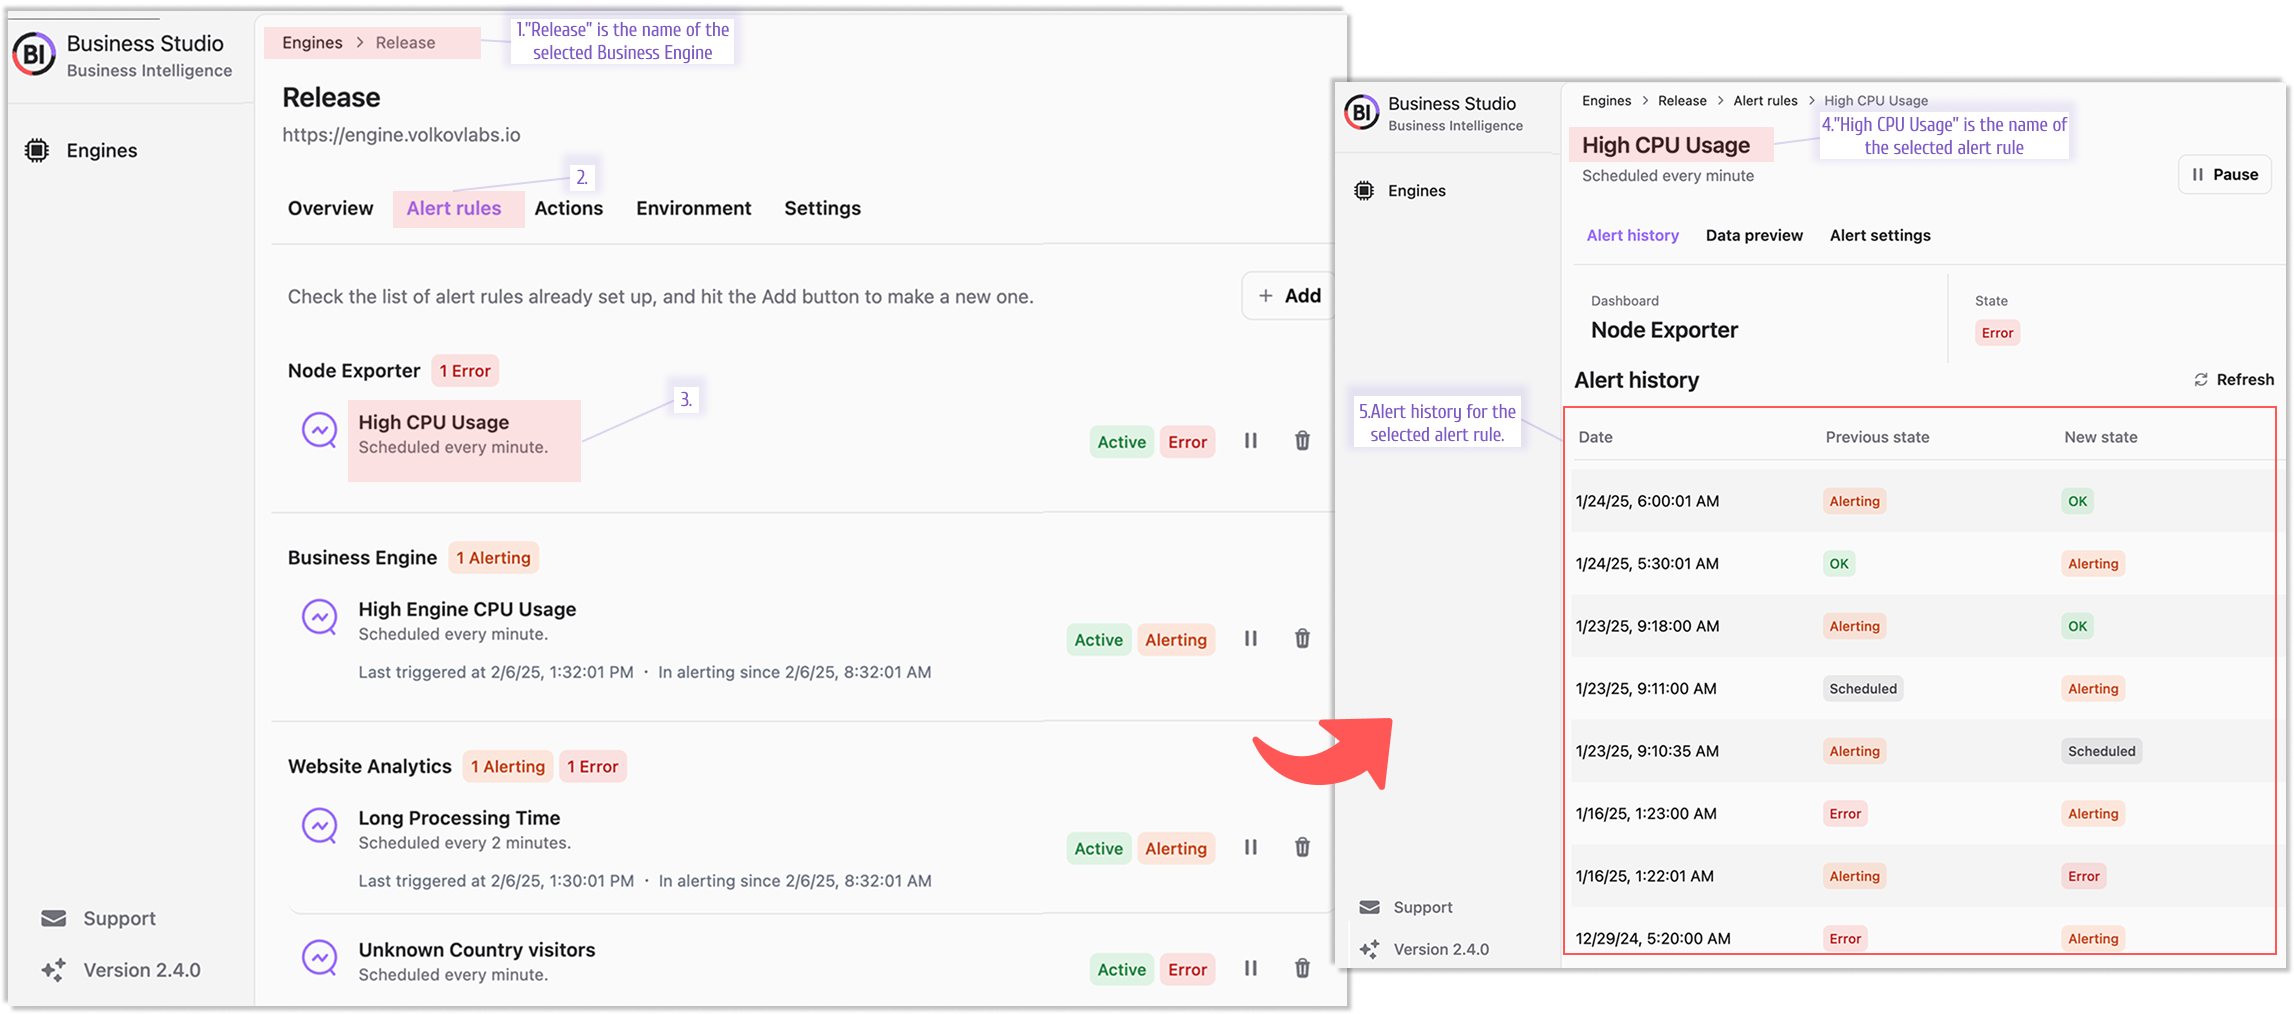
One alert rule
- Open a Business Engine of your interest.
- Open the Alert rules page.
- Click on the alert rule of interest.
- Review the Alert history of the selected alert rule.
You can click on any alert record to review details. If the latest alert state (New state) is Alerting, the Alert evaluations section shows the values that triggered the alert action.
You can always review the payload by clicking on the View as code button.
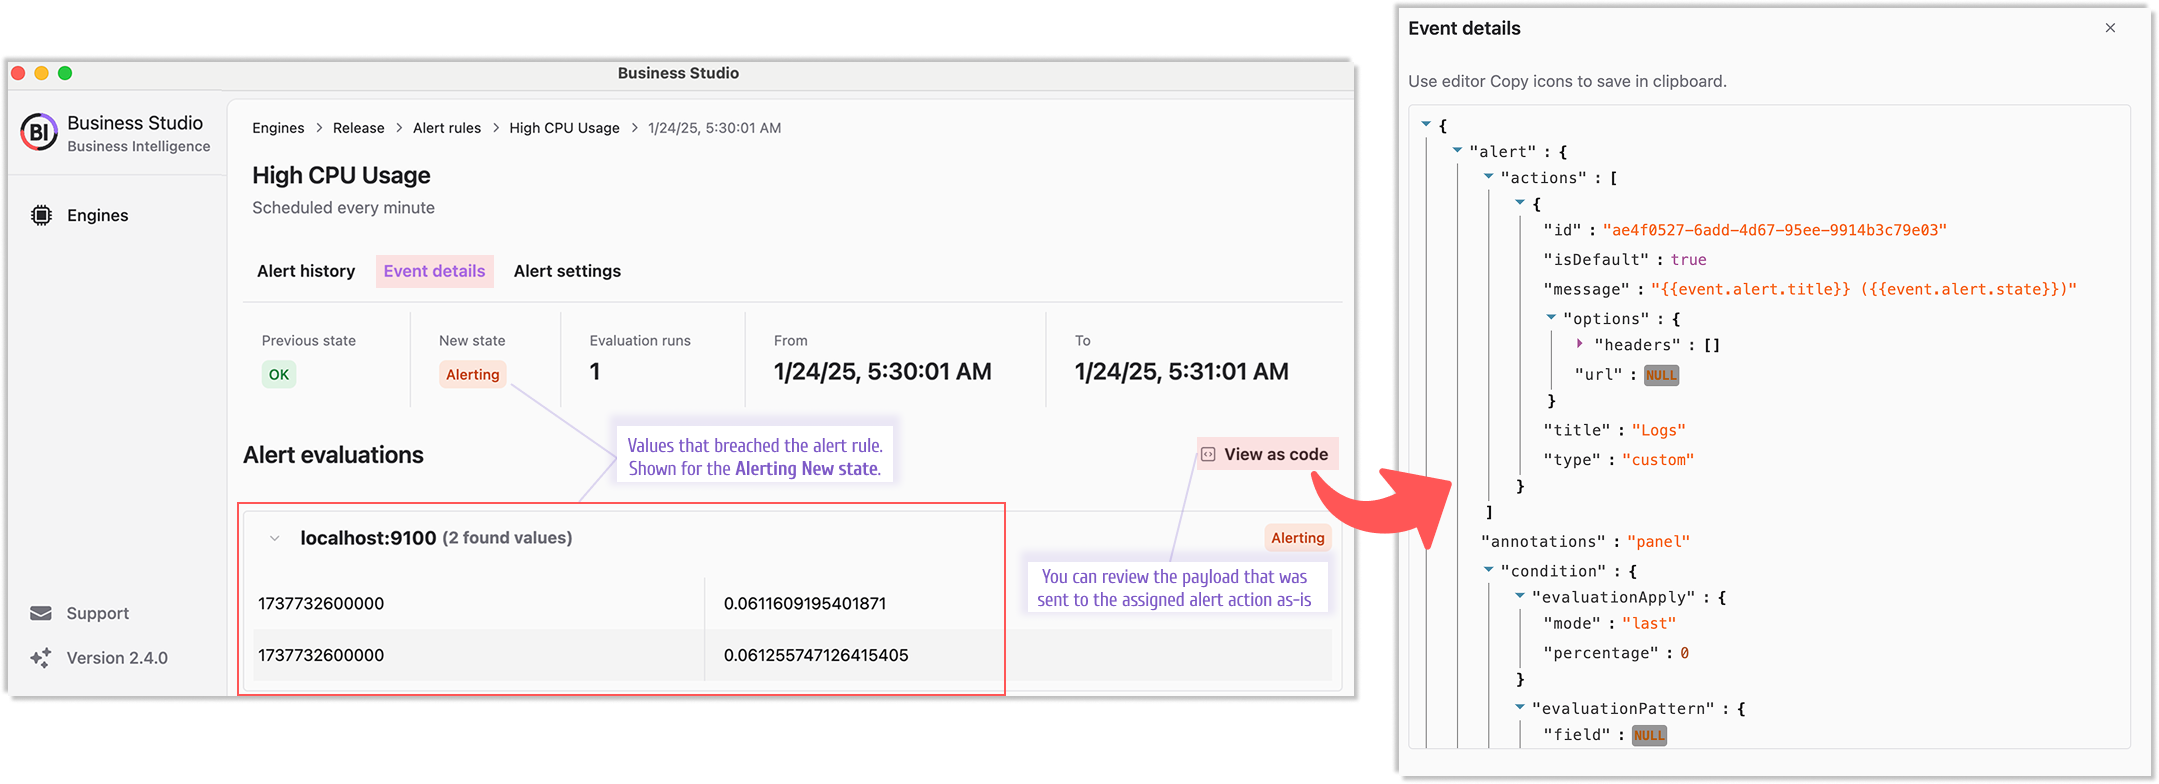
In the case of any other alert state (New state), the alert rule payload is displayed right away.
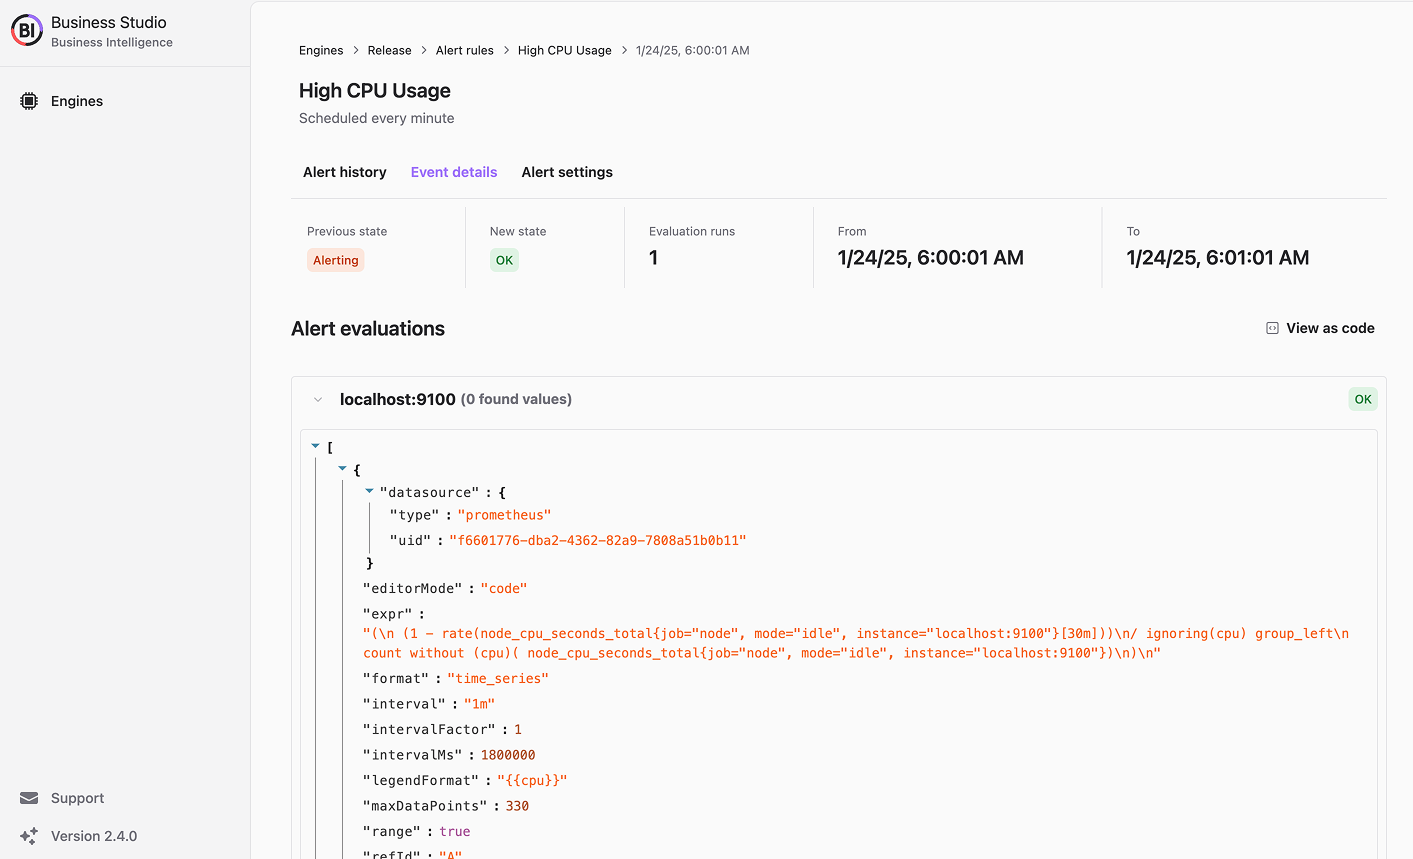
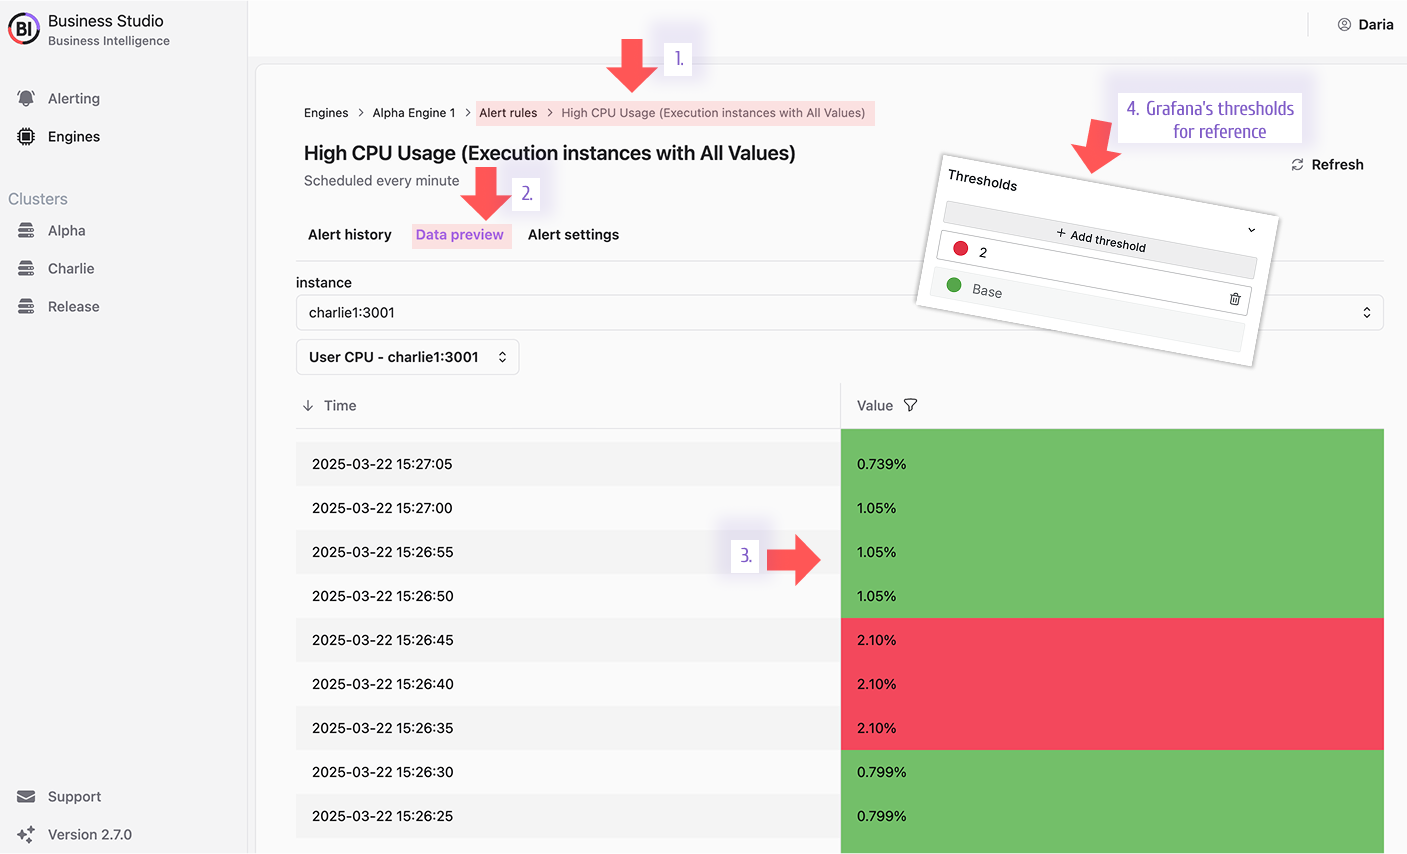
Alert Previews with Thresholds
The Data Preview page highlights thresholds with Grafana’s color-coded clarity, making it easier to spot trigger conditions at a glance. To check it out:
- Open an alert rule.
- Navigate to the Data Preview tab.
- View values with threshold colors applied (see reference below).
Review Grafana data frames in the Business Studio
To make the interaction between the Business Engine and Grafana more transparent, the Business Studio displays the Grafana data frames participating in the alert rule evaluation.
To review the Grafana data frame in the Business Studio:
- Open the alert rule of interest.
- Optionally, on the Alert settings page confirm the alert rule is assigned to the dashboard(2.1) and panel(2.2) of interest.
- Open the Data preview page.
- Optionally, verify the dashboard variable (data frame filter) is set up to the necessary value.
- Review the Grafana data frame in the Business Studio.
- Optionally, review the same data frame in Grafana. Open the panel in the Edit mode and switch to the Table view.
- Verify the dashboard variable (data frame filter) is set up to the necessary value.
- Review the data frame in Grafana.
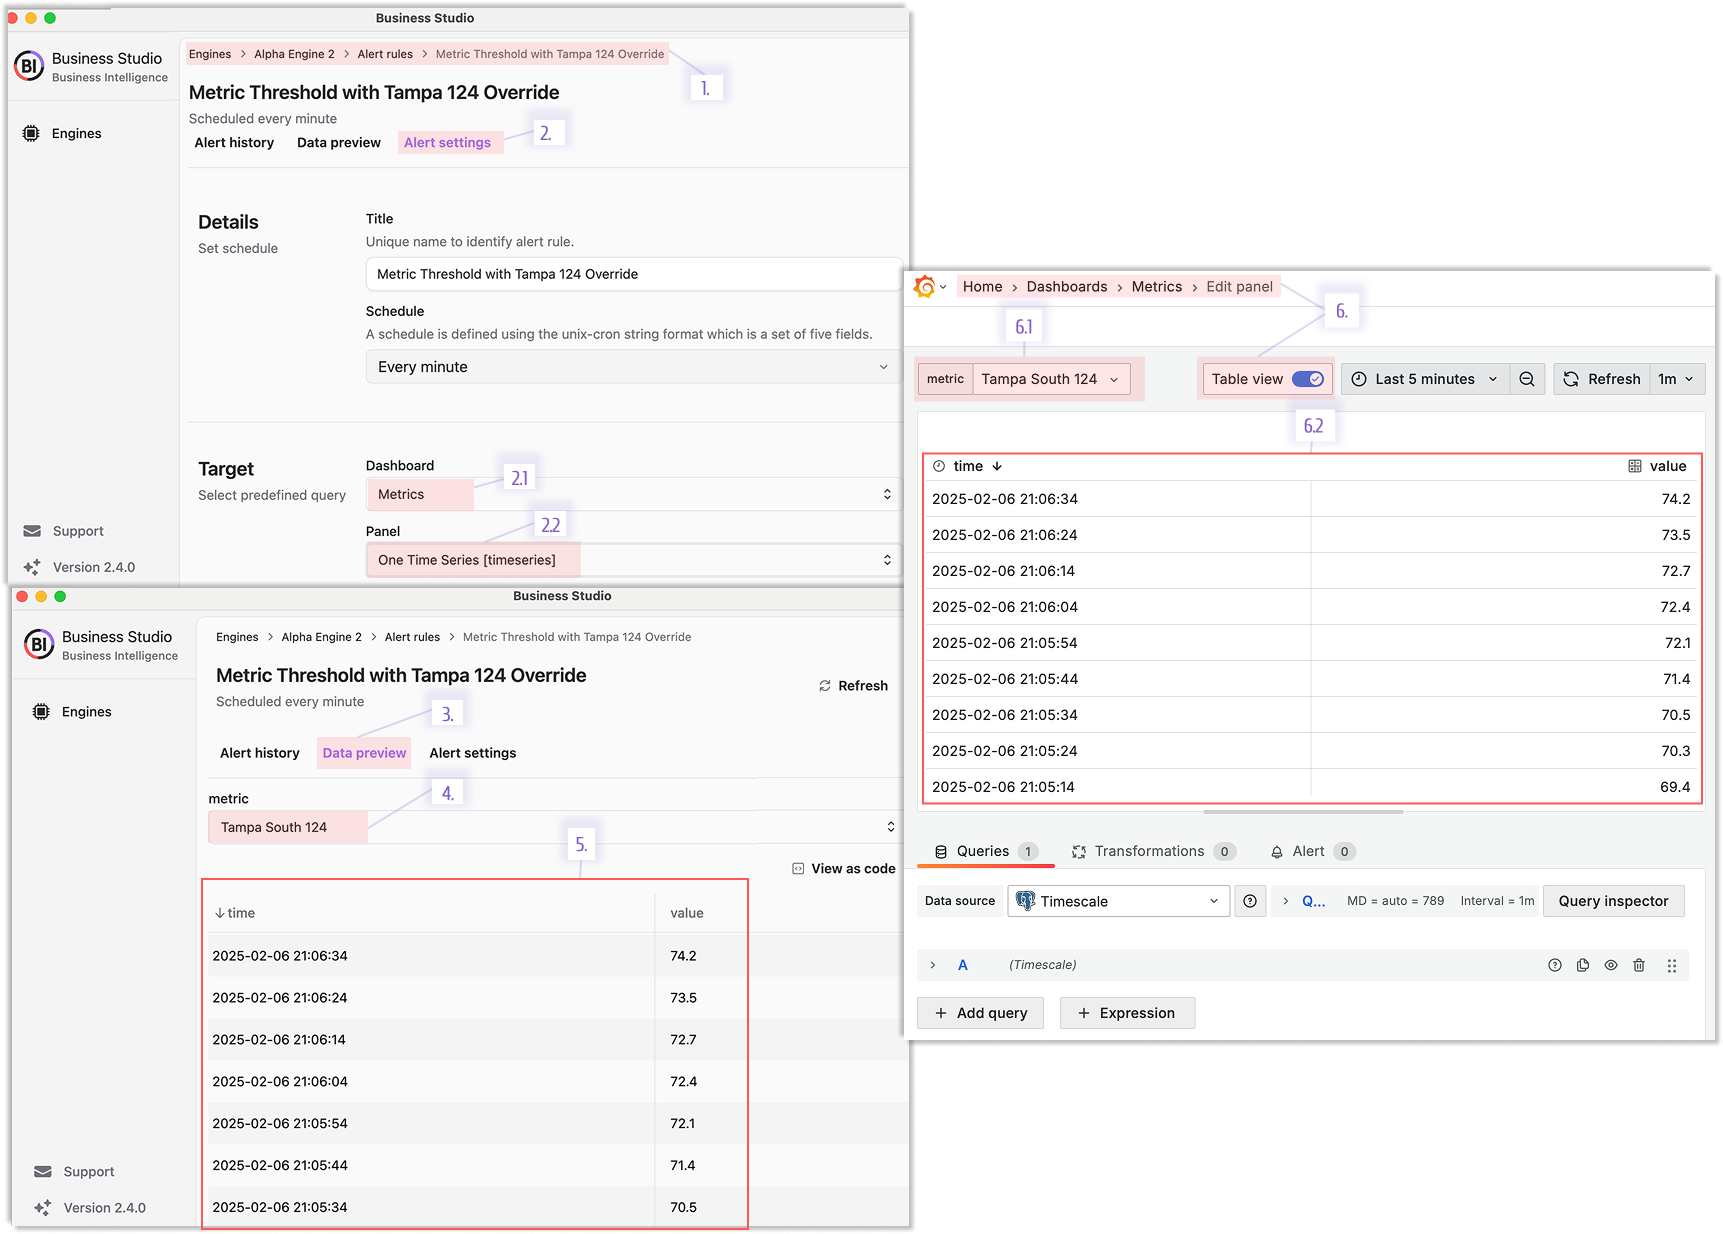
A Grafana data frame can be reviewed as a code by clicking on the View as code button.
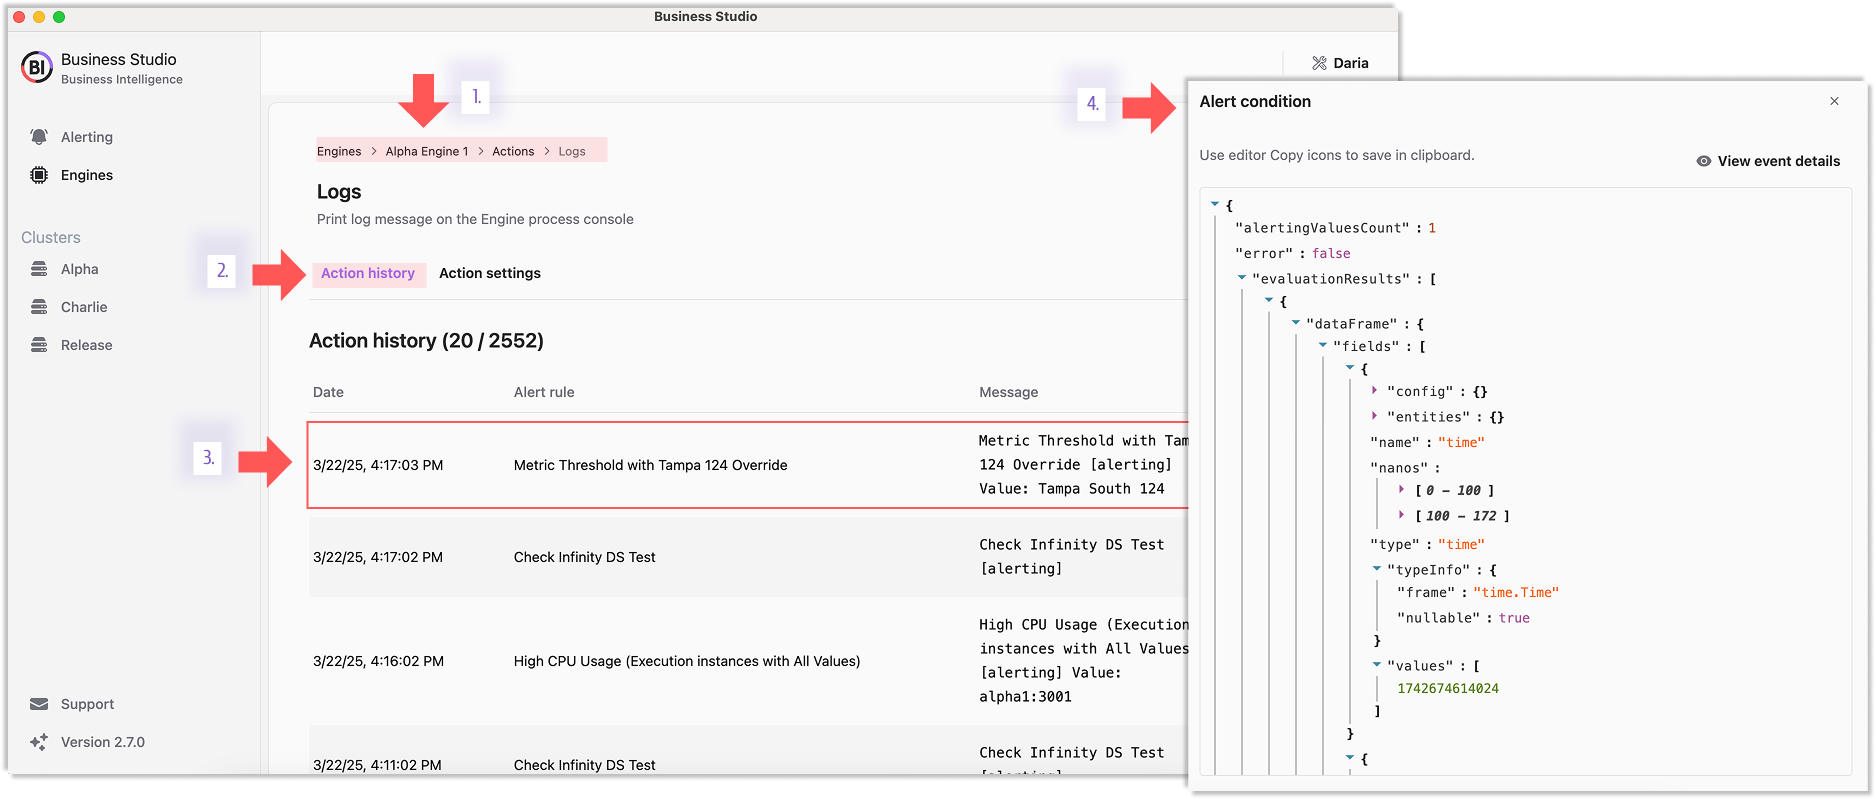
Peek Inside Alerts with Condition Drawers
Curious why an alert fired? Click any action event to open a drawer showing alert conditions as they were—no digging required. Here’s how:
- Open action details.
- Go to the Action History tab.
- Click an event to reveal its conditions.
