Alert rules
Use the Alert rules page to manage alert rules. Here you can:
- Add a new alert rule.
- Review the alert rule running states for each existing alert rule.
- Review the alert rule alerting state for each existing alert rule.
- Pause/Start the alert rule.
- Delete the alert rule.
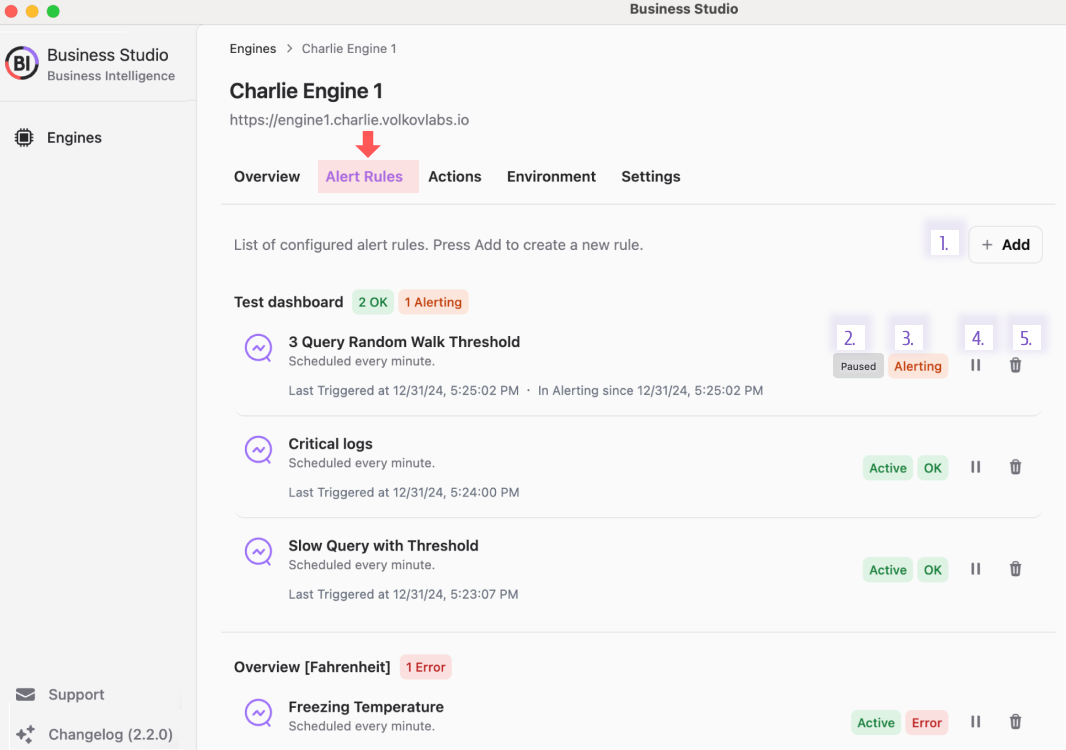
Alert rules states
To temporate pause alert execution, click on the Pause icon for the specific alert rule. Alert can be started anytime to resume execution.
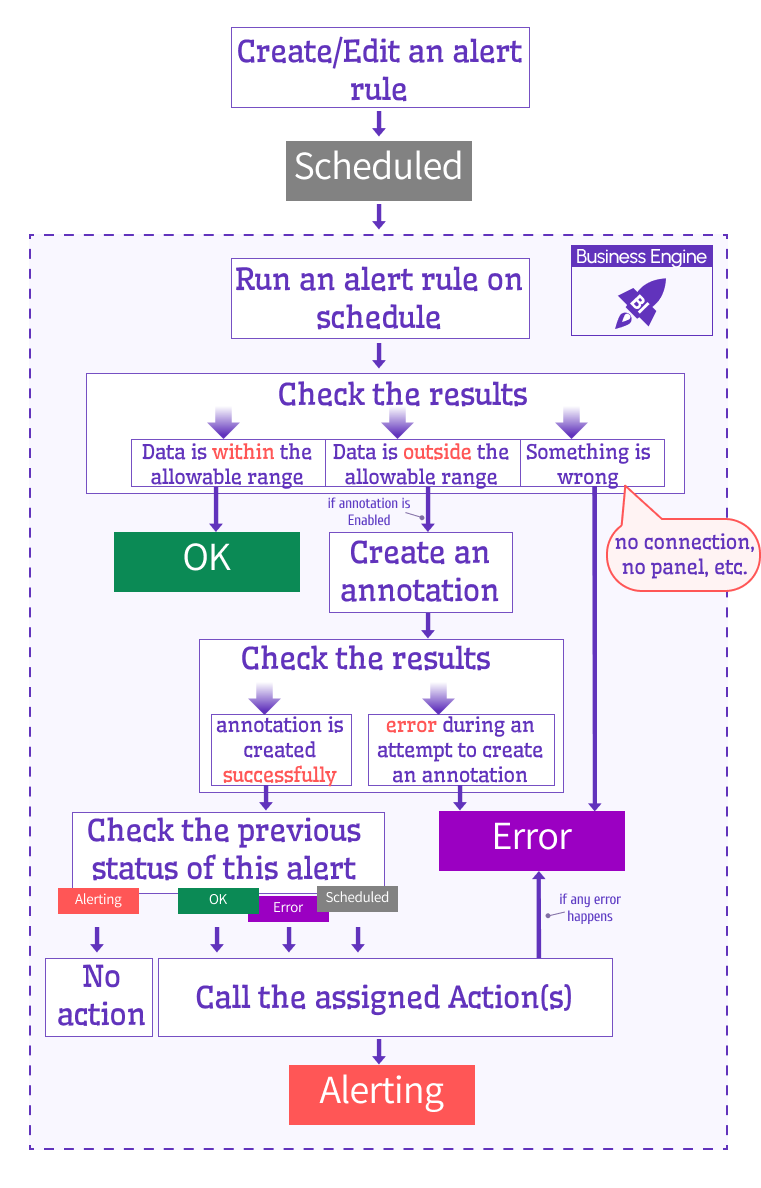
Alert rules statuses
Right after an alert is created it becomes Active and Scheduled. After modification, the alert status changes to Scheduled if it requires reexecution with a new set of parameters.
- Scheduled. The alert is scheduled but has never run with a current set of parameters. This status is assigned right after the user and API create or modify the alert.
- OK. The alert has been run, the thresholds are NOT breached, and the Regex pattern is NOT found.
- Alerting. The alert has been run, the thresholds are breached, or the Regex pattern is found.
- Error. Something is wrong, such as the query, annotation, or action.
Flow schema
Reference the flow schema to get a better understanding of how statuses change in the Business Engine.
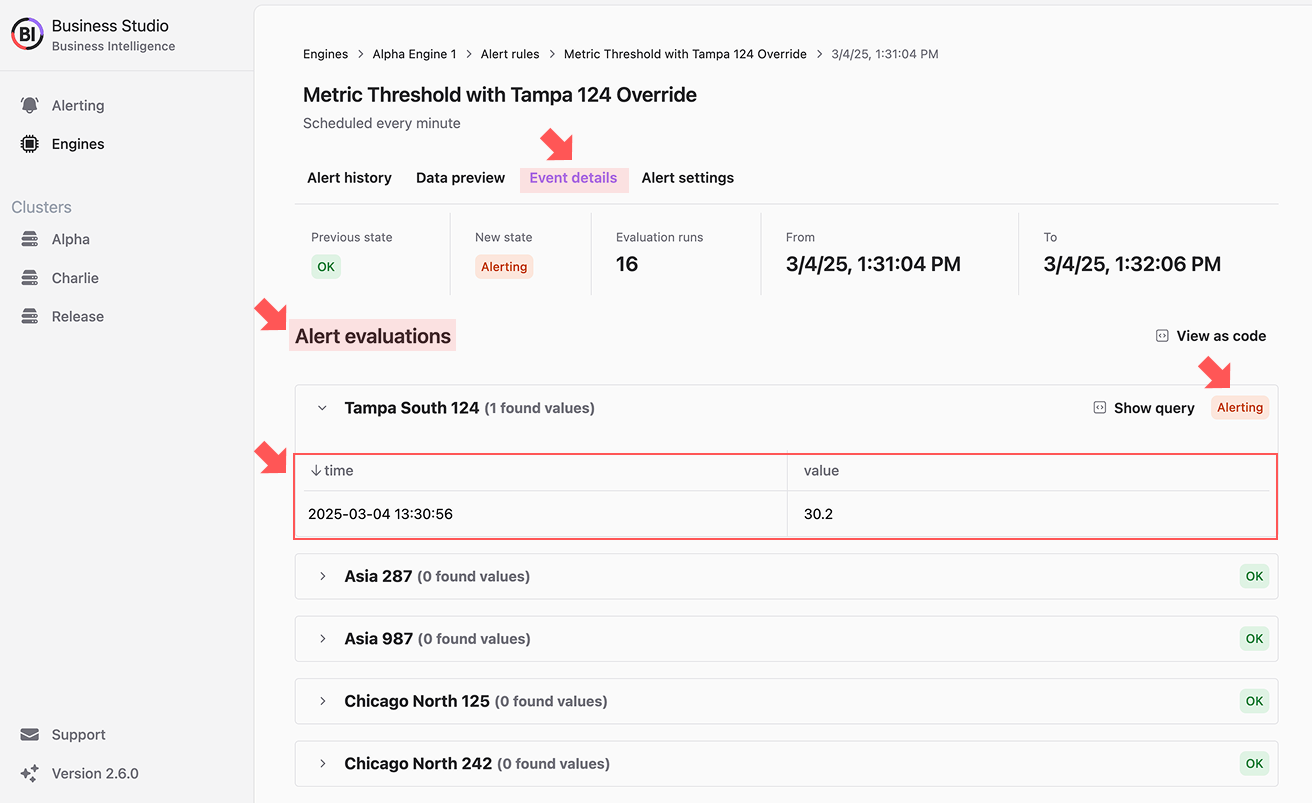
Event Details
For alerts in the Alerting state, the Event Details page displays data frame column headers. It makes it easier to interpret alert data at a glance, enhancing troubleshooting and decision-making.
Add a new rule
The Add a new rule window looks as follows:
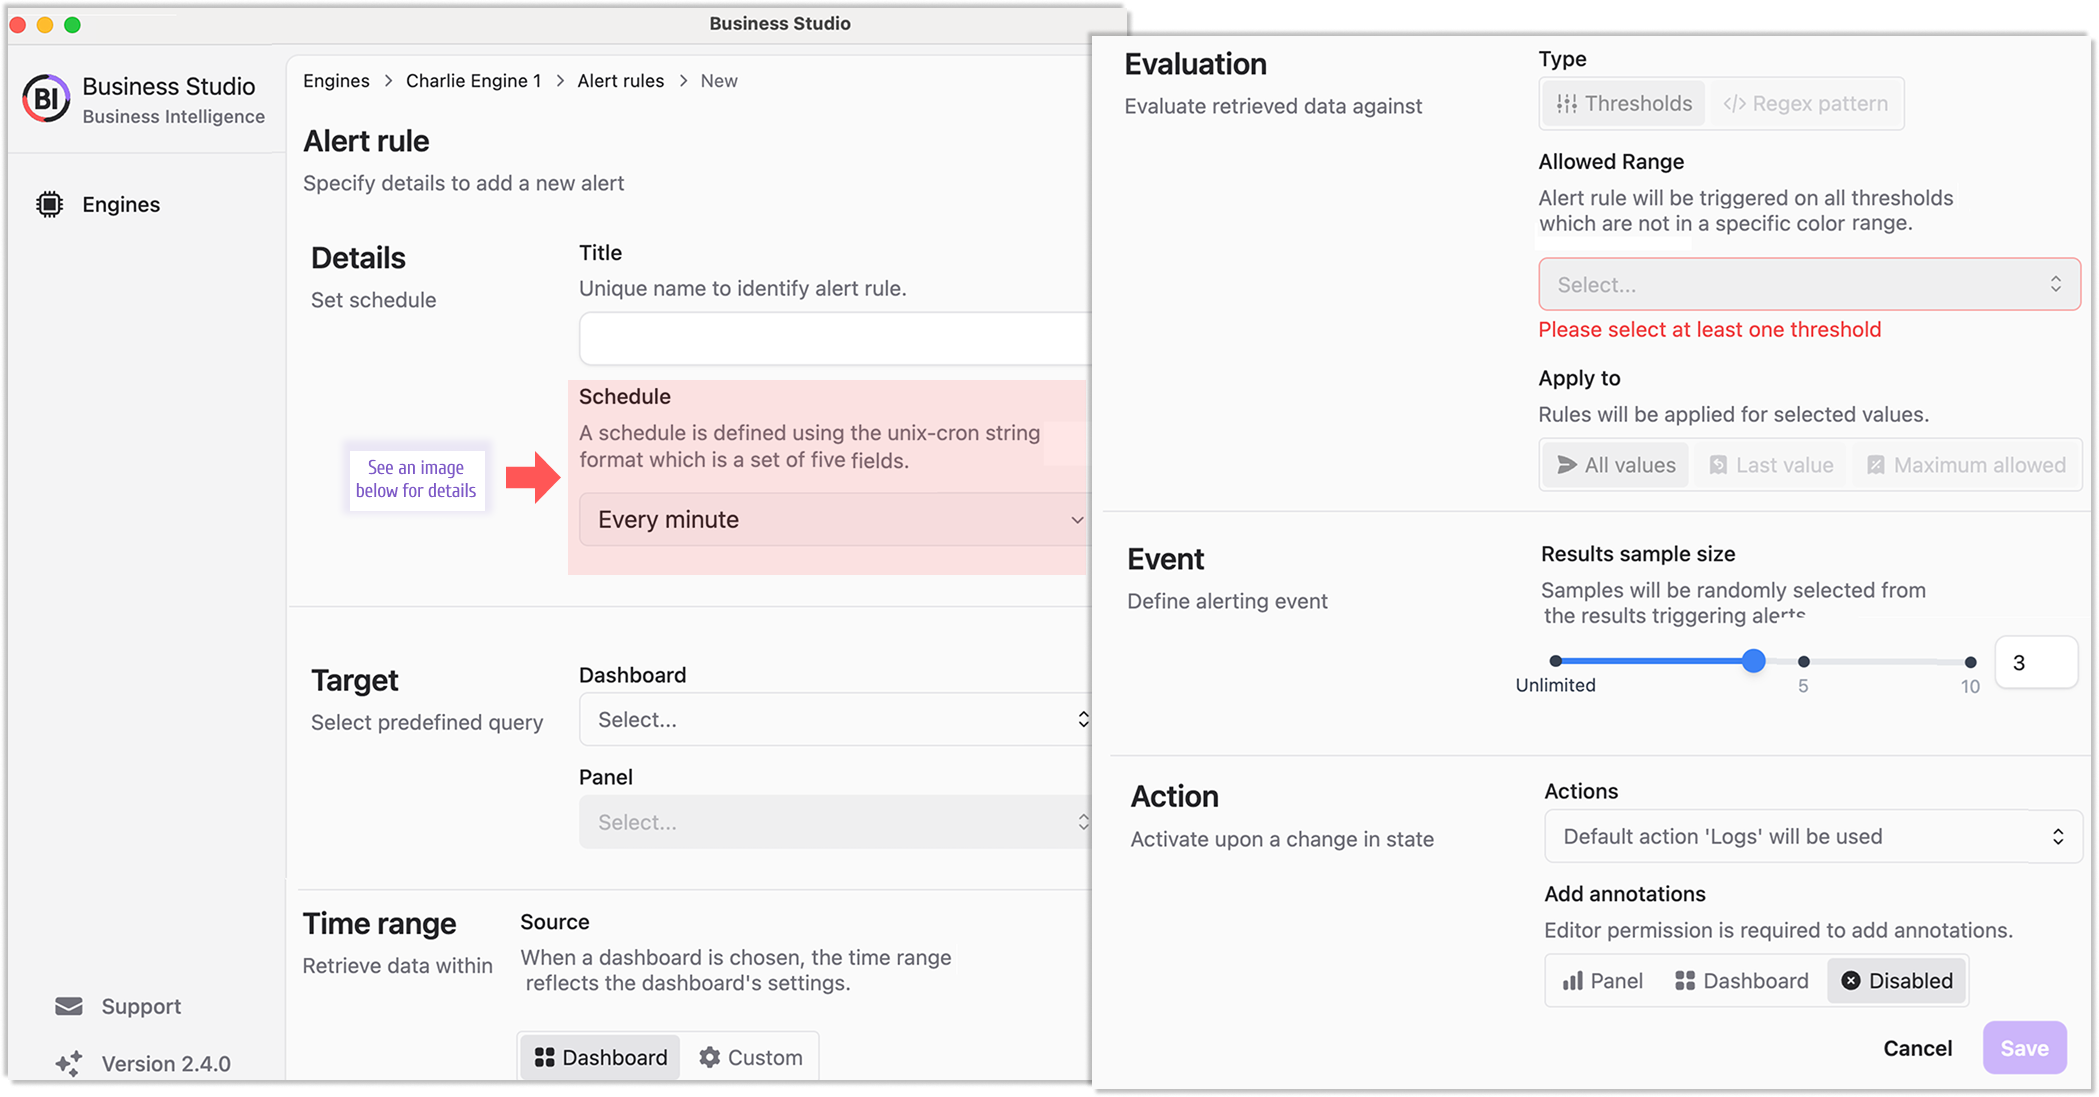
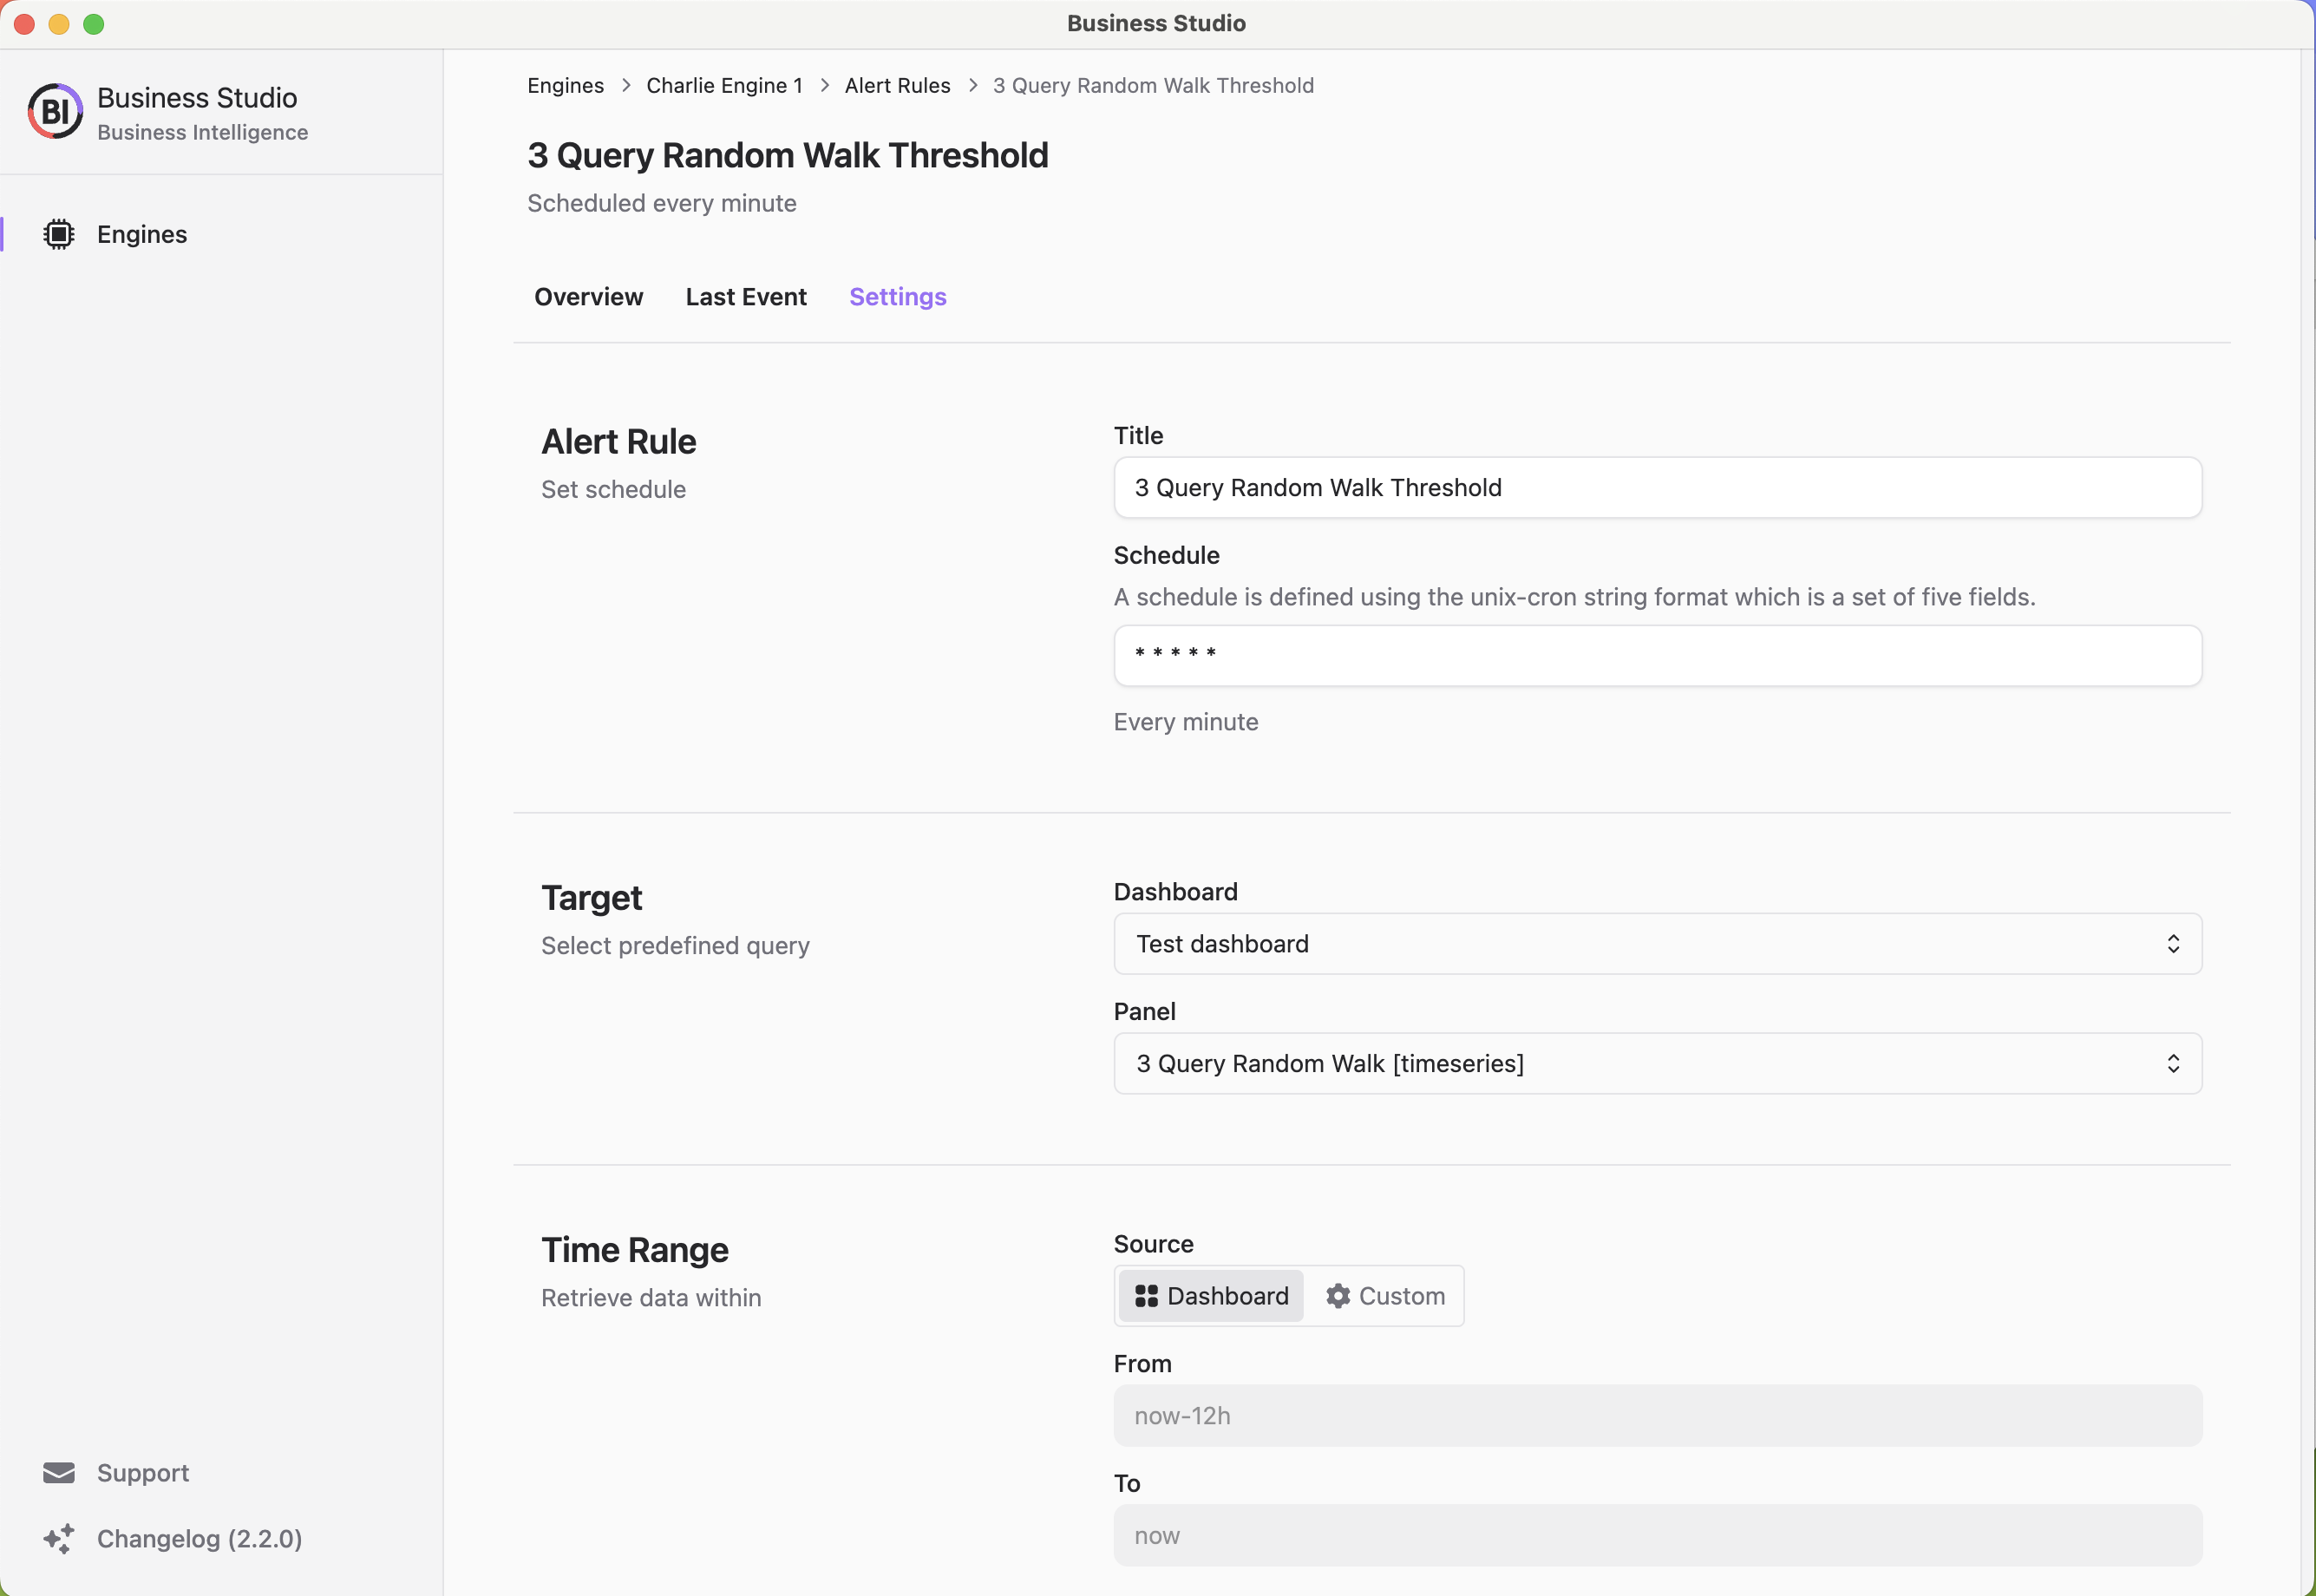
The new alert rule/edit window has the following configuration elements to specify:
- Details
- Title is an alert name.
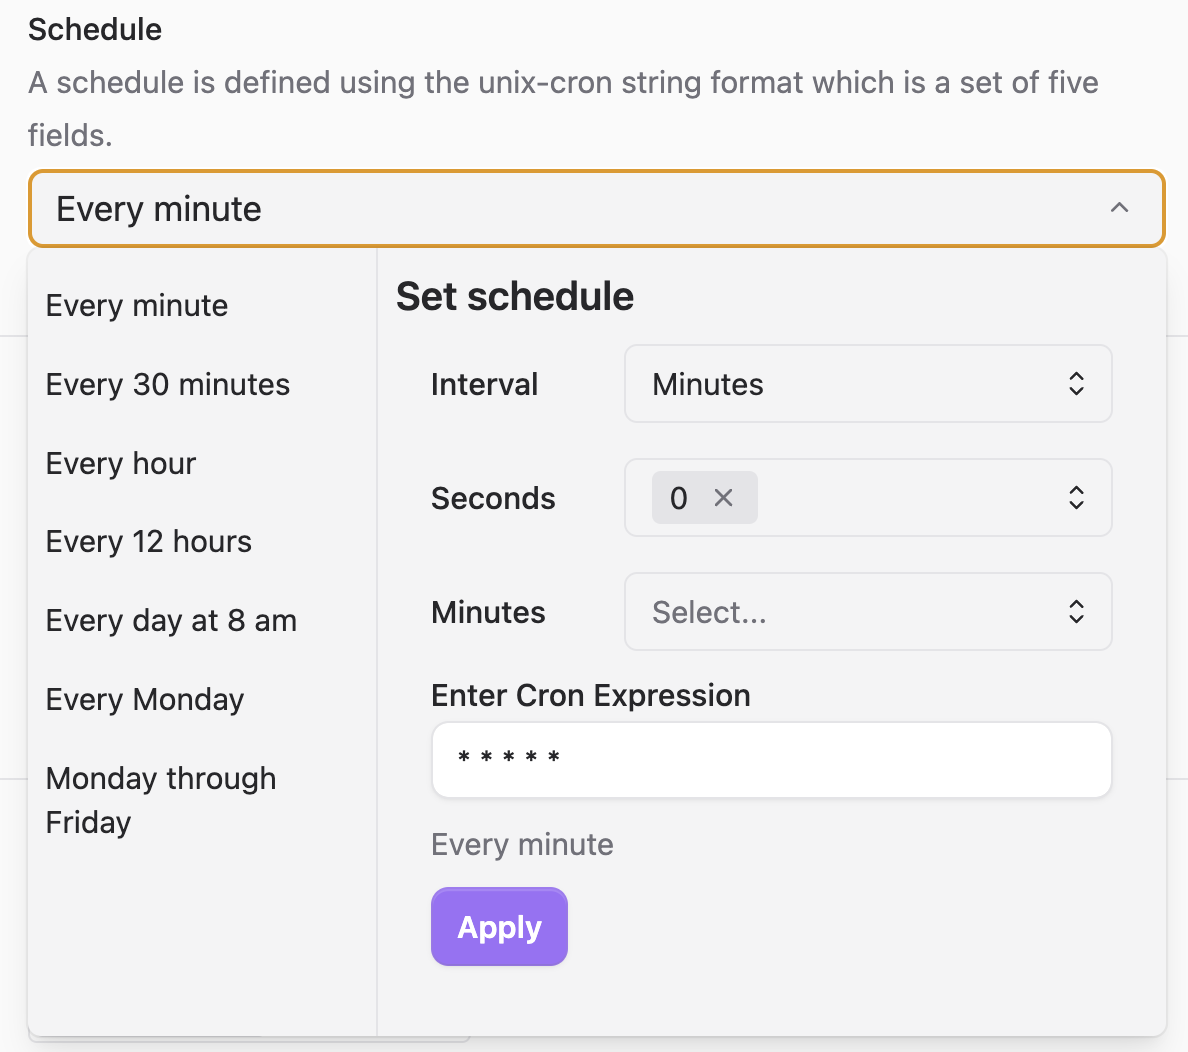
- Schedule is a frequency of how often the rule should run. Here, you can select from the ready-to-use templates and adjust if needed. Alternatively, use a Cron expression to make your schedule as complex as needed.
- Target
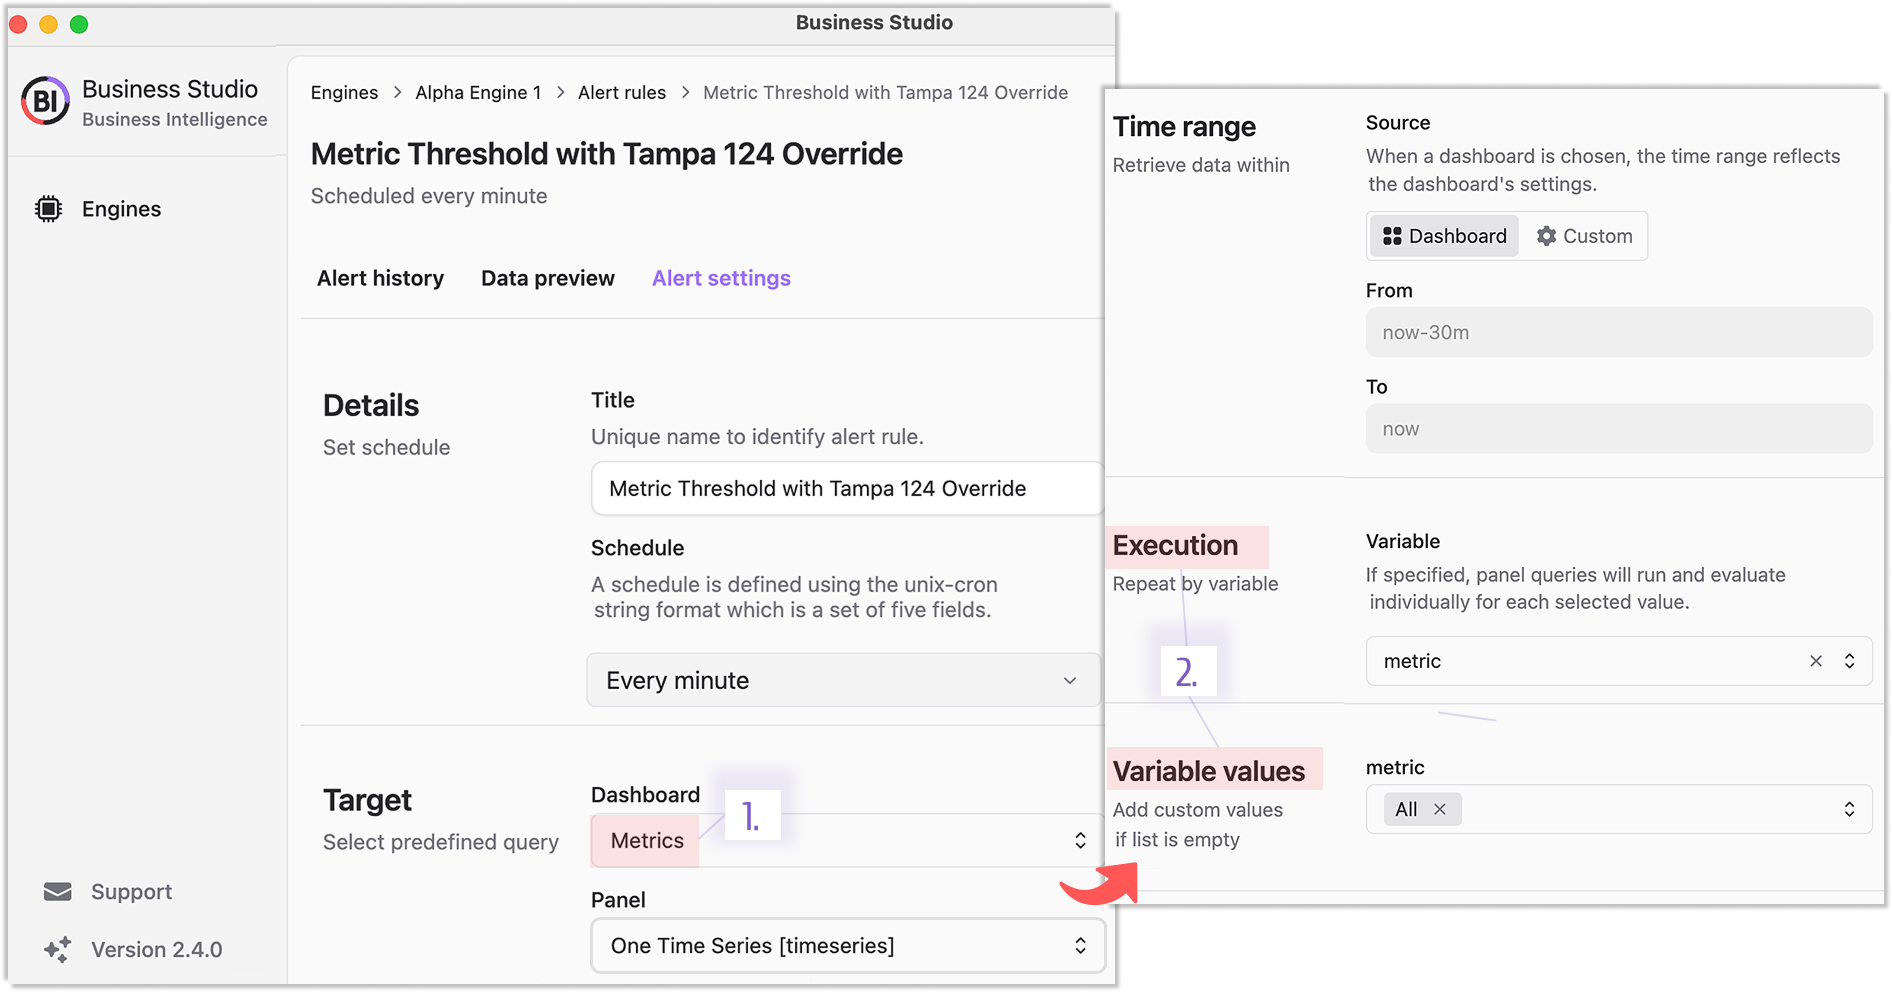
- Dashboard is a drop-down populated from the connected Grafana dashboard listing.
- Panel is a drop-down populated from the selected dashboard. The alert rule will take queries and thresholds from there automatically.
- Time Range
- Source could be either from the specified Dashboard or Custom.
- Evaluation. It could be set to:
- Thresholds. The alert examines the data against thresholds set in the panel options.
- Regex Pattern. The alert examines the specified fields (optional) and searches the specified pattern.
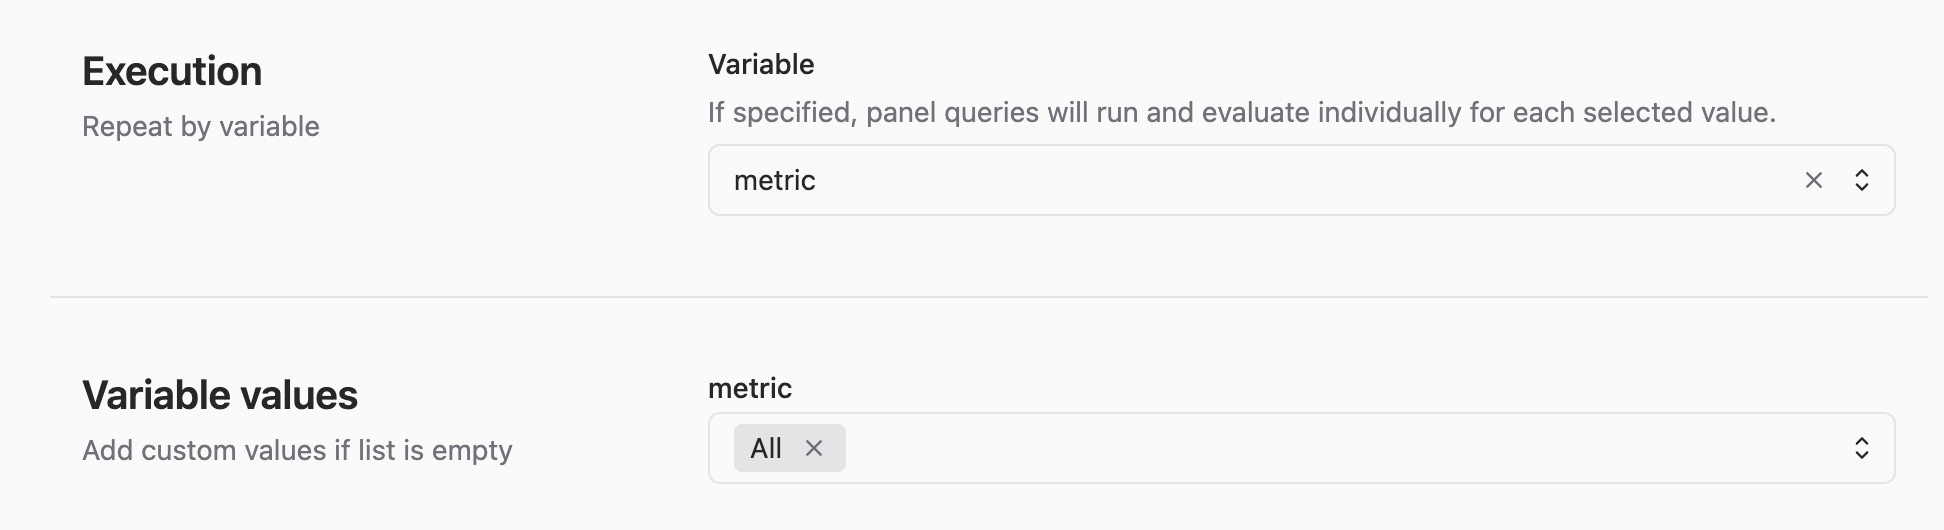
- Execution. This section appears if the selected dashboard has configured Grafana dashboard variables. You can specify a variable name to be taken into account with each query.
- Variable values. This section appears at the same time as the Execution. Here, you can specify the exact dashboard variable values for the query. This parameter is useful when you do not want to use all variable values.
- Event. This section appears when the Evaluation->Apply to is set to All values or Maximum Allowed.
- Result sample size. It lets you specify how many rows in an alert result should be randomly picked up for saving and your analysis.
- Action
- Actions. Select from the drop-down list of the existing, pre-configured action APIs.
- Add Annotation:
- Panel to create and attach an annotation to a panel.
- Dashboard to create and attach an annotation to a dashboard (i.e., all panels of this dashboard).
- Disabled to disable the creation of any annotation following the triggered alert rule.
Schedule
Select from the templates and adjust if needed, or specify a CRON expression to make your schedule as complex as required.
Grafana dashboard variables
The Business Studio alert rules can incorporate Grafana dashboard variables and be specific for certain conditions.
For instance, you can create the same alert rule for all your devices but make it distinctive for the actual threshold values.
Below is the general description of such a configuration. You can find the detailed data sources examples in dedicated parts of this documentation.
When in the Target->Dashboard parameter, you specify a dashboard containing dashboard variables, two more sections appear:
- Execution. Here, you can specify a dashboard variable to use in each alert rule query.
- Variable values. Here, you can specify the subset of dashboard variable values that should be used in the alert rule execution.
When a dashboard variable is specified in the Execution->Variable parameter, the Overrides section appears. Here, you can identify specific thresholds for each dashboard variable value individually.
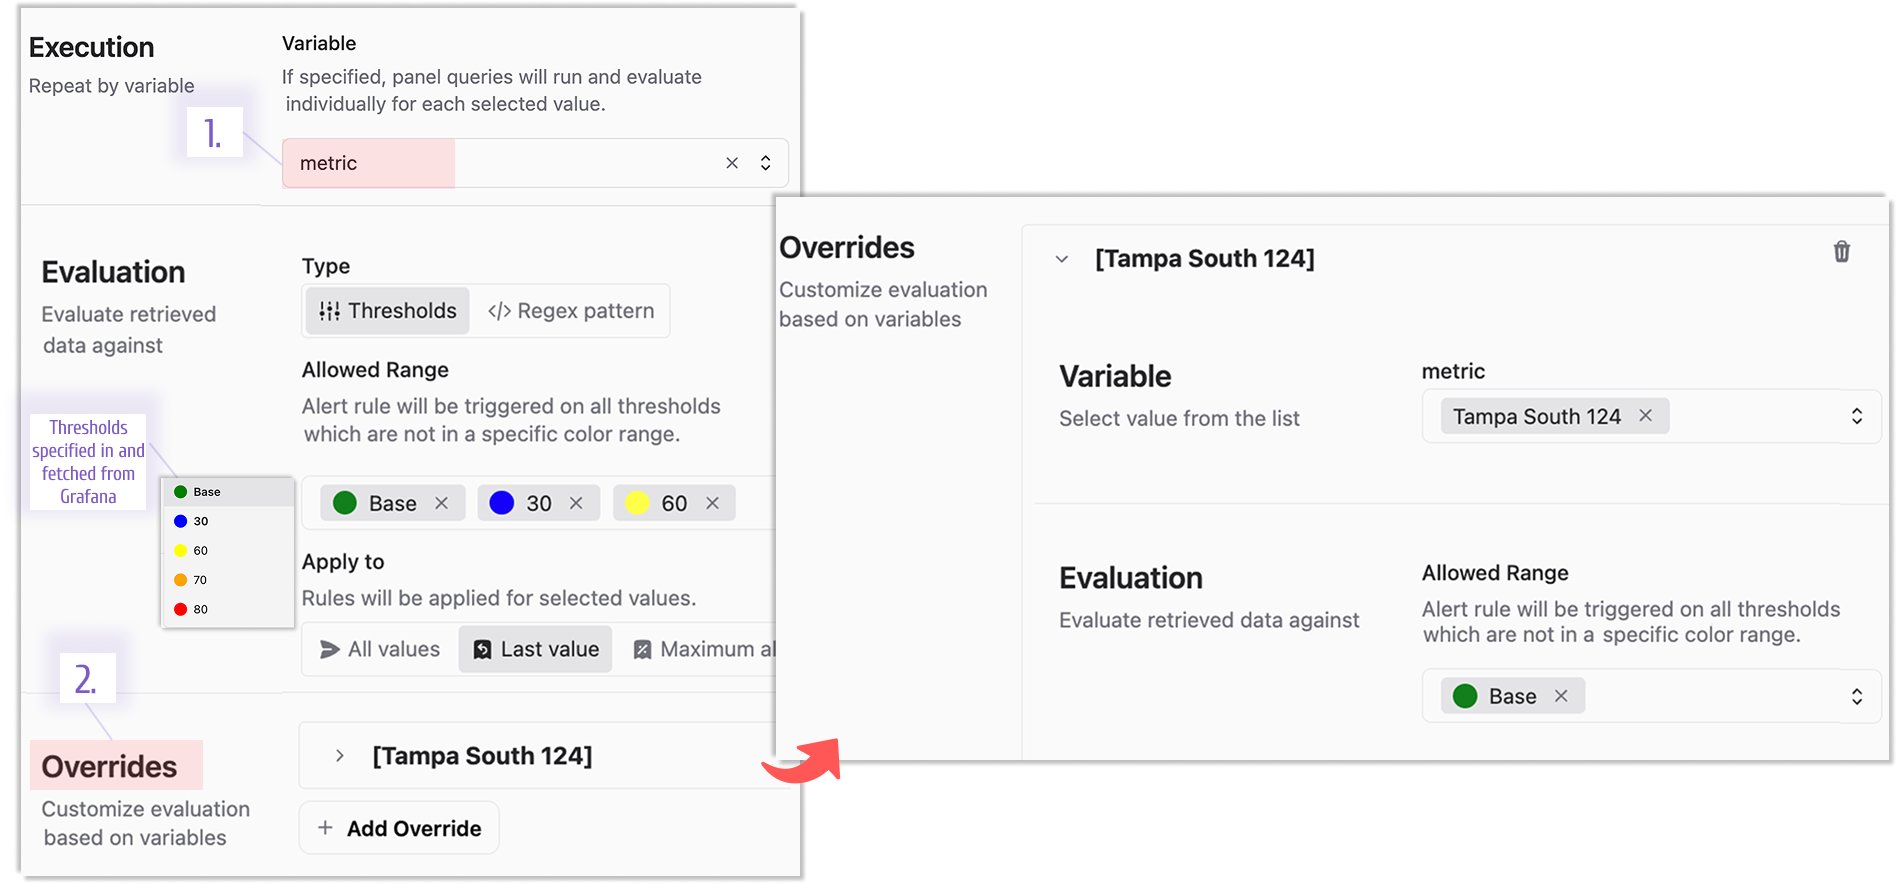
In the described example, the alert rules should be triggered when the observable data is above 70. (values in the ranges from below 30, above 30, above 60, and below 70 are allowed).
For only one device with the name Tampa South 124, the allowed range is below 30. Any value above 30 triggers the alert rule.
Multi-frames
The Business Engine supports multi-frame data sets. That means that the alert rule assigned to a dashboard and panel will be applied to all data frames fetched from the connected data source.
Transformations
Business Intelligence aligns with Grafana transformations, ensuring broad compatibility.
Most core Grafana transformations—built on a general framework—work seamlessly. However, some niche transformations, tailored to specific data sources or scenarios, may deviate from this standard and could encounter issues.
Rare, source-specific transformations might not fully align. If you hit a snag, reach out—we’ll resolve it together!