Monitoring Business Engine with Prometheus
Effective monitoring is critical for maintaining the performance and reliability of any business intelligence platform. The Business Engine integrates seamlessly with Prometheus to provide out-of-the-box metrics for monitoring system health, latency, and resource usage. Paired with a pre-configured Grafana dashboard, these metrics enable teams to quickly identify and resolve issues, ensuring optimal performance of the Business Engine.
In this guide, we'll explore the Prometheus metrics exposed by the Business Engine, how to configure metric collection, and how to leverage the provided Grafana dashboard for actionable insights.
Metrics Endpoint
The Business Engine exposes Prometheus metrics for all microservices via the Service API at engine:3001/metrics. This endpoint provides a comprehensive set of metrics to monitor alert execution, HTTP request performance, and system health.
Exposing the /metrics endpoint to the public internet can pose a security risk, as it may reveal sensitive information about the Business Engine's performance and internal operations. To prevent unauthorized access, you can configure a reverse proxy like NGINX to restrict access to the metrics endpoint based on IP addresses, authentication, or other criteria.
Below is an example of how to configure NGINX to block access to the /metrics endpoint from external networks while allowing access from specific internal IP ranges.
NGINX Configuration
This configuration assumes that the Business Engine's Service API is running behind an NGINX reverse proxy.
server {
    listen 80;
    server_name engine.business.io;

    location / {
        proxy_pass http://engine:3001;
        proxy_set_header Host $host;
        proxy_set_header X-Real-IP $remote_addr;
        proxy_set_header X-Forwarded-For $proxy_add_x_forwarded_for;
        proxy_set_header X-Forwarded-Proto $scheme;
    }

    # Deny access from external networks
    location /metrics {
        # Allow access from specific IP addresses or ranges (e.g., internal network or monitoring tool)
        allow 127.0.0.1;       # Example: Localhost
        deny all;              # Deny all other access
    }
}
Available Metrics
The following table lists the key Prometheus metrics provided by the Business Engine, categorized into alert execution, alert calculation, and HTTP request performance:
| Metric | Type | Description |
|---|---|---|
alert_calculation_duration_seconds | Histogram | Duration of alert calculation in seconds |
alert_count_in_the_execution_queue | Gauge | Number of alerts in the execution queue |
alert_create_annotations_duration_seconds | Histogram | Duration of alert annotation creation in seconds |
alert_execution_duration_seconds | Histogram | Duration of alert execution in seconds |
grafana_http_request_duration_seconds | Histogram | Duration of HTTP requests to Grafana in seconds |
http_all_client_error_total | Counter | Total count of client-side errors |
http_all_errors_total | Counter | Total count of error requests |
http_all_request_total | Counter | Total count of all received requests |
http_all_server_error_total | Counter | Total count of server-side errors |
http_all_success_total | Counter | Total count of successful requests |
http_request_duration_seconds | Histogram | Duration of HTTP requests in seconds |
http_request_size_bytes | Histogram | Size of HTTP requests in bytes |
http_request_total | Counter | Total count of HTTP requests |
http_response_size_bytes | Histogram | Size of HTTP responses in bytes |
internal_request_duration_seconds | Histogram | Duration of internal requests in seconds |
internal_request_total | Counter | Total count of internal requests |
These metrics provide deep visibility into the performance and behavior of the Business Engine, enabling teams to detect bottlenecks, high latency, or resource constraints.
Configuration
To start collecting metrics from Business Engine microservices, configure Prometheus using the sample configuration file below. This setup ensures that metrics are scraped from the designated endpoint.
global:
  scrape_interval: 15s

scrape_configs:
  - job_name: "business-engine"
    static_configs:
      - targets: ["business-engine:3001"]
Grafana Dashboard for Business Engine
The Business Engine Dashboard is a pre-built Grafana dashboard designed to visualize the collected Prometheus metrics. It includes filters for instance, app, and alert rule variables, allowing you to drill down into specific components or issues.
You can download the dashboard JSON file and configuration directly from the Business Intelligence repository.
Dashboard Sections
The dashboard is organized into several sections for comprehensive monitoring:
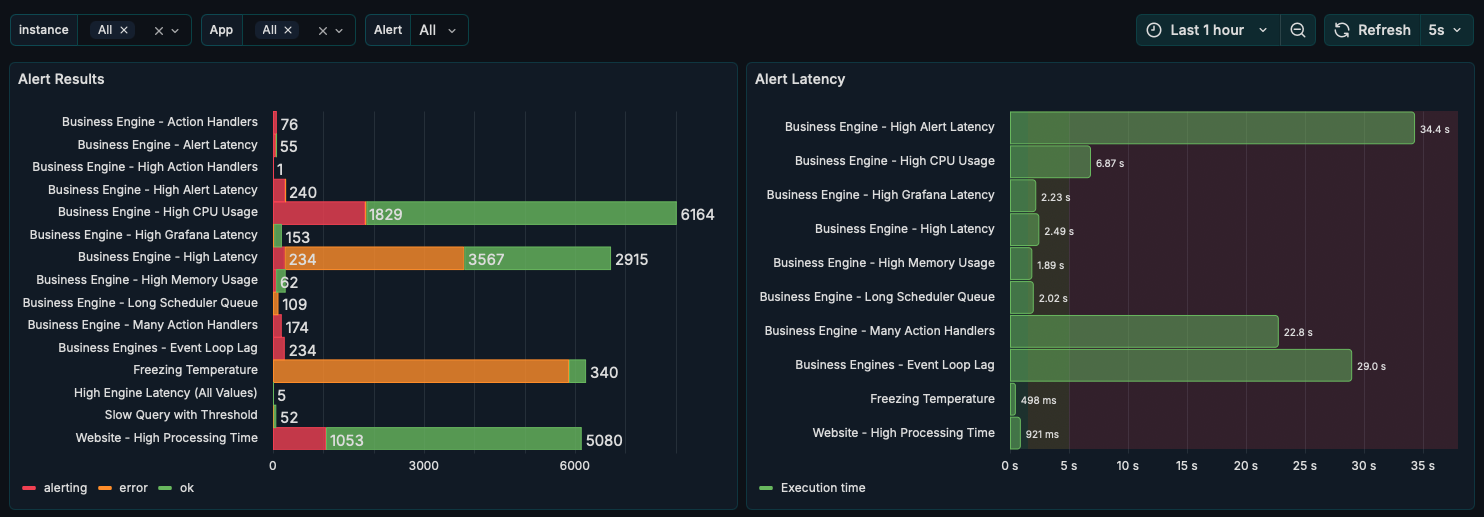
1. Alerts
- Alert Results: Overview of alert outcomes and statuses.
- Alert Latency: Metrics on alert calculation and execution durations.
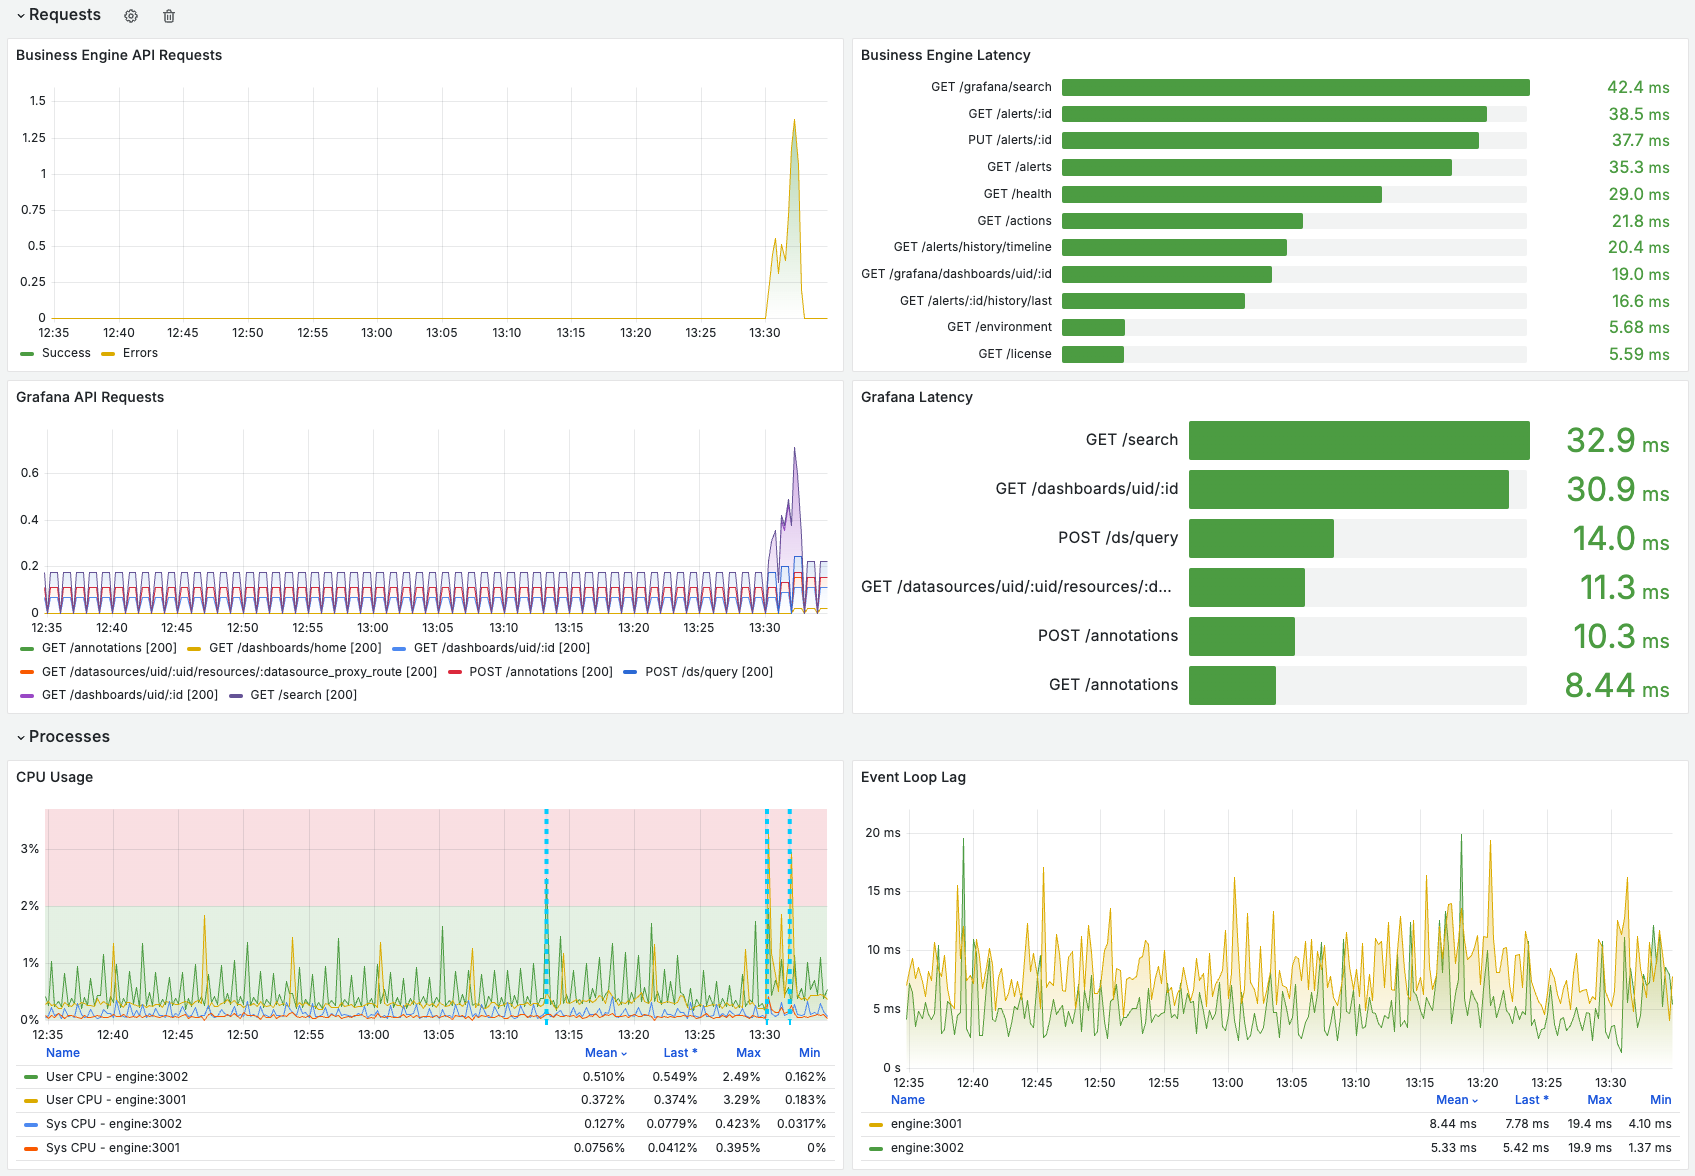
2. Requests
- Business Engine API Requests: Total requests and error rates.
- Business Engine Latency: Request and response durations.
- Grafana API Requests: Metrics for Grafana API interactions.
- Grafana Latency: Latency of Grafana API calls.
- Scheduler Queue: Alerts queued for execution.
- Internal Requests: Performance of internal communications.
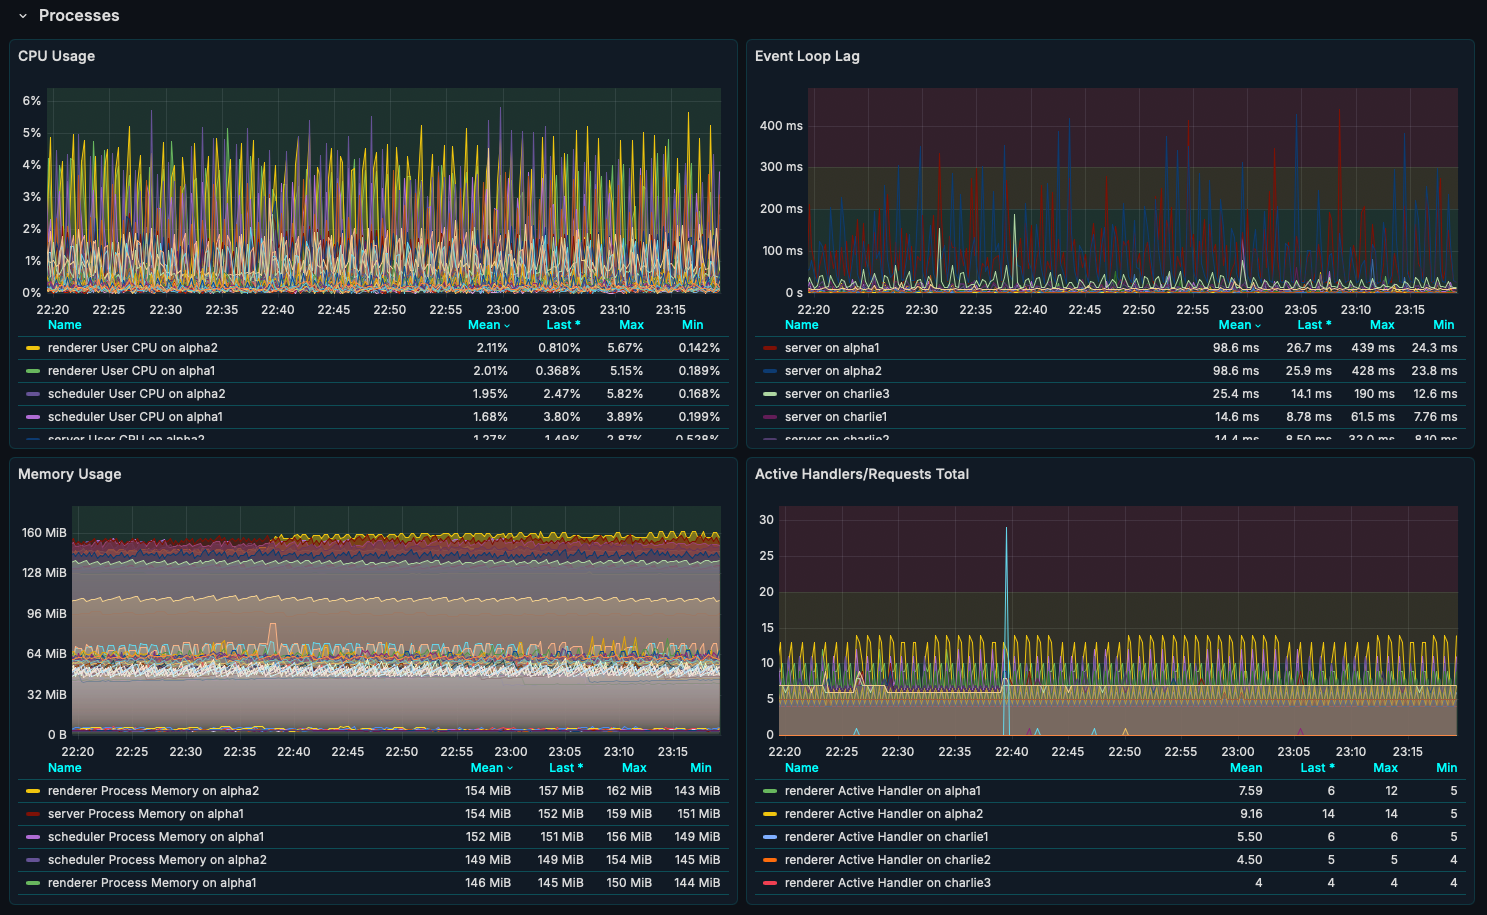
3. Processes
- CPU Usage: CPU consumption by Business Engine processes.
- Event Loop Lag: Delays in the event loop affecting performance.
- Memory Usage: Memory consumption trends.
- Active Handlers/Requests Total: Count of active handlers and requests.
Why Monitor with Prometheus?
The Business Engine's Prometheus metrics offer detailed insights into system performance, enabling proactive monitoring and troubleshooting. By tracking alert execution times, HTTP request latencies, and resource usage, teams can:
- Identify and resolve high-latency issues before they impact users.
- Optimize resource allocation based on CPU and memory usage trends.
- Detect and address errors in API requests or internal communications.
Use the provided Grafana dashboard as a starting point, and customize queries or visualizations to meet your specific monitoring needs.
Get Started
- Configure Prometheus to scrape metrics from the Business Engine endpoint (
engine:3001/metrics) using the sample configuration. - Import the Business Engine Dashboard into your Grafana instance.
- Explore the metrics and set up alerts for critical thresholds (e.g., high latency or error rates).
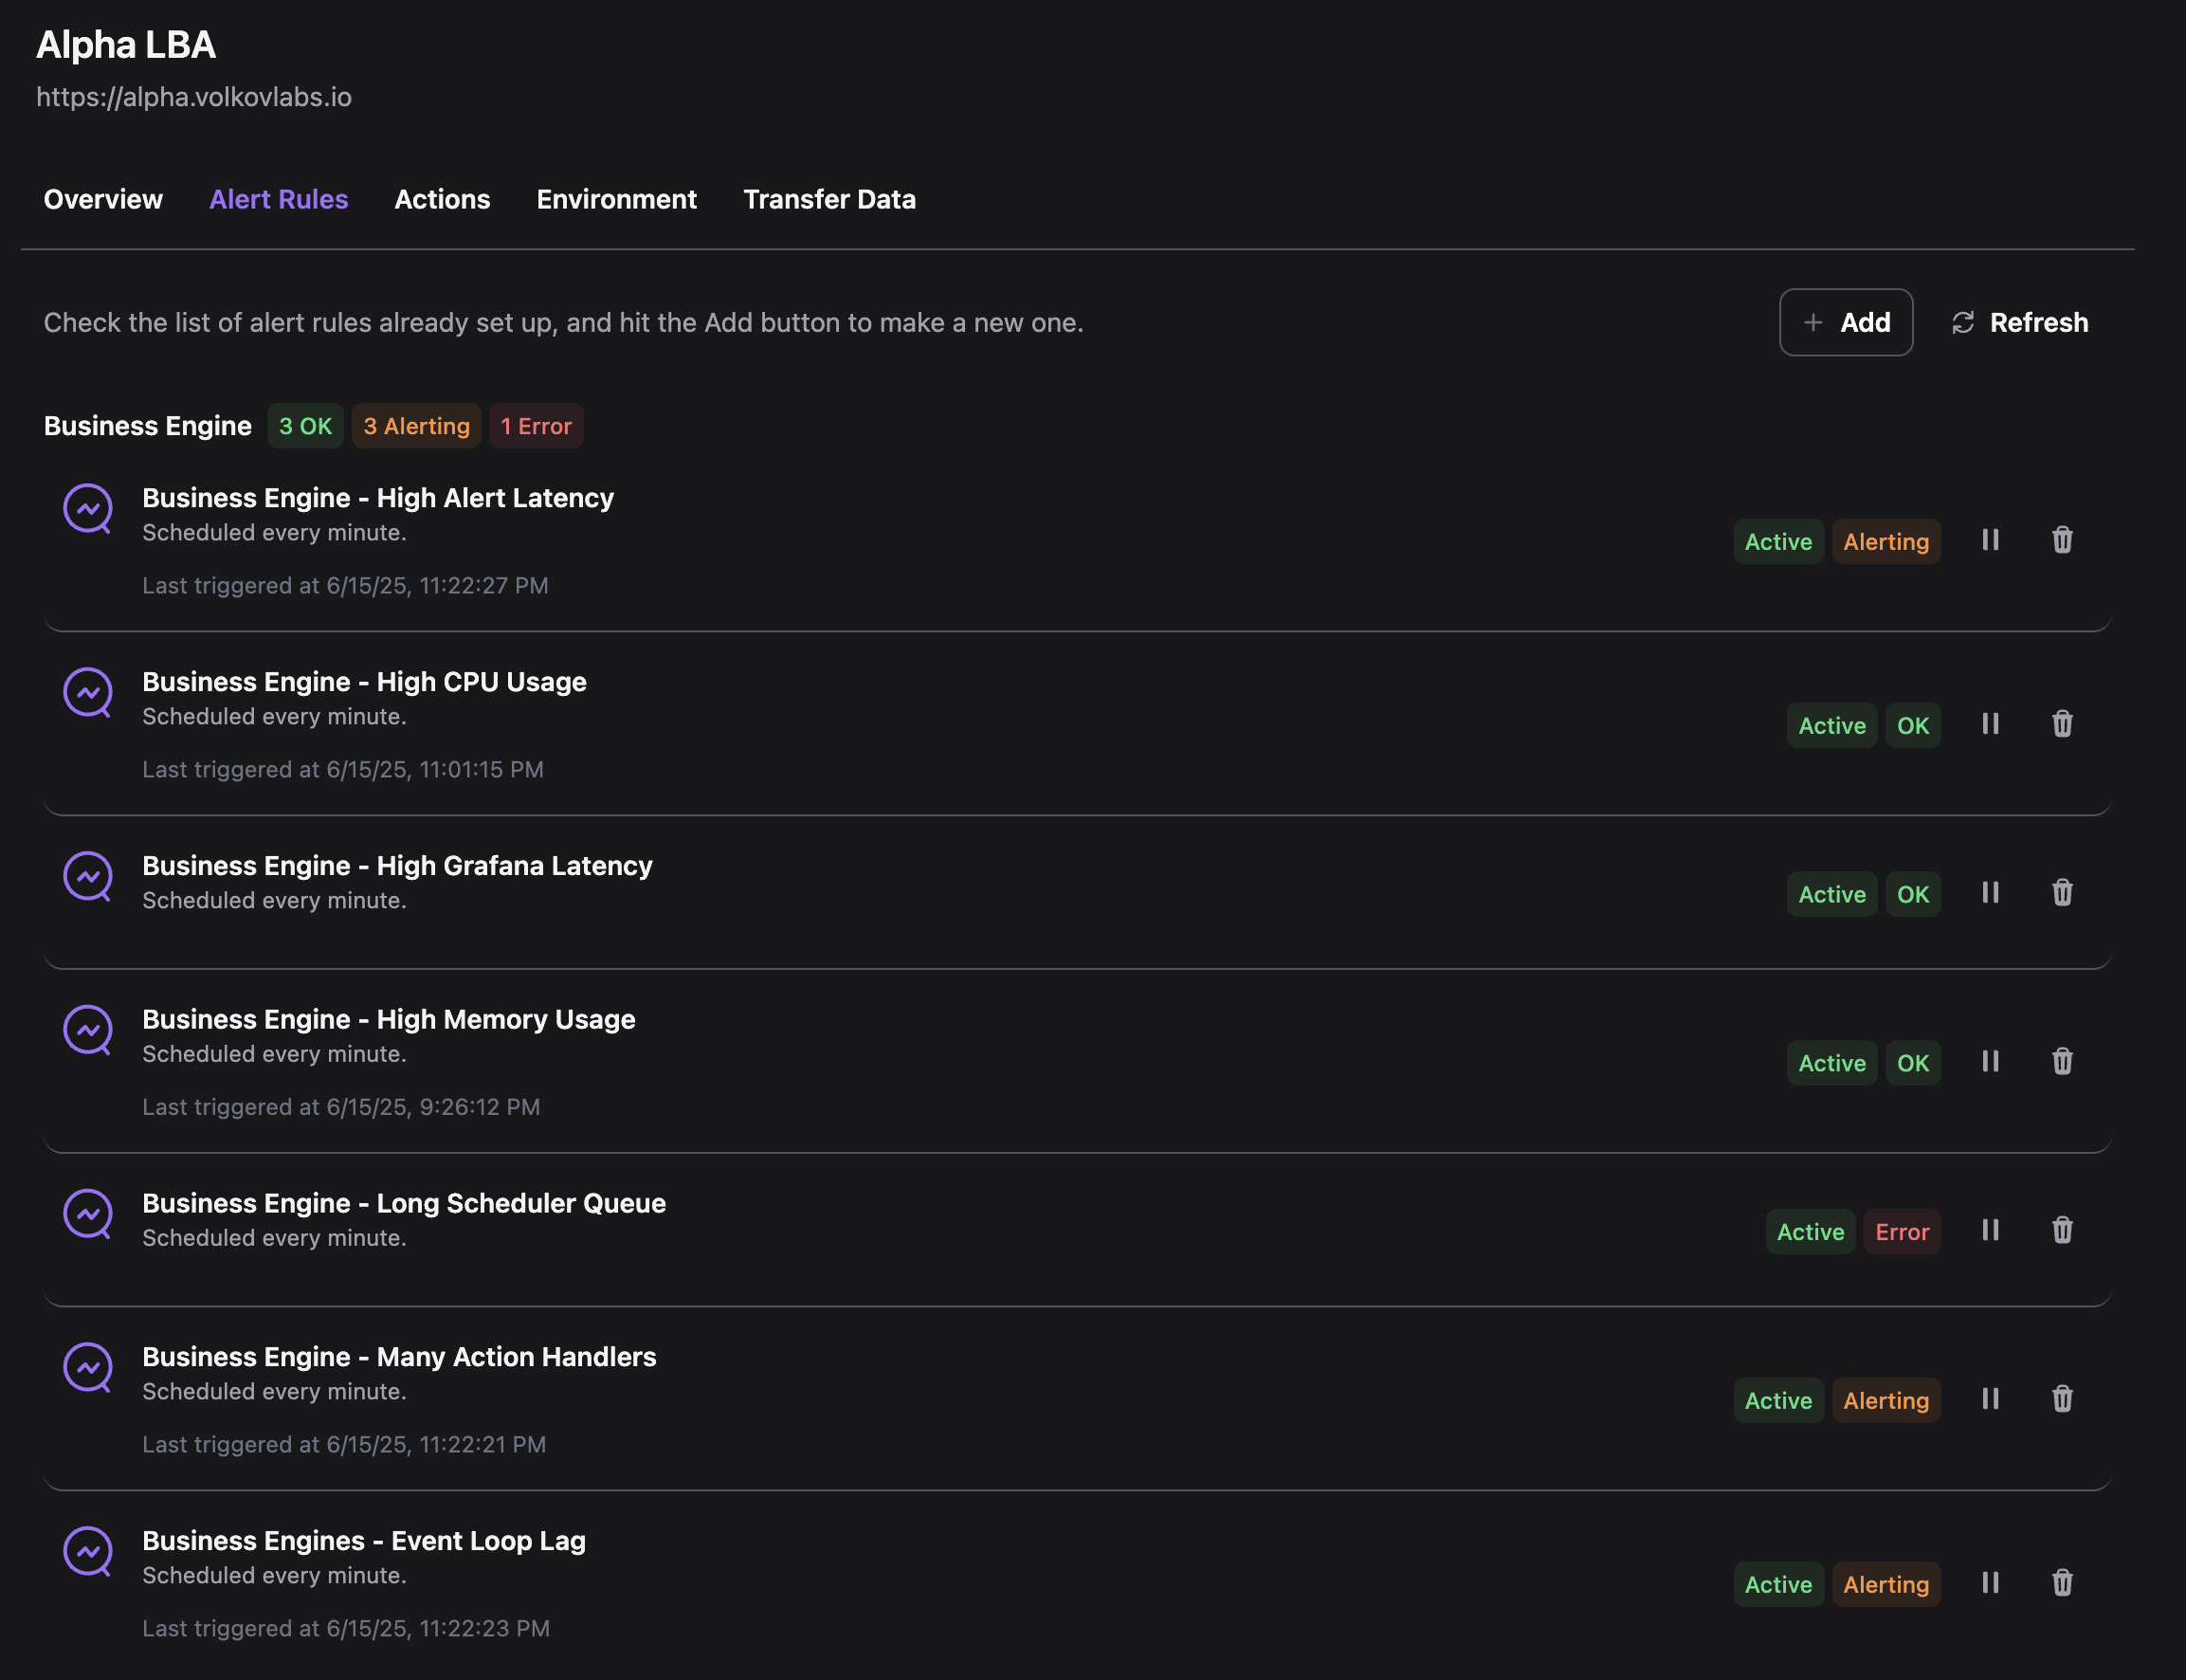
Alert Rules
To quickly set up predefined alert rules in Business Studio for monitoring the Business Engine, you can import a ready-to-use configuration file:
- Download the alert rules JSON file from Business Intelligence repository.
- Use Business Studio connected to Business Engines to transfer and apply these alert rules.
Benefits of This Setup
With Prometheus scraping metrics, Grafana dashboards for visualization, and alert rules in place, you’ll have a comprehensive monitoring system to:
- Detect performance bottlenecks or failures in real-time.
- Ensure the Business Engine operates at peak efficiency.
- Respond proactively to issues before they impact users.
Next Steps
- Regularly review and adjust alert thresholds based on evolving performance trends.
- Expand monitoring by adding custom metrics or integrating additional tools as needed.
- Explore advanced alerting strategies, such as anomaly detection, for more predictive insights.