Quick Start Guide
This Quick Start Guide offers a streamlined, step-by-step process to deploy the Business Intelligence platform using an existing Grafana stack and production data.
Whether you're using Grafana Cloud, OSS, or Enterprise, this guide will help you set up the platform efficiently and effectively.
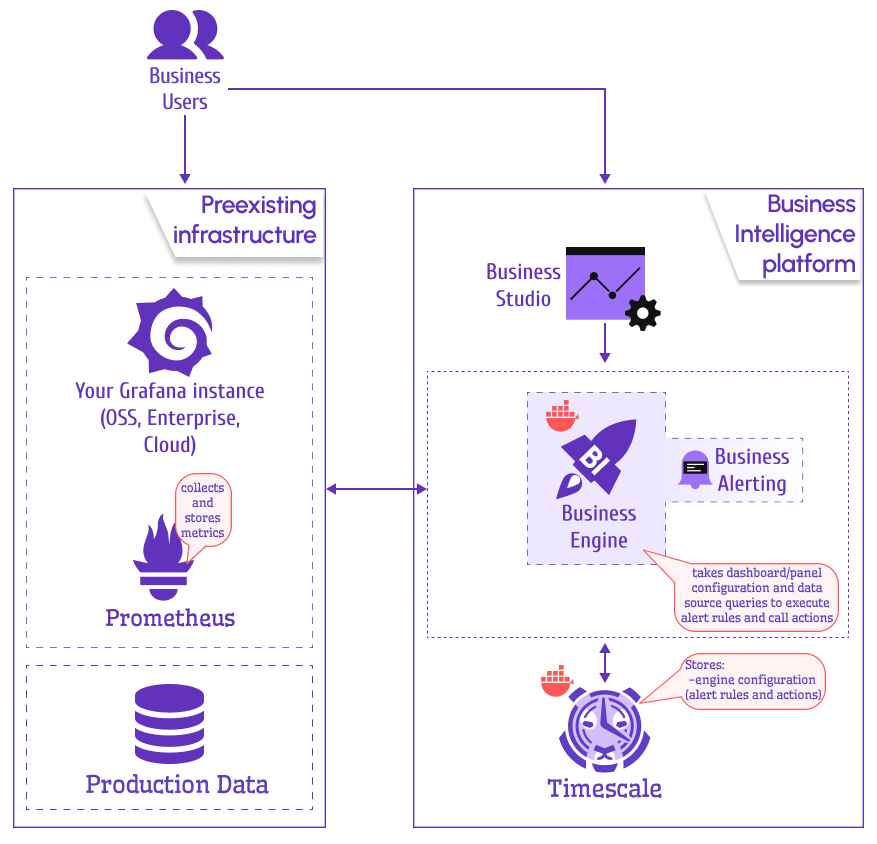
The Business Engine requires Grafana version 11 or later and is fully compatible with the latest Grafana releases, including those running in Grafana Cloud.
Step 1: Clone the GitHub Repository (Optional)
Begin by cloning the official Business Intelligence repository from GitHub. This repository contains essential configuration files, sample workflows, dashboards, and other resources to simplify your setup.
-
Clone the Repository: Run the following command to clone the repository to your local machine:
git clone https://github.com/VolkovLabs/business-intelligence.git -
Navigate to the Directory: Change to the project directory:
cd business-intelligence -
Explore Included Resources: The repository includes the following preconfigured resources to support your deployment:
- Node-RED Workflows: Sample workflows for sending email notifications, Slack messages, and opening Grafana Incidents. These can be customized in the Node-RED UI after starting the container.
- Grafana Dashboards: Prebuilt dashboards for monitoring the Business Engine's performance and alert status. Import these into your Grafana instance via the UI or provisioning.
- Grafana Alloy Configuration: A sample configuration file (
alloy-config.yaml) for collecting metrics and logs from the Business Engine. Update this file with your environment details to enable observability.
Before starting the containers, review and customize the configuration files in the repository to match your environment. For instance, update environment variables in docker-compose.yml or modify Node-RED flows to align with your notification requirements.
Step 2: Configure Docker Compose
Set up a docker-compose.yml file to define the services required for the Business Intelligence platform. The configuration includes the following containers:
- PostgreSQL: Stores configuration data for the Business Engine.
- Business Engine: Connects to a single Grafana instance using a service account token.
- Uses HTTP APIs to retrieve configurations, evaluate alert rules, and execute actions.
- Requires a username and password for the Image Render Microservice to access the Grafana UI for rendering screenshots.
- Node-RED (Optional): Provides workflows for sending emails, Slack notifications, opening Grafana Incidents, and more.
- Grafana Alloy (Optional): Collects metrics and logs from the Business Engine for observability.
loading...
Production Environment Setup
If your production environment already has the necessary components (PostgreSQL, Workflow, and monitoring tools such as Grafana Alloy or Prometheus, and Loki) up and running, you will only need to deploy the Business Engine container.
Step 3: Deploy the Platform
Follow these steps to deploy and launch the Business Intelligence platform:
-
Access Grafana: Log in to your Grafana instance (Cloud, OSS, or Enterprise) with an account that has administrative privileges.
- The Native Grafana Alerting and Image Renderer plugin are optional and can be disabled via environment variables or a configuration file.
-
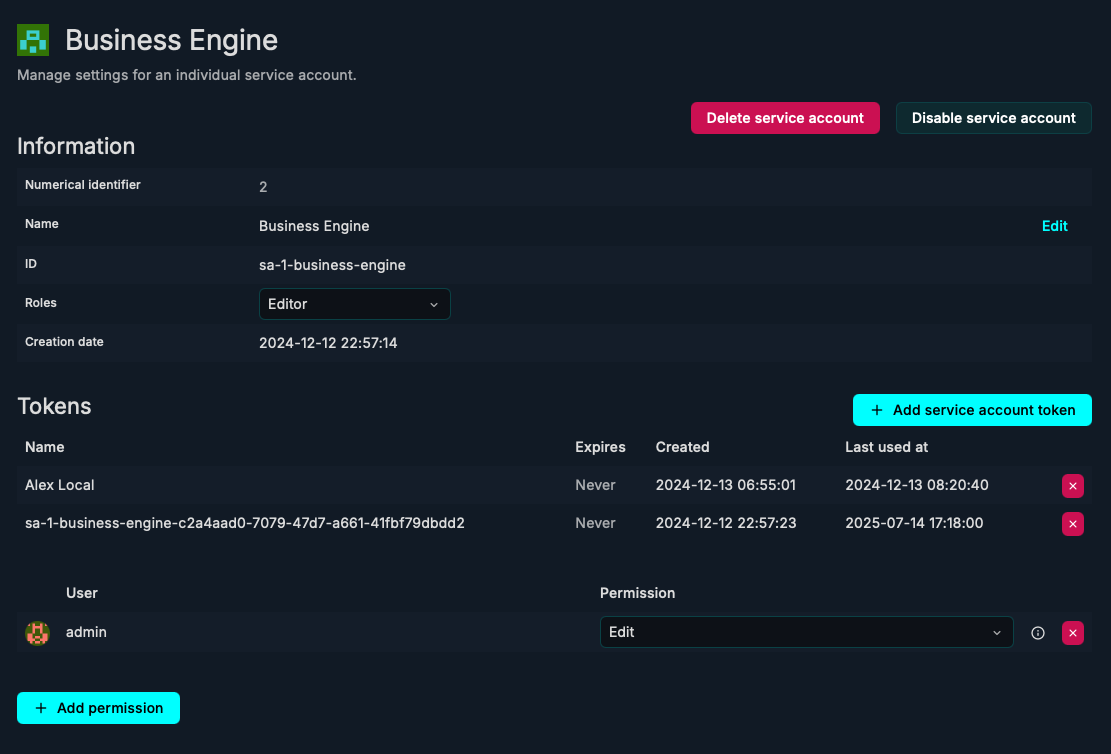
Create a Service Account: Set up a service account in Grafana with Viewer or Editor permissions to enable the Business Engine to interact with Grafana APIs.
- Editor permission is required only for creating annotations.
Grafana Service Account Setup -
Start Containers: Launch the Business Engine, PostgreSQL, and optional containers (Node-RED and Grafana Alloy) using Docker Compose:
docker compose up -dAfter starting the containers, verify that all services are running without errors by using:
docker compose ps -
Install Business Studio: Download the Business Studio application from the GitHub Releases page, then install and open it on your local machine.
Configure Business Engine
In Business Studio, add the Business Engine to configure settings, define actions, set up alert rules, and schedule reports:
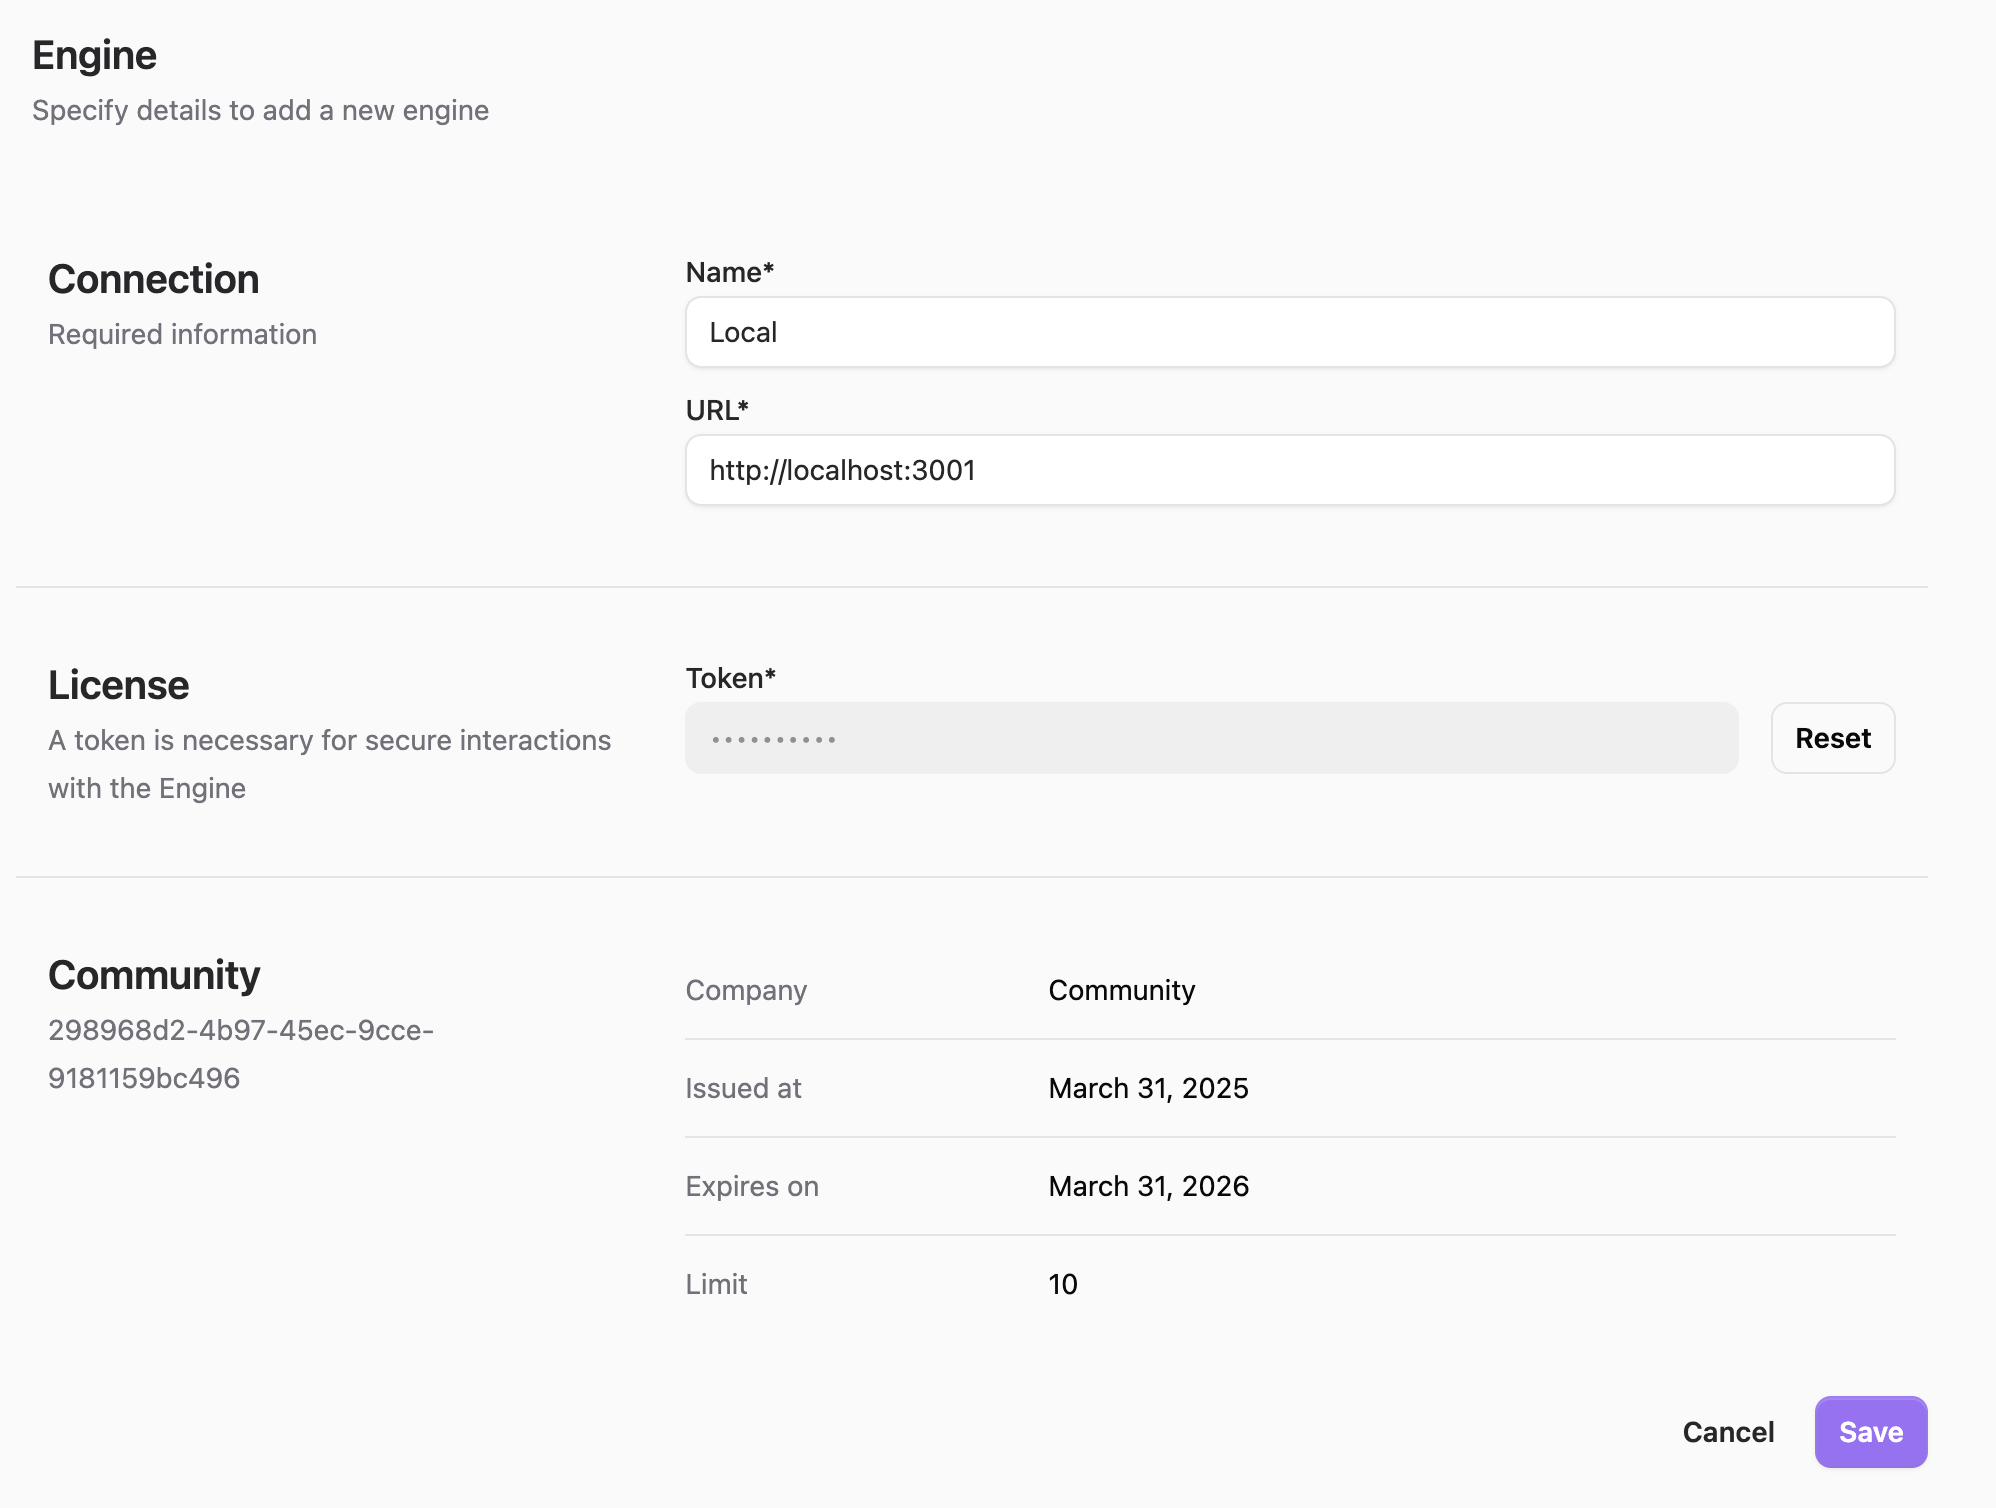
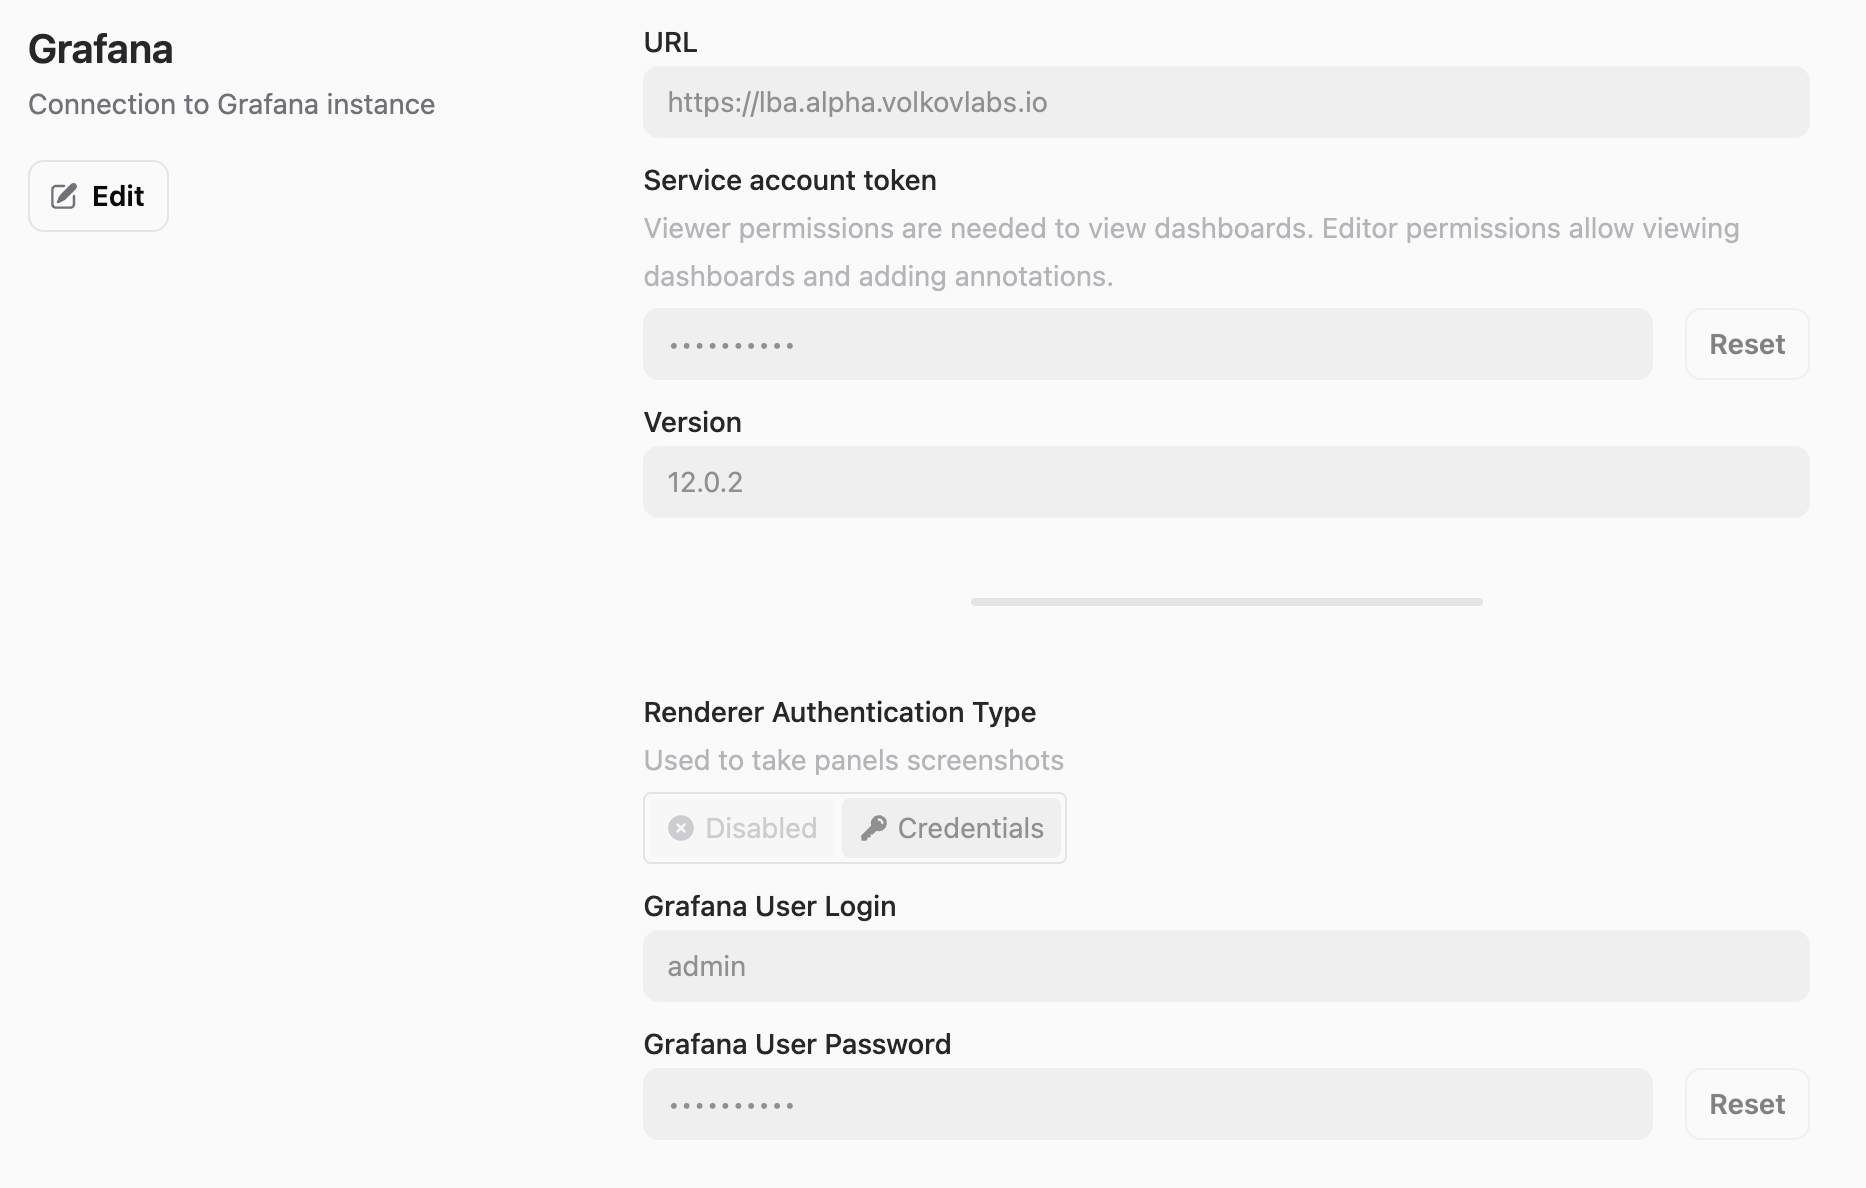
Update the Environment settings to connect to your Grafana instance (OSS, Enterprise, or Cloud). Provide the service account token and username/password for the Image Render Microservice to enable screenshot creation:
Step 4: Stop the Platform
To stop and remove all running containers, execute the following command:
docker compose down
Conclusion
Congratulations! You've successfully set up the Business Intelligence platform using this Quick Start Guide. By following these steps, you've cloned the repository, configured the necessary services with Docker Compose, connected the Business Engine to your Grafana instance, and launched the platform.
With Business Studio, you can now define alert rules, schedule reports, and customize actions to meet your organization's unique needs.
As you explore the platform further, consider tailoring Node-RED workflows and Grafana dashboards to align with your specific use cases. For advanced configurations, troubleshooting, or additional features, refer to the detailed documentation and tutorials.
Start leveraging the power of Business Intelligence to enhance your monitoring and decision-making processes today!