Business Intelligence 3.4.0: Elevating Grafana Workflows with Visual Insights and Collaboration


We’re thrilled to announce Business Intelligence 3.4.0, a game-changing update to the Business Intelligence platform. This release introduces powerful features and enhancements to both Business Studio and Business Engine, designed to streamline collaboration, enhance alerting capabilities, and optimize performance. Whether you're a data analyst, DevOps engineer, or business leader, this update enables you to elevate your Grafana workflows like never before.
What’s New in Business Intelligence 3.4.0?
This release is packed with innovative features to transform your user experience and deepen integrations. Here’s a snapshot of the highlights:
- Panel Screenshots for Alerting: View panel snapshots directly in alert notifications for instant data insights.
- Renderer Microservice: A dedicated microservice for generating panel previews, laying the groundwork for advanced reporting.
- Alerting Event Details: Access a dedicated page for comprehensive details on alerting events.
- Prometheus Metrics Update: Monitor microservices with exposed metrics via Server API on port 3001.
- Google Login Integration: Seamlessly authenticate with Google Firebase to access shared organization engines and boost collaboration.
- Enhanced Engine Management: Benefit from improved sorting for engine lists and support for shared organization engines.
Ready to transform your Grafana workflows? Let’s dive into the details of Business Intelligence 3.4.0!
Instant Visual Insights with Panel Screenshots in Alerting
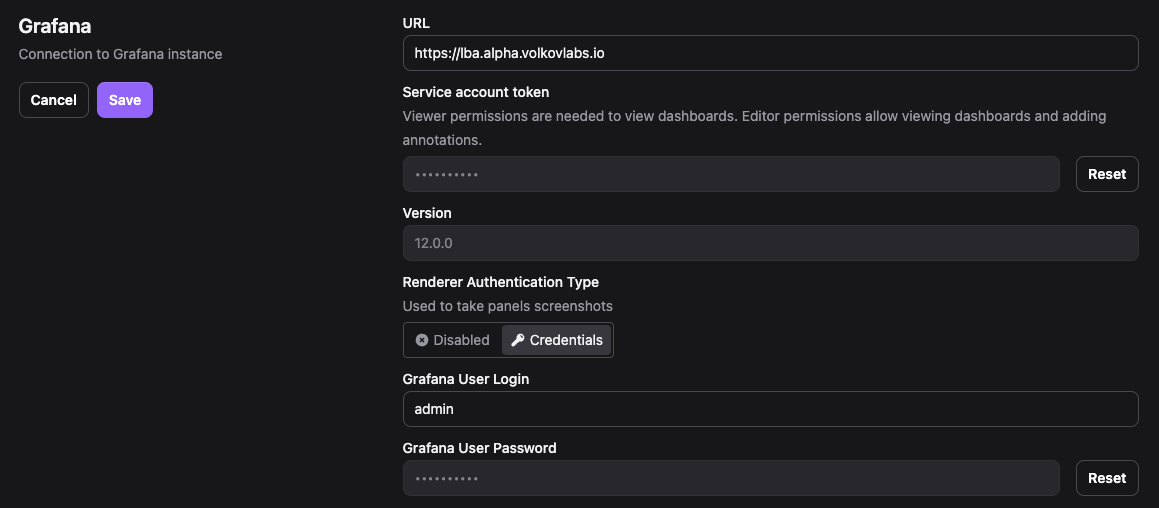
Respond to critical issues faster with the new Panel Screenshots feature. When an alert triggers, a visual snapshot of the relevant Grafana panel is included in the notification, eliminating the need to manually navigate dashboards. This saves precious time during incident response.
Whether you're a DevOps engineer monitoring system health or a business analyst tracking KPIs, this feature lets you assess and act on data insights instantly.
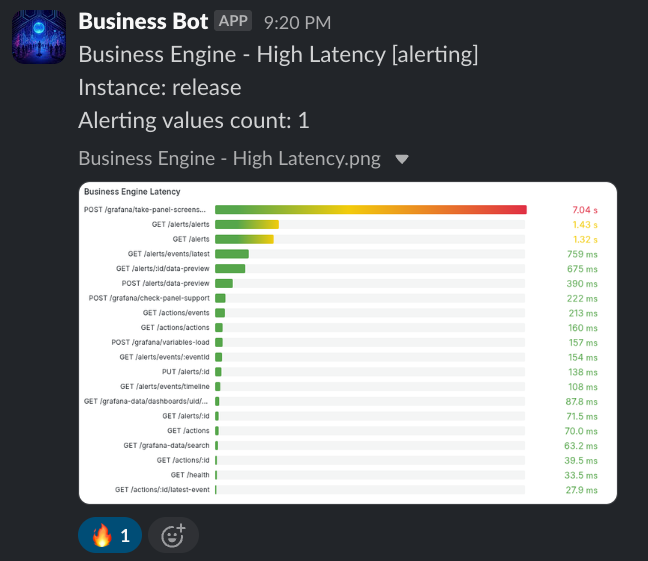
When paired with Image Render Microservice, Node-RED for workflow automation, and Slack for team communication, this setup creates a seamless, real-time alerting pipeline tailored for BI workflows.
Next-Gen Reporting with the Renderer Microservice
Meet the Renderer Microservice—a powerful new tool designed to generate high-quality panel previews on demand. This service is the foundation for advanced reporting capabilities, ensuring that visual data representations are accurate and readily available.

As we expand this feature in future updates, expect seamless integration into automated reports and dashboards, making it effortless to share actionable insights with stakeholders across your organization.
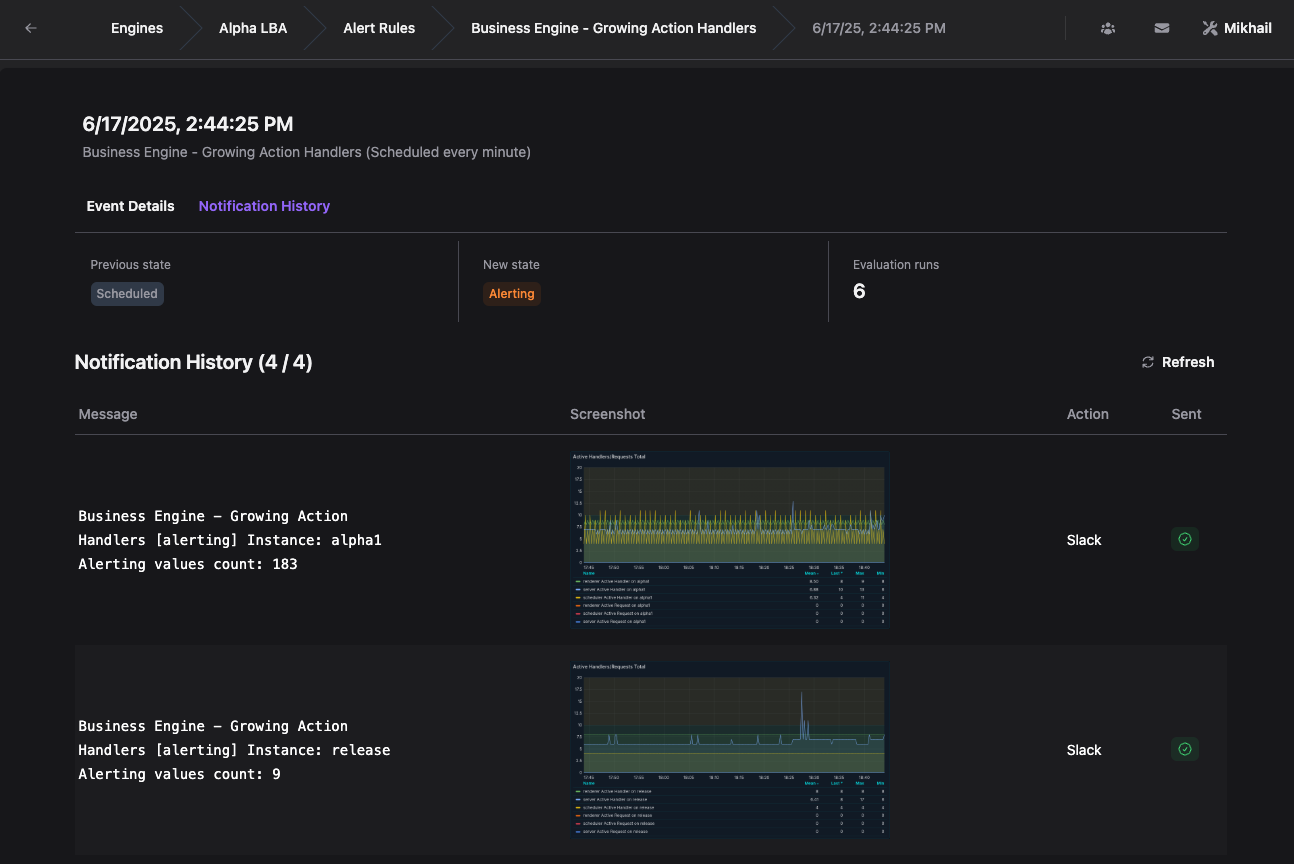
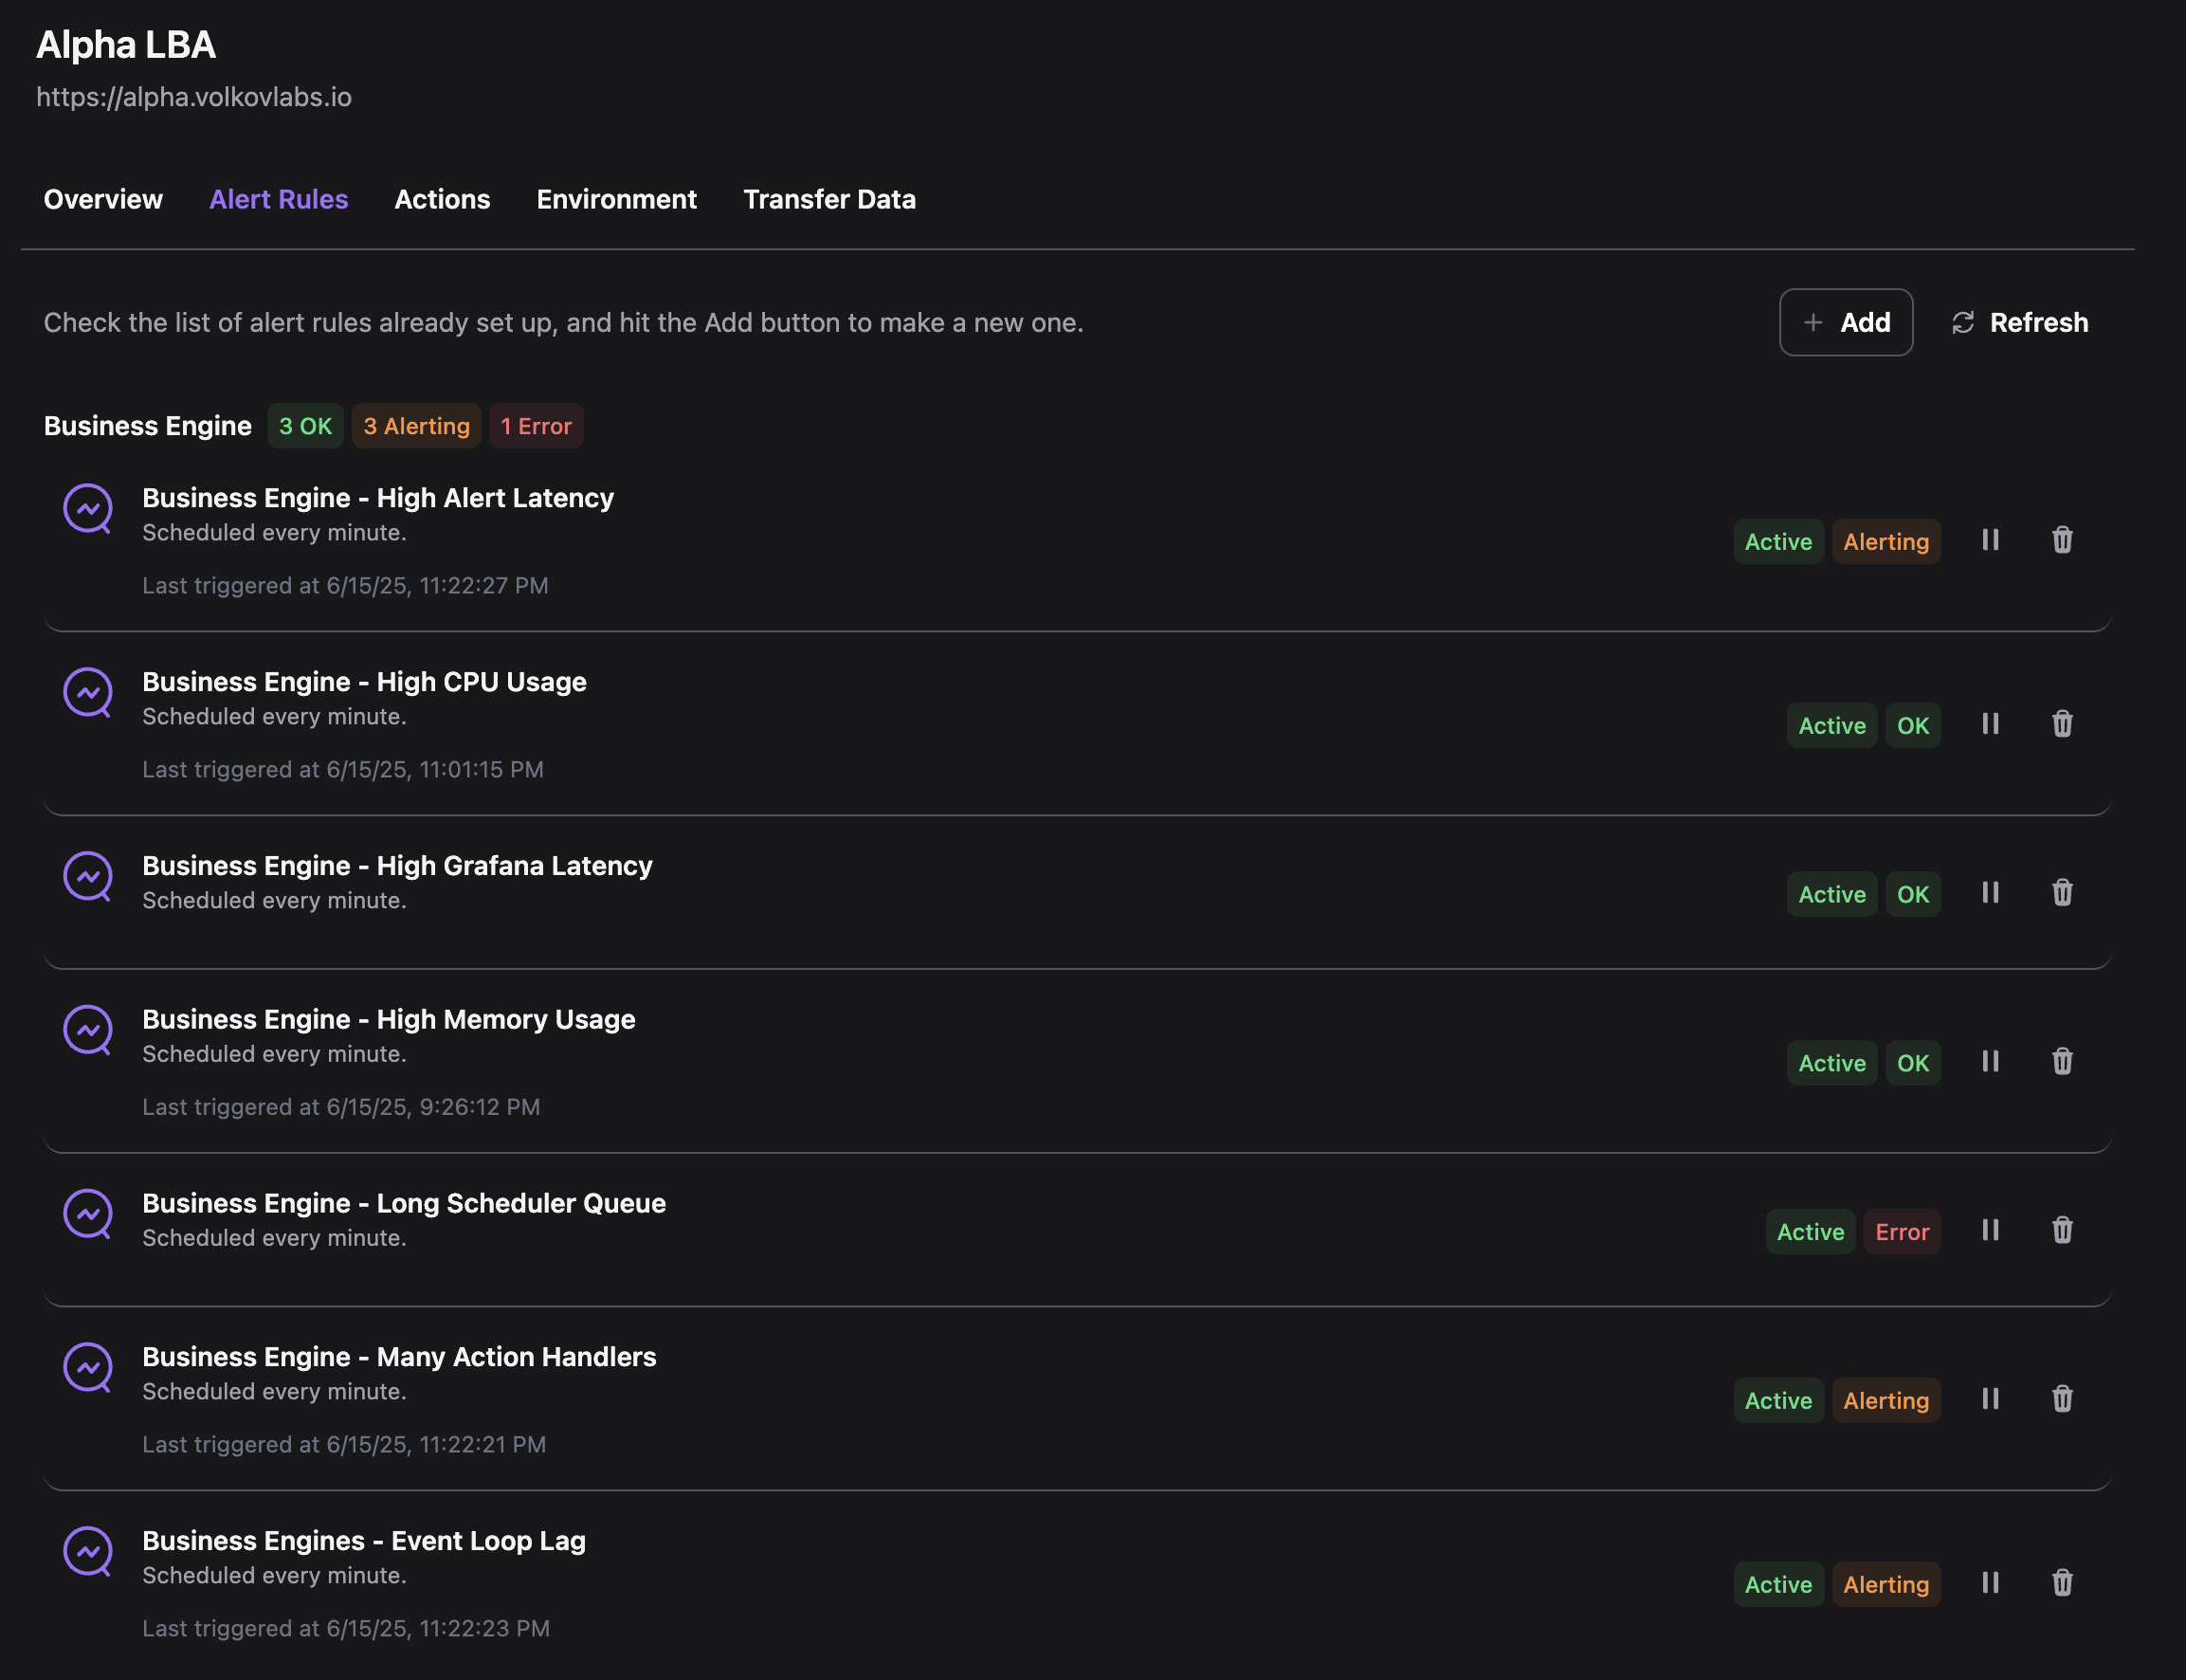
Dive Deeper with Dedicated Alerting Event Details
Gain complete visibility into alerting events with a dedicated details page for each notification. This feature provides in-depth information, including triggering conditions, affected panels, and historical context.
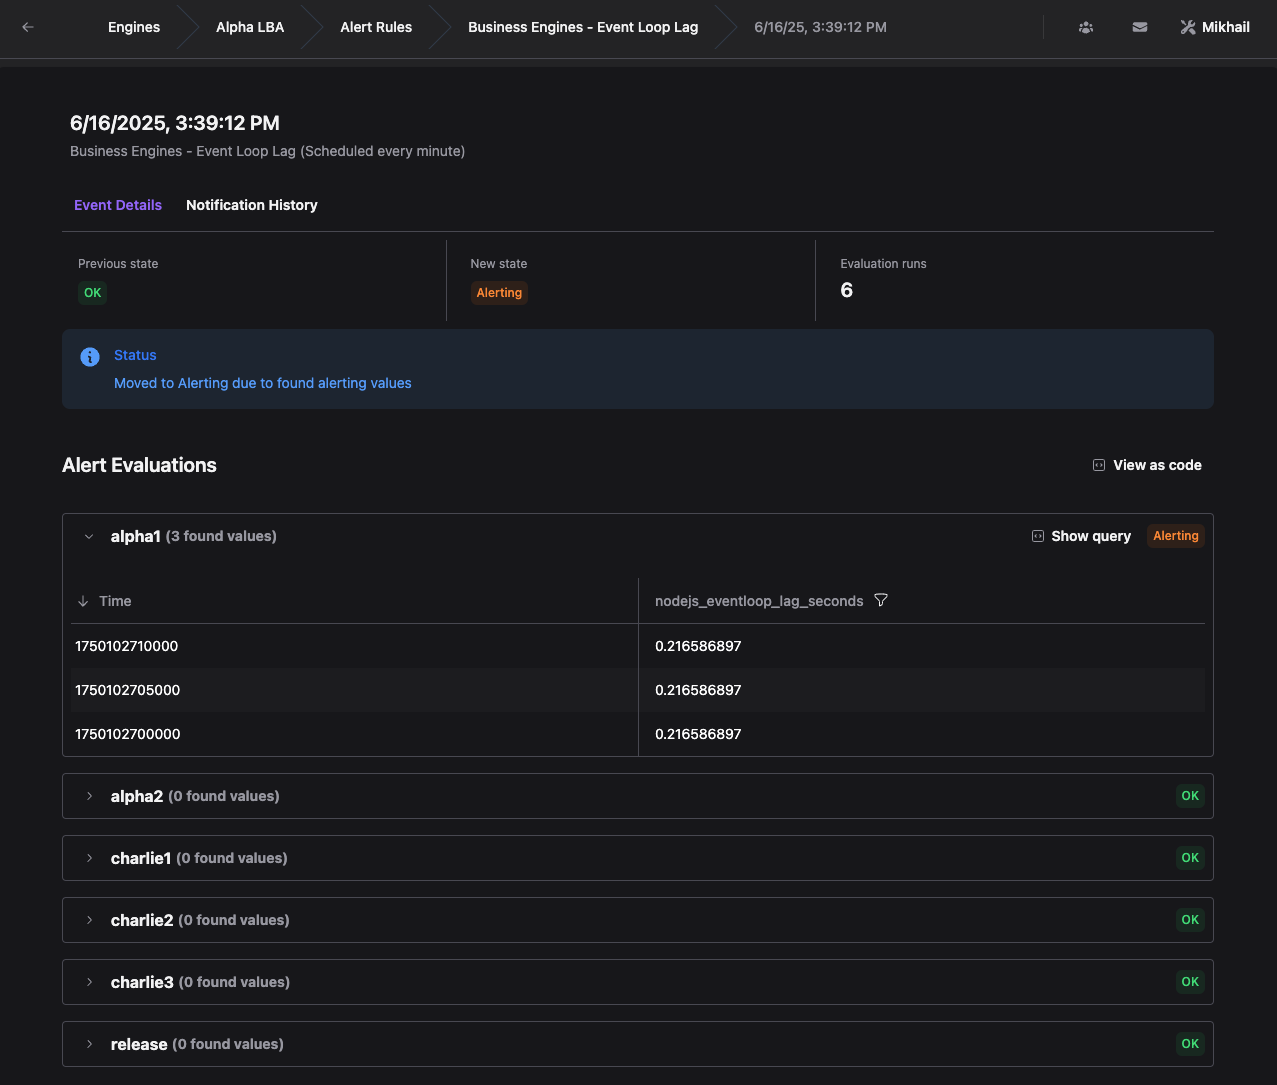
Tailored for data analysts and IT teams, this enhancement ensures you have all the context needed to troubleshoot issues, refine alert rules, and prevent future disruptions—all from a single, user-friendly interface.
Enhanced Monitoring with Prometheus Metrics via Server API
Take control of microservices monitoring with the updated Prometheus Metrics integration. Now accessible via the Server API on port 3001, these metrics offer deeper insights into the performance and health of Business Intelligence components.
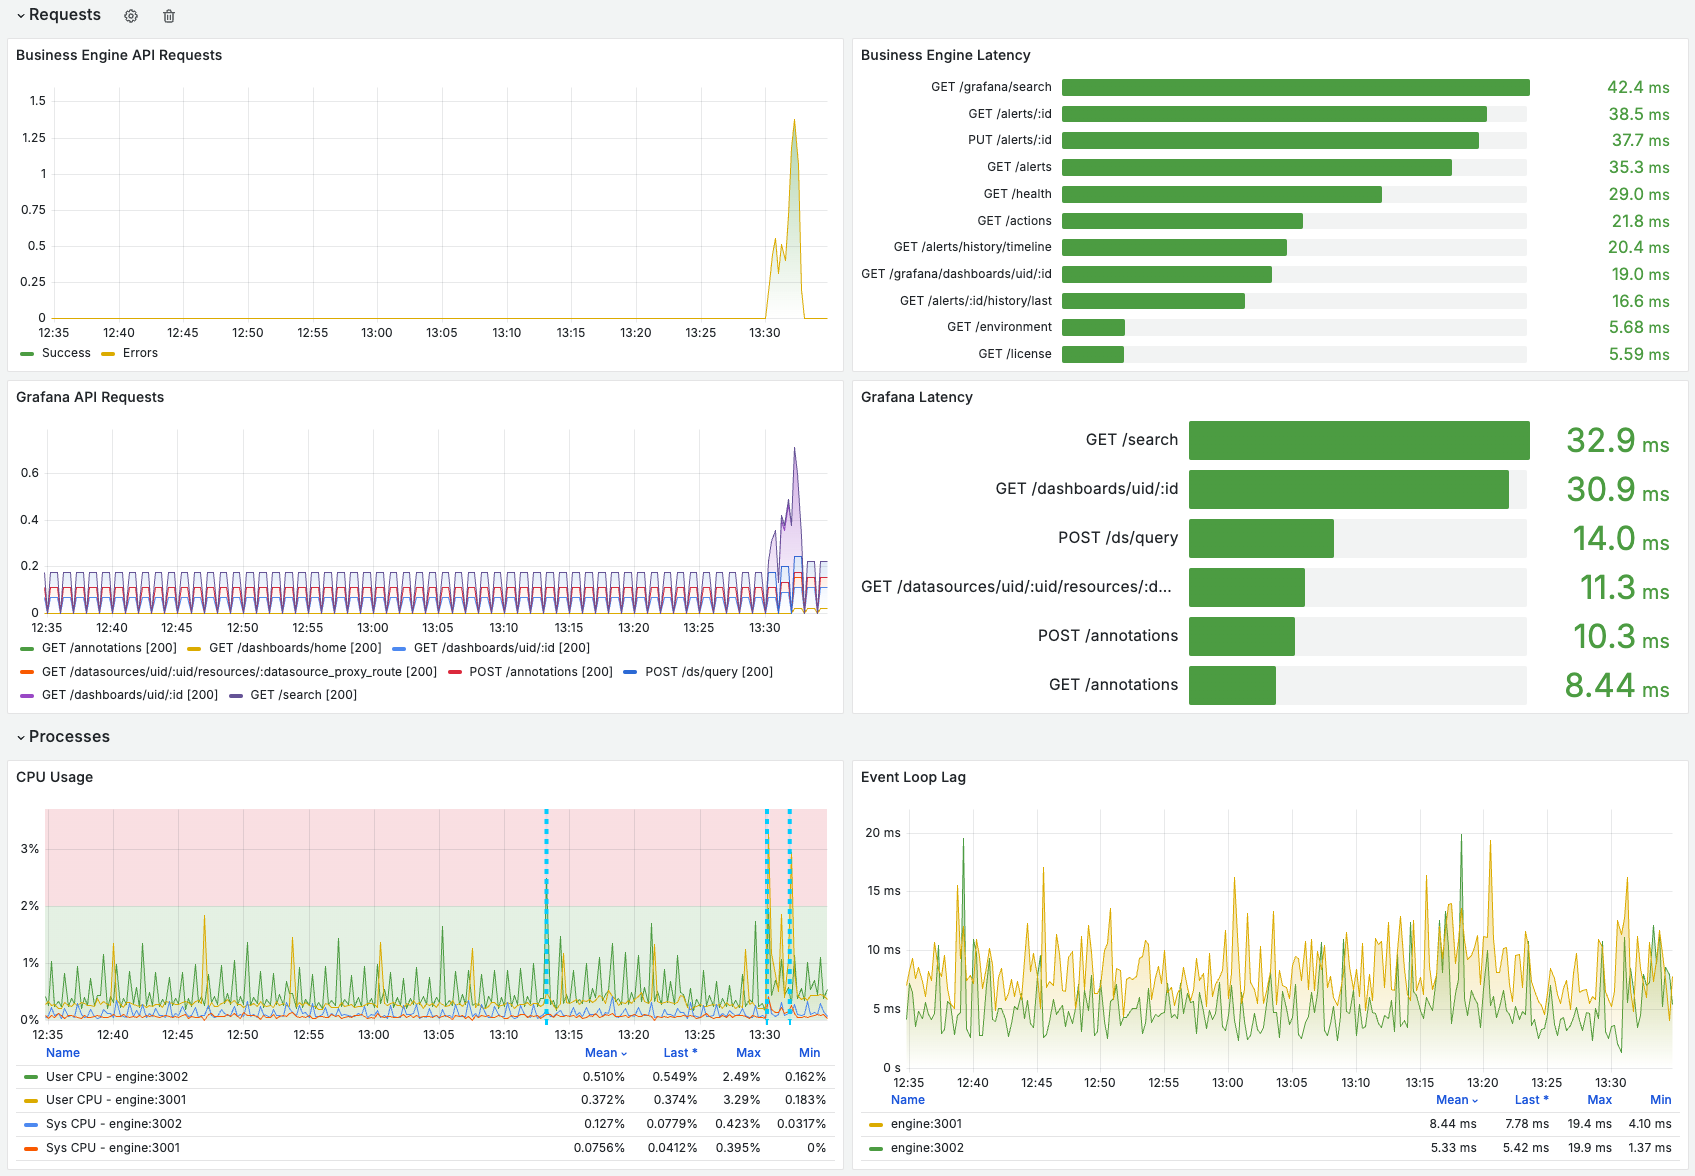
For DevOps teams and system administrators, this update means improved observability, faster debugging, and the ability to proactively optimize your Grafana ecosystem with real-time data.
You can also configure the Business Intelligence platform to monitor Business Engines using predefined dashboards and alert rules, available in our documentation.
Seamless Collaboration with Google Login Integration
Collaboration is now simpler with Google Login Integration powered by Google Firebase. This feature enables users to authenticate effortlessly and access shared organization engines, breaking down barriers and fostering teamwork across departments.

Whether onboarding new team members or managing multi-team projects, this secure and intuitive login option ensures everyone can contribute to a unified Business Intelligence platform.
Streamlined Operations with Enhanced Engine Management
Managing Business Intelligence engines has never been easier. With improved sorting for engine lists and full support for shared organization engines, you can organize and access resources with minimal effort.
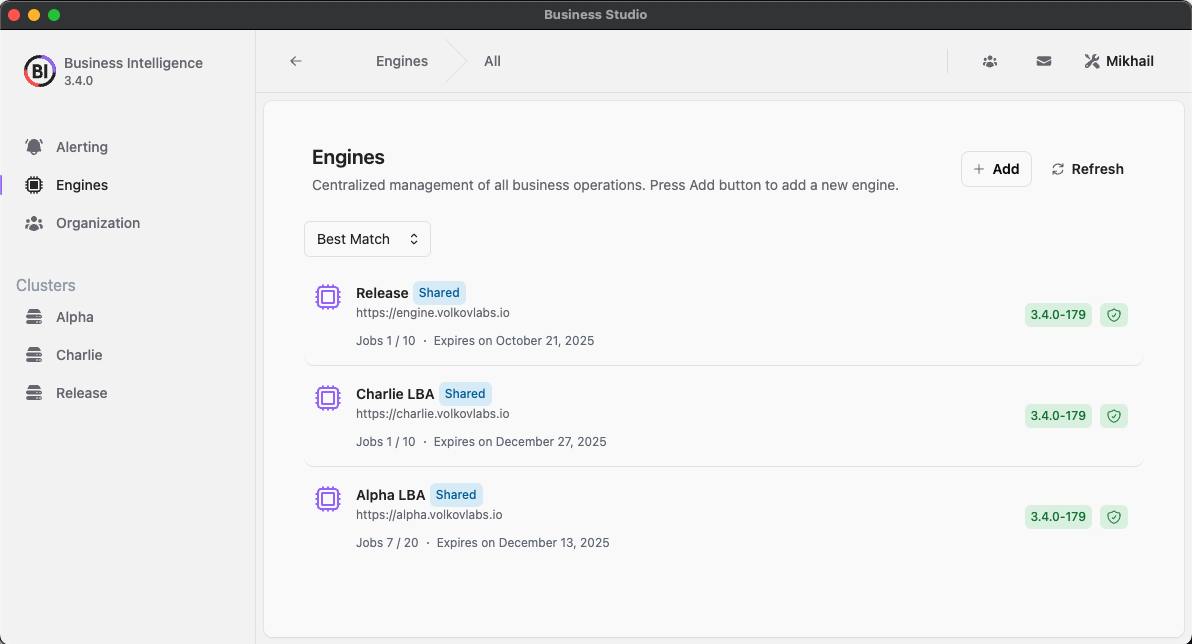
This update is ideal for business leaders and IT managers overseeing complex environments, ensuring smooth operations and efficient resource allocation across teams.
Why Upgrade to 3.4.0?
Business Intelligence 3.4.0 is more than an update—it’s a significant step forward in making Grafana workflows intuitive, collaborative, and actionable. From alert-driven analytics to seamless integrations, this release enables teams to make data-driven decisions faster and more effectively.
Don’t miss out—upgrade to Business Intelligence 3.4.0 today and experience the future of Grafana workflows!
Download Business Studio 3.4.0
Our MacOS and Windows installers are signed, notarized, and built using automated GitHub workflows to ensure maximum security and reliability.
Choose the installer for your system:
- MacOS:
- Linux:
- Windows:
Getting Started
The Business Intelligence platform uses Docker containers to deliver a modular, scalable solution. Our Quick Start guide provides a simplest setup to get started.
Release Notes
Business Studio 3.4.0
- Google Login Integration: Authenticate effortlessly with Google Firebase to access organization engines and enhance teamwork.
- Panel Screenshots for Alerting: View visual previews of panels during alerting events for faster insights.
- Enhanced Engine Management: Enjoy improved sorting and support for shared organization engines.
- Improved UI Experience: Experience smoother interactions with added animations and a refined refresh mechanism.
- Alerting Event Details: Access detailed notification information on a dedicated page for each alerting event.
Business Engine 3.4.0
- Google Firebase Authentication: Securely authenticate users and manage shared engine configurations.
- Renderer Microservice: Generate panel previews with a new service, setting the stage for future reporting tools.
- Prometheus Metrics Update: Monitor microservices with metrics accessible via Server API on port 3001.
- Testing Improvements: Enhanced E2E and unit tests for alert rules and actions ensure robust reliability.
We’d Love to Hear From You!
Have feedback or ideas? Get involved:
- Questions, Features, or Bugs: Open a Zendesk ticket for a prompt and dedicated response from our team.
- Join the Conversation: Subscribe to our YouTube Channel and share your thoughts in the comments.
Your input helps us improve, so don’t hesitate to get in touch!