Editable data, pagination, and download CSV in Business Table 1.3.0
We're excited to announce the release of the Business Table panel 1.3.0. This feature release includes the following updates:
- You can allow to edit data and impose permission protection
- Client and server Pagination feature
- Column Pin feature
- Download table data button
- Support of the Data links
Downloads
The Grafana Community greeted the Business Table panel with cheerful applause and grateful hollering. In the first two weeks of existence, the plugin has been downloaded almost half a thousand times! It is a terrific start for a new plugin with basic functionality. We are eager to learn what the features from this latest release will do with the downloads number! Stay tuned.

Edit data and impose permission protection
That is a loaded feature requiring a comprehensive explanation. Hold on tight.
Here are some highlights:
- Every column has separate editable/permission settings.
- User can enter a new value manually or select from the predefined listing coming from your data source
- The Update Request (the request that takes user-entered values and transmits them into your data source, serving as a bridge between user input and data source) is configurable and allows custom logic
- The permission can be Grafana user-based (Viewer/Editor/Admin/None) or regulated from the backend
Editing and permissions settings are done in a new Editable Data category. All columns you add into the Layout category, you can further configure there.

To make a column editable, turn the appropriate switch on. With that the tag Editable appears next to the column name in the Layout category.
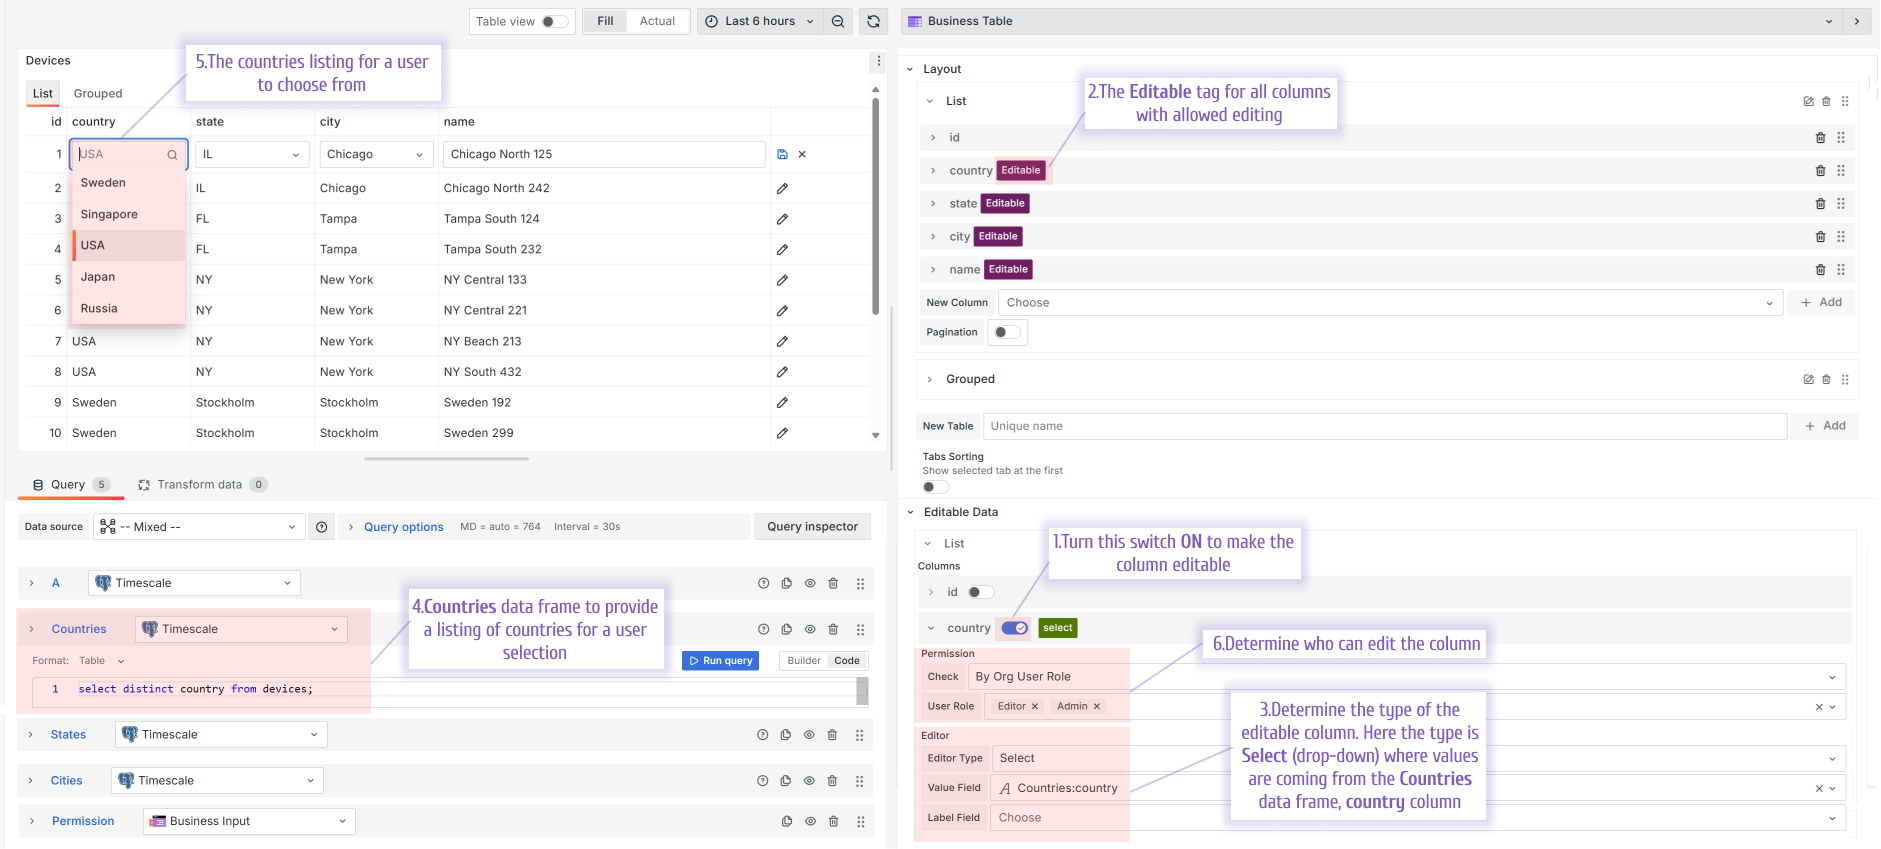
Editable column types
After you turn the editable switch ON, determine the type for the editable column. Depending on your choice, more parameters appear.
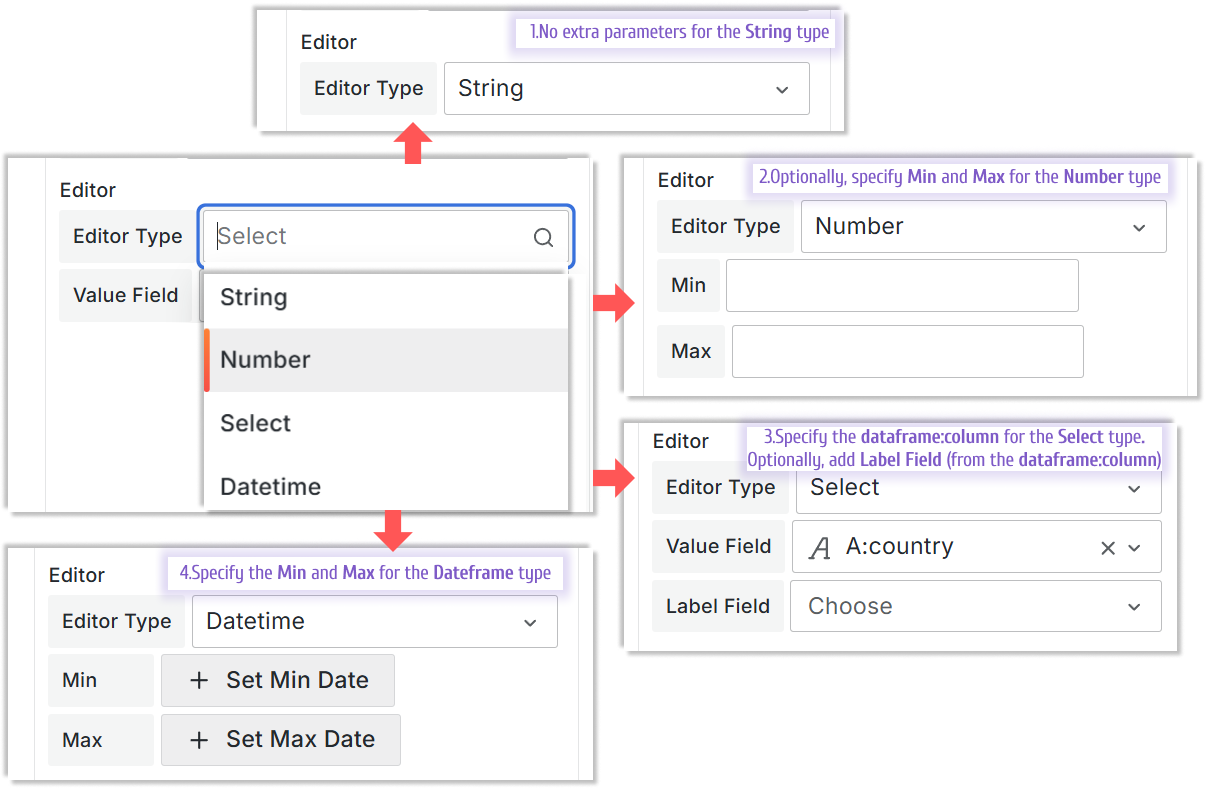
You can choose between the following types:
- String. It allows a user to enter a value manually.
- Number. It allows a user to enter a numerical value manually. Optionally, you can specify the Min and Max for the allowed values.
- Select. It gives users a drop-down populated from the Value Field parameter. Optionally, you can specify Label Field. Both parameters, Value field and Label Field, come from the dataframe:column of your data source.
- Datetime. It allows a user to enter a value in the datetime format. Optionally, you can specify a range of allowed datetimes using Set Min Date and Set Max Date parameters.
Update Request
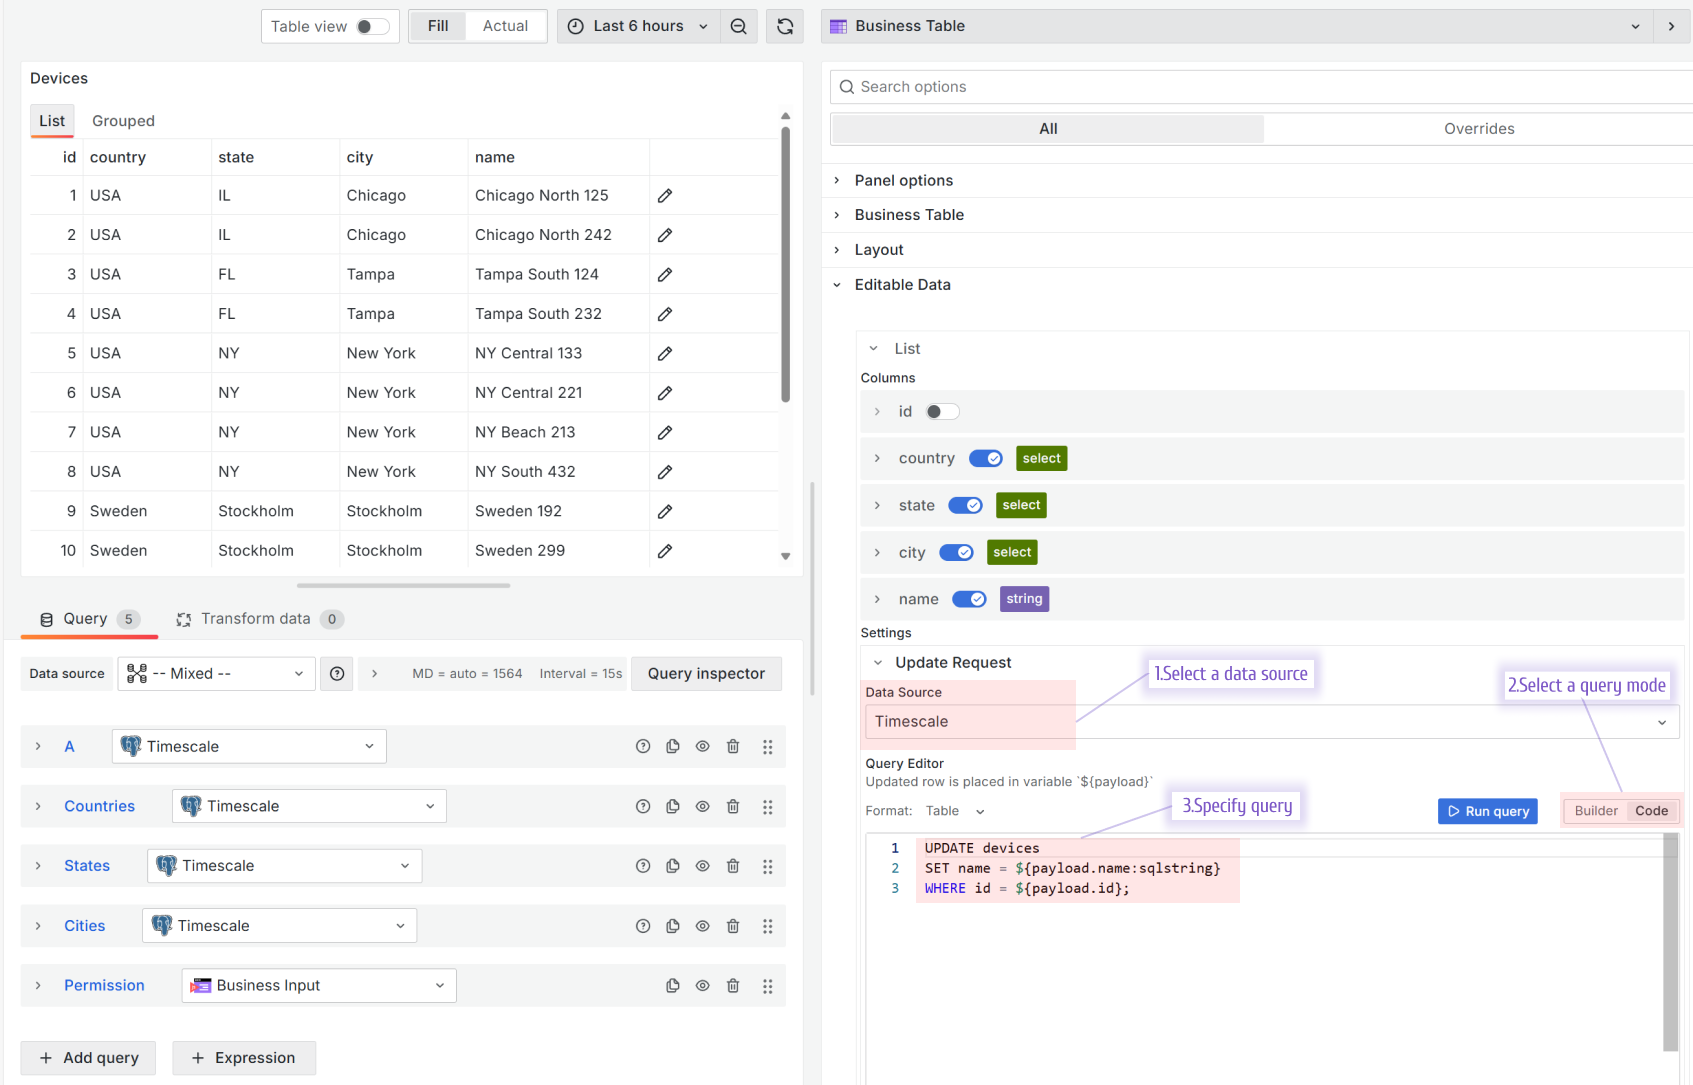
Configure the Update Request (the request that takes user-entered values and transmits them into your data source, serving as a bridge between user input and data source) in the Editable Data -> Settings section.
First, select the data source where the updated values should go to. Then, choose the Query Editor mode if it's supported in the data source. Your choice is:
- Builder. It uses the standard Grafana query builder.
- Code. It allows you to specify an update request query in a language appropriate for your data source.
Permission
Every column in the Business Table visualization can have unique permissions for editing. Set the Check parameter to one of the following:
- Always Allowed. Every user has permission to edit the column.
- By Org User Role. With that, you need to specify which roles have permission to edit (Editor, Viewer, Admin, None).
- By Backend. With that, you need to specify a data frame column with a boolean value. If the value is true, a user has permission to edit. If the value is false, a user does NOT have permission to edit.

Pagination feature
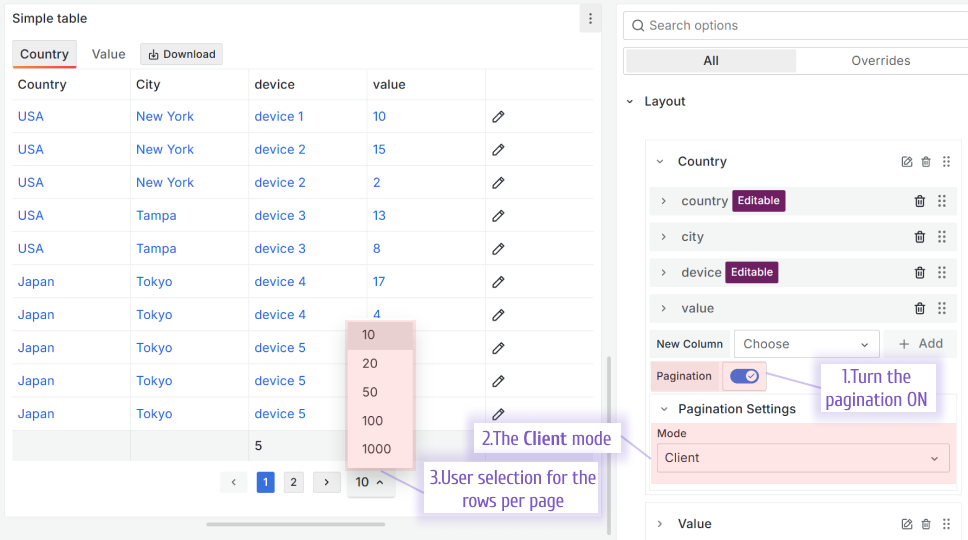
You have a choice of two pagination modes: Client and Query.
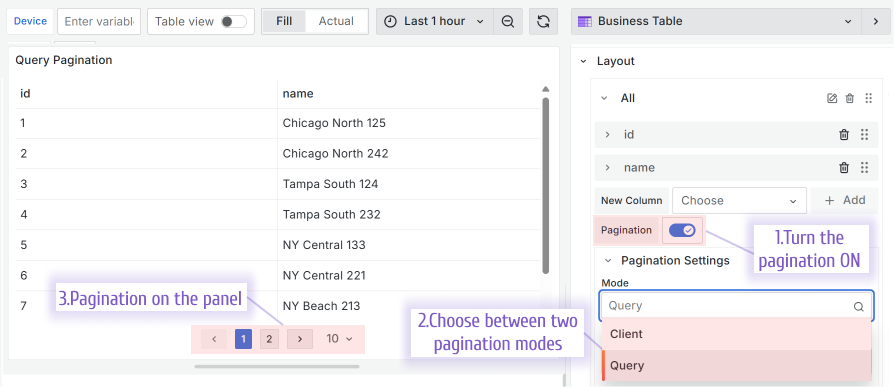
Client
With the Client mode, all records are retrieved by the Business Table panel simultaneously and then divided into the pages by your browser. By default, ten rows per page are displayed. A user can change it to 20, 50, 100 or 1000.
The Client mode is the easiest and fastest to set up. However, users might experience performance issues since all data must be retrieved before being separated into pages.
Query
With the Query mode, only records needed for the current display are retrieved. That approach guarantees better performance for the end-users.
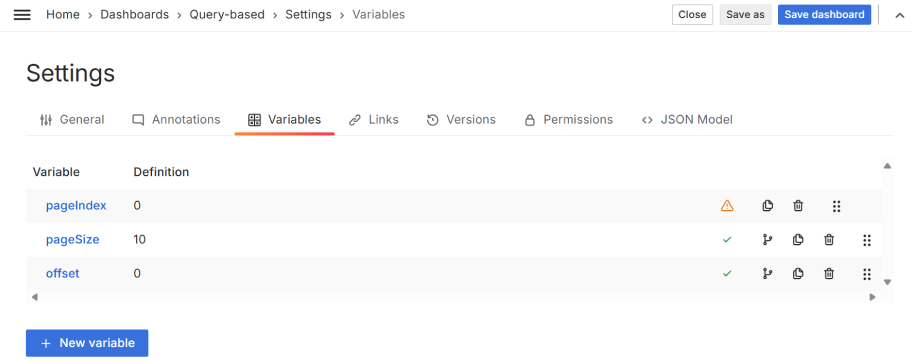
The determination of what records to retrieve (what records need to be displayed) is done by using the following variables:
- pageIndex. Page order number. Specify as a dashboard variable name.
- offset. How many rows to skip starting from the first. Specify as a dashboard variable name.
- pageSize. The number of rows per page. Specify as a dashboard variable name.
- Total Count Field. Specify as a dataframe:column name. Preffered to set to display total number of pages.
The necessity of the first three metrics (pageIndex, offset, pageSize) is contingent on the data source from which the data is sourced. Understanding this dependency will prepare you for efficient data retrieval.
In the example below, we use the Timescale data source, consequently SQL, to retrieve the data. pageIndex and offset are enough metrics in that case.

Column Pin feature
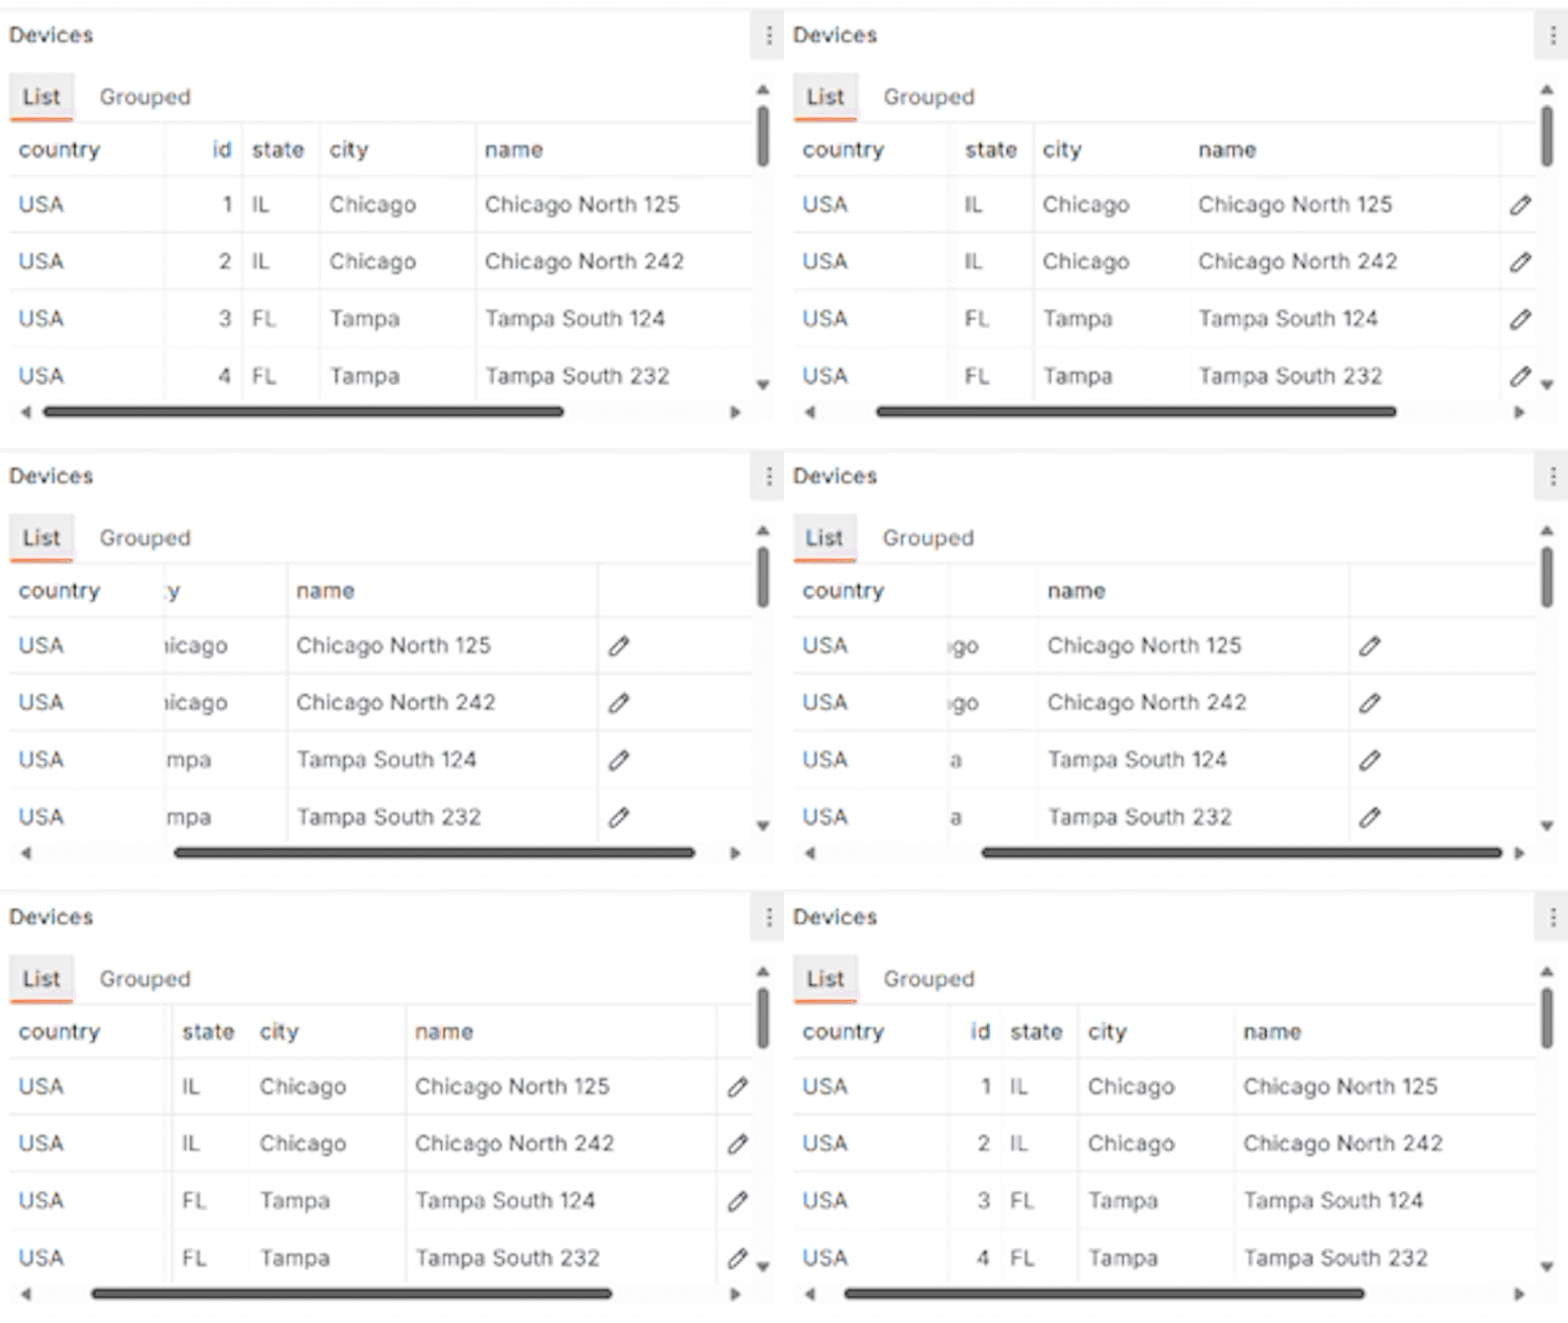
It is a helpful feature for the wide tables. You can pin any column to always stay visible on the left or right.

Below, the column Country is pinned to the left.
Download table data button
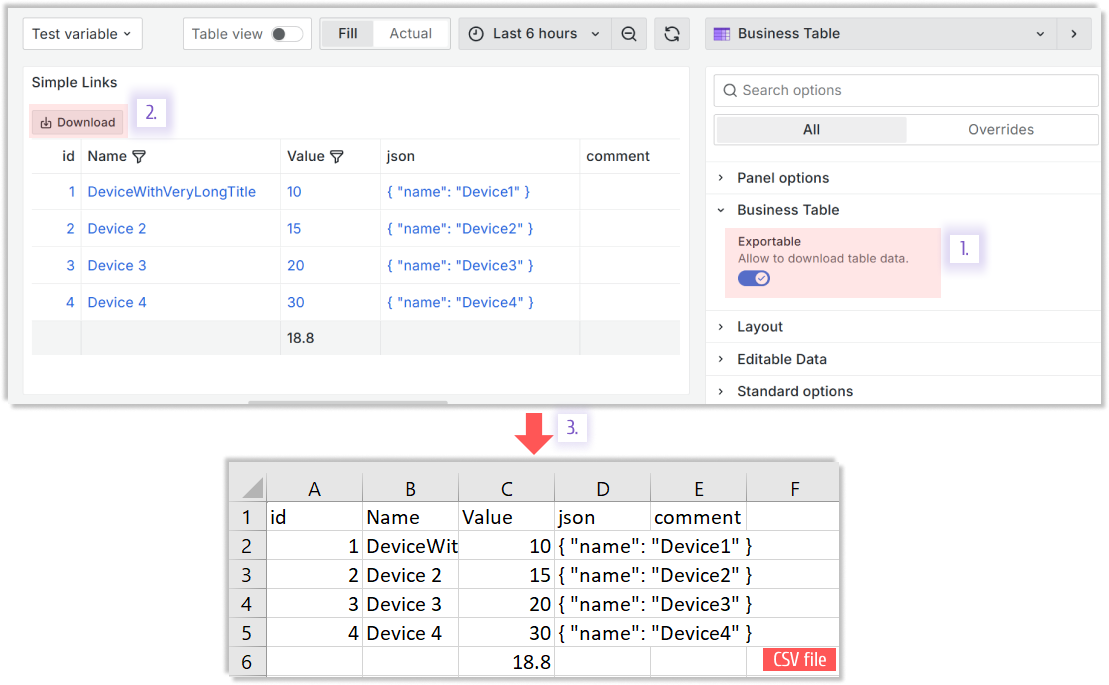
You can add a download button right on the Business Table visualization for an intuitive user experience.
Data links support
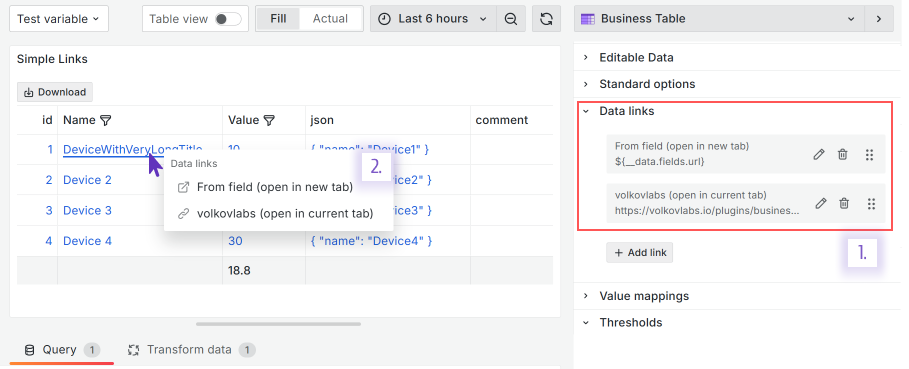
The Business Table visualization supports the Data links feature. In the example below, when a user clicks on a row, two links are suggested in the popup window.
You can use the Grafana Overrides feature to configure column links (not for the whole row).
Getting Started
The Business Table panel can be installed from the Grafana Catalog or utilizing the Grafana command line tool.
For the latter, please use the following command.
grafana cli plugins install volkovlabs-table-panel
Tutorial
The Business Table 1.9.0 for Grafana brings an exciting functionality when a user can add, edit and delete rows from the Grafana dashboard. In addition, the Business Table 1.9.0 features useful functionality such as Grafana Thresholds, displaying images, easy connections with other Grafana panels and more!
We have many other tutorials that you can find helpful. You can review all related to this plugin tutorials here.
Release Notes
- Requires Grafana 10.3 and Grafana 11
Features / Enhancements
- Added edit data with based permission check (#40, #76)
- Added edit permission based on query (#47)
- Added client and query pagination (#50)
- Added functionality to pin columns (#53, #65)
- Added download table data as CSV (#61)
- Updated Page size button to prevent overflow (#62)
- Added reset table state on tab change (#67)
- Updated Table Editor to improve UI/UX (#66)
- Updated Sorting options (#69)
- Added DataLinks support (#75)
Volkov Labs Is Now Closed
Following our acquisition, Volkov Labs has officially ceased operations as of September 26, 2025. We are no longer accepting feedback, support requests, or partnership inquiries. The Business Suite for Grafana repositories have been archived on our GitHub organization, and no further development or support will be provided.
We are deeply grateful for the incredible support from our community and partners over the past four years.


