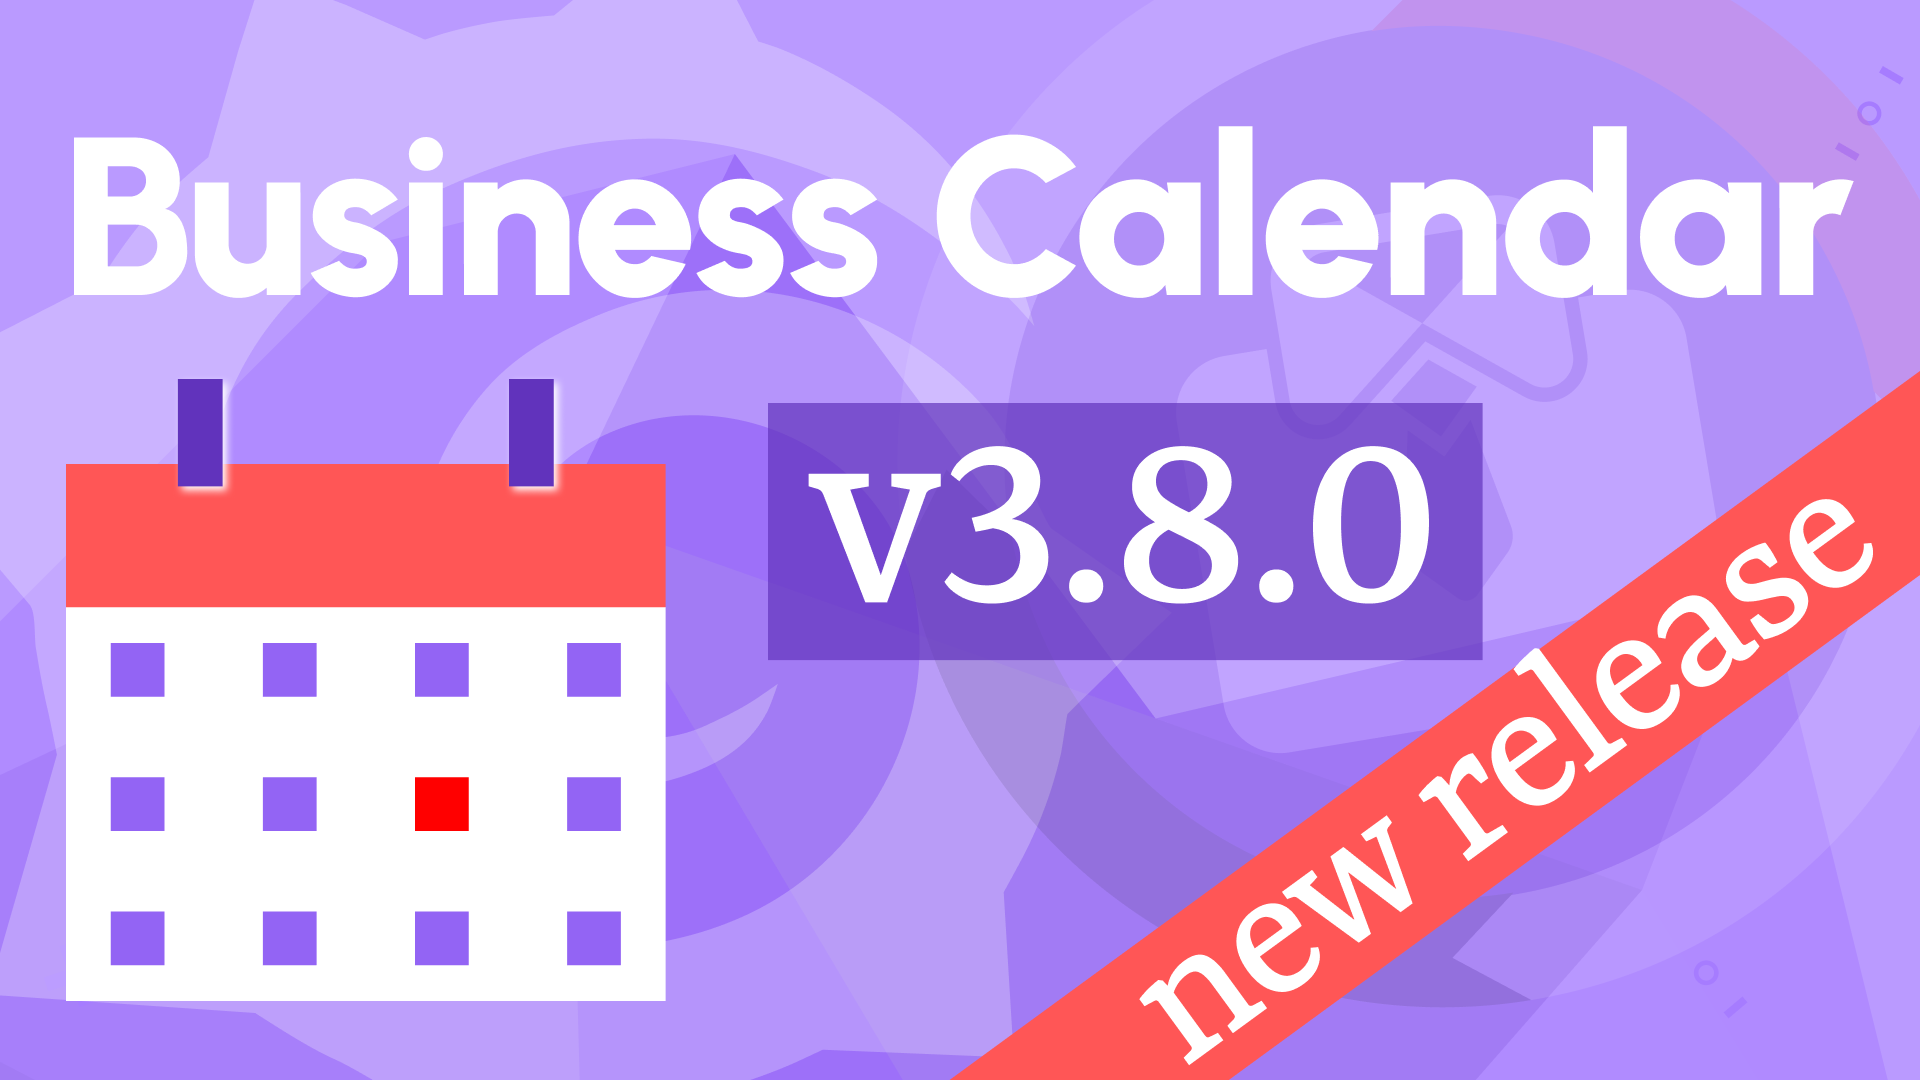
Business Calendar 1.2.0: Week Start, Event Details, and Modern Styling

We’re thrilled to unveil Business Calendar 1.2.0, a significant update to our popular Grafana plugin. With over 1 million downloads, this release brings exciting features, modern styling, and enhanced functionality to help you visualize events like never before. Here’s what’s new:
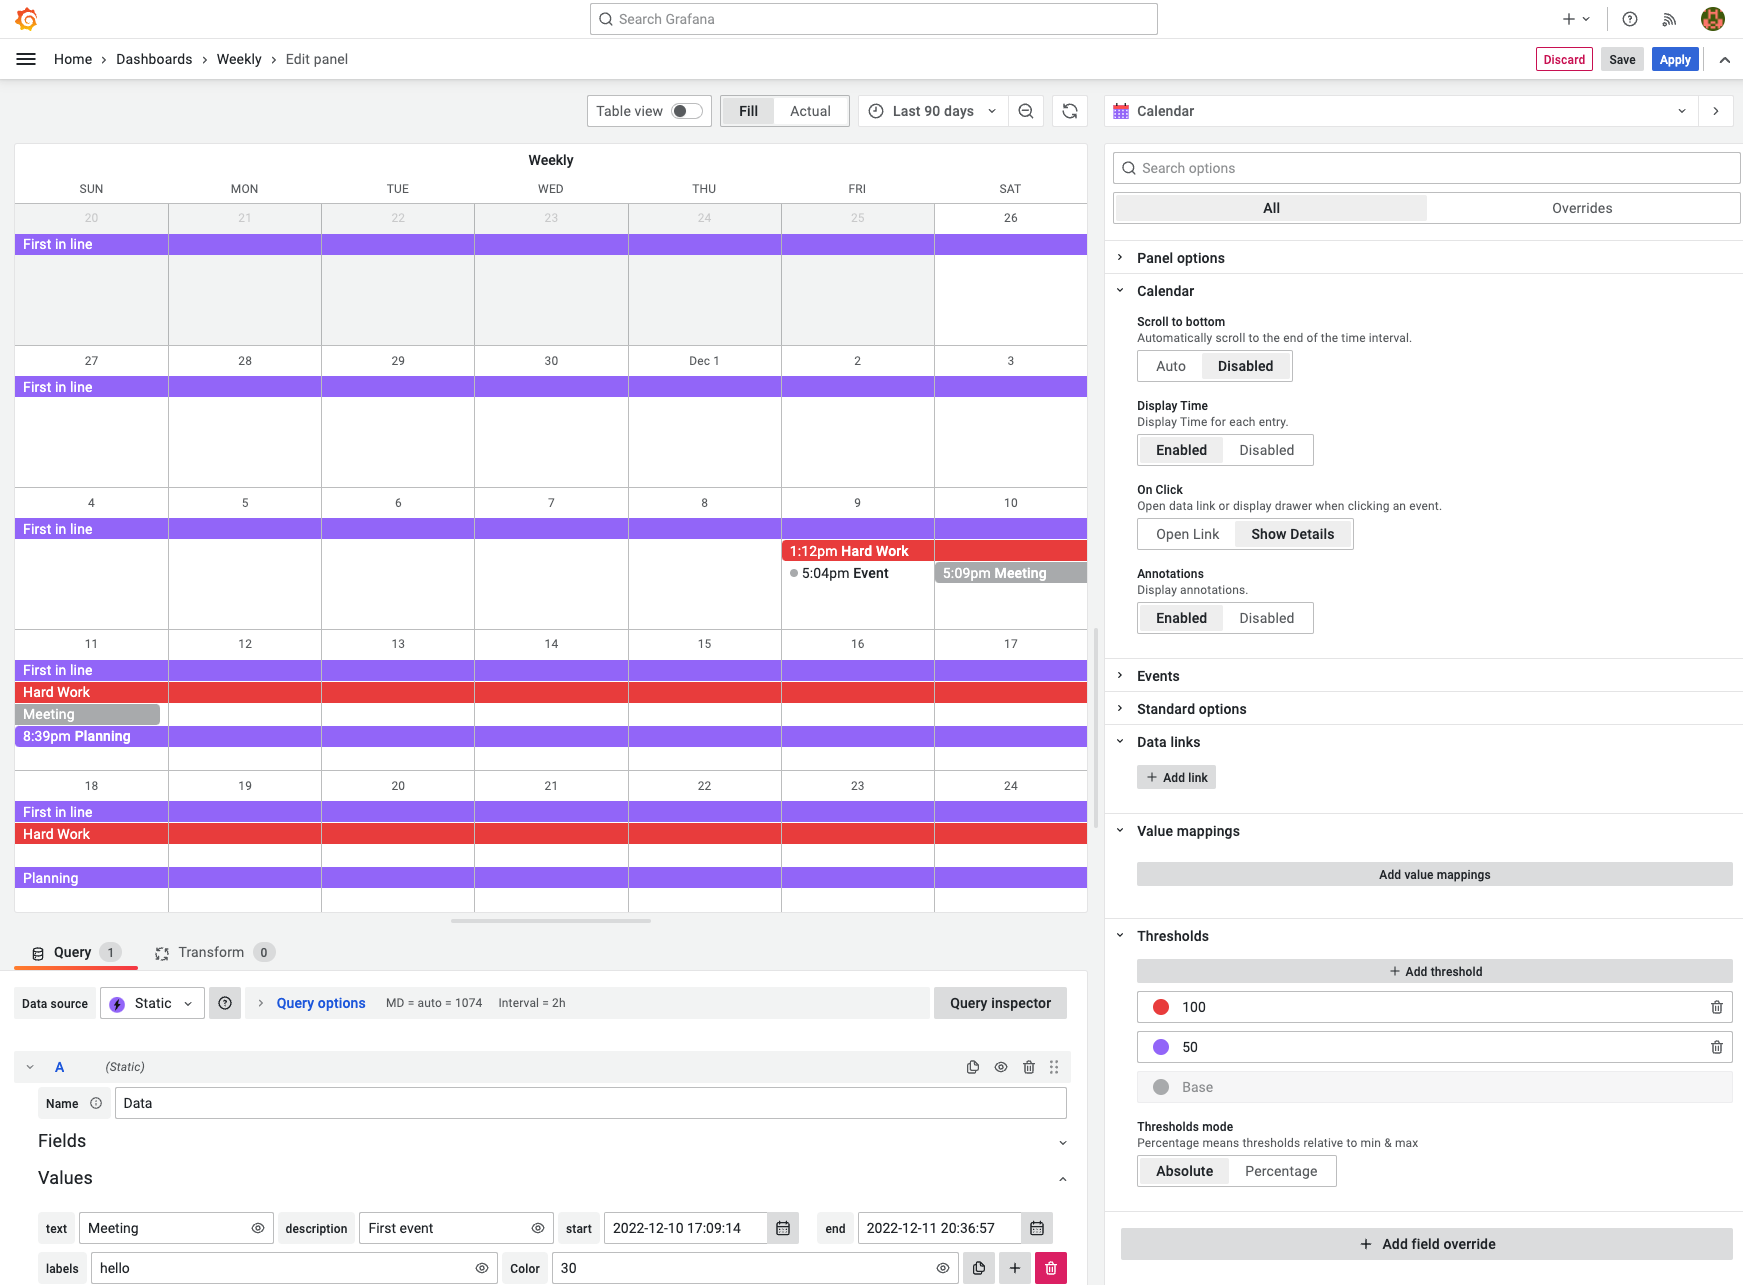
- Event Coloring: Color-code events based on threshold ranges for better insights.
- Week Start Customization: Align the calendar with your system’s week start day (Monday, Saturday, Sunday, or default) via Grafana settings.
- Time Display Option: Show event times alongside titles for clarity.
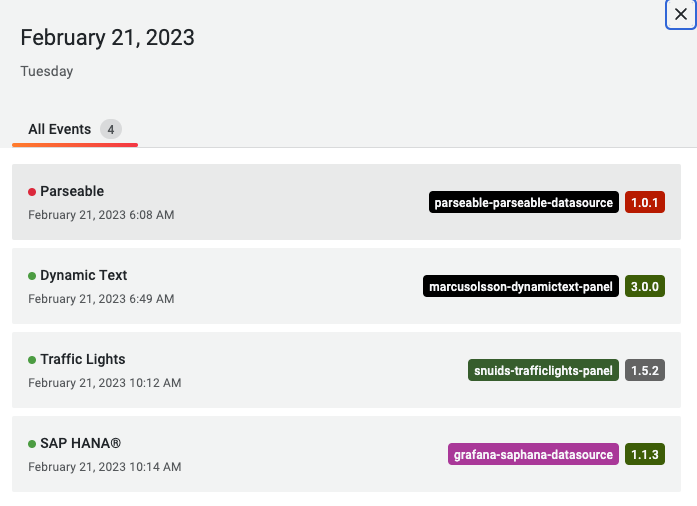
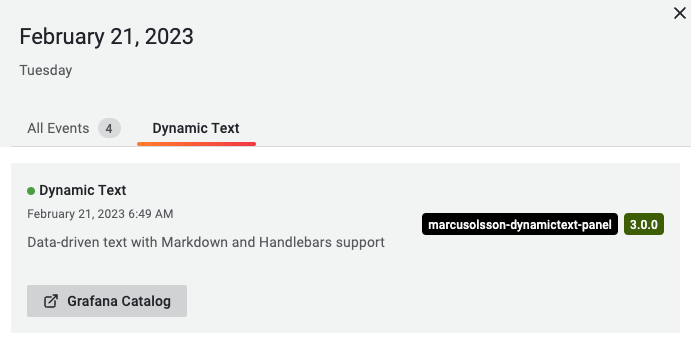
- Modern Drawer UI: Redesigned sidebar with a card-based layout for event details.
- Grafana 9.3.6 Compatibility: Seamless integration with the latest Grafana version.
- Theme v2 Migration: Refactored legacy code and updated styles for a sleek, Google Calendar-like experience.
- Visual Overhaul: Removed panel padding and modernized the plugin’s look.
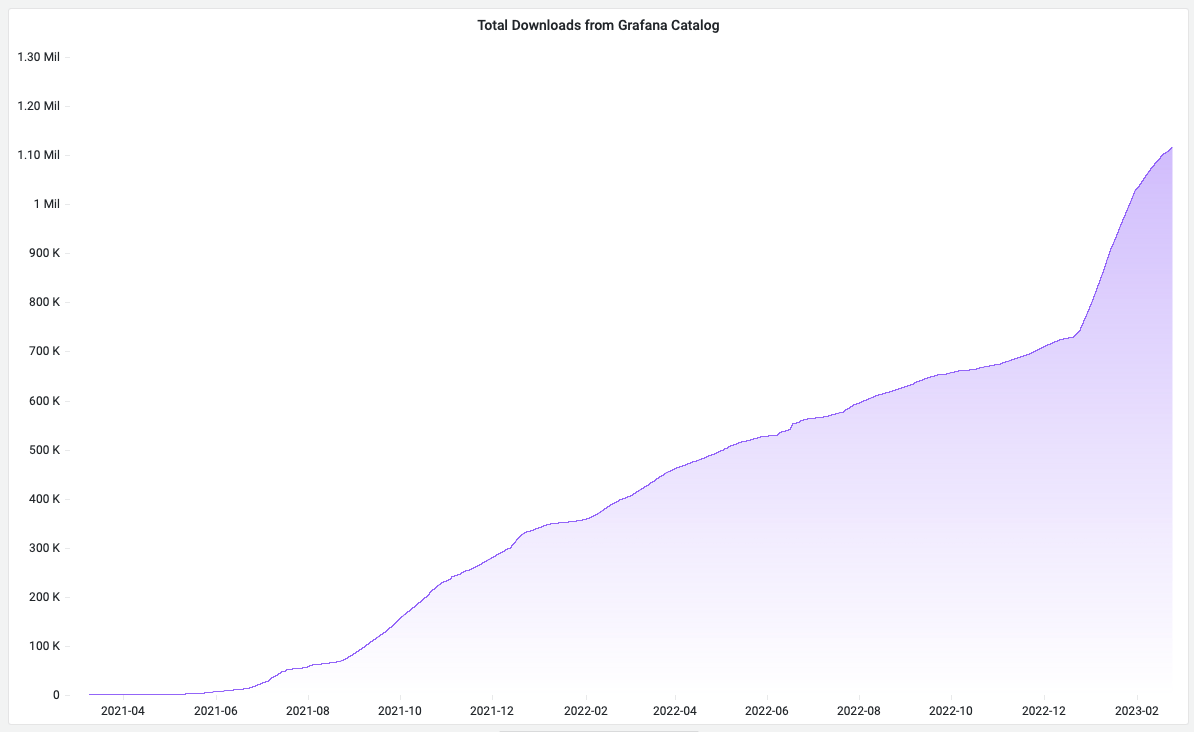
Celebrating 1 Million Downloads 🎉
The Business Calendar panel has reached an incredible milestone—over 1 million downloads in just two years! Thank you for making this plugin a go-to tool for event visualization in Grafana.
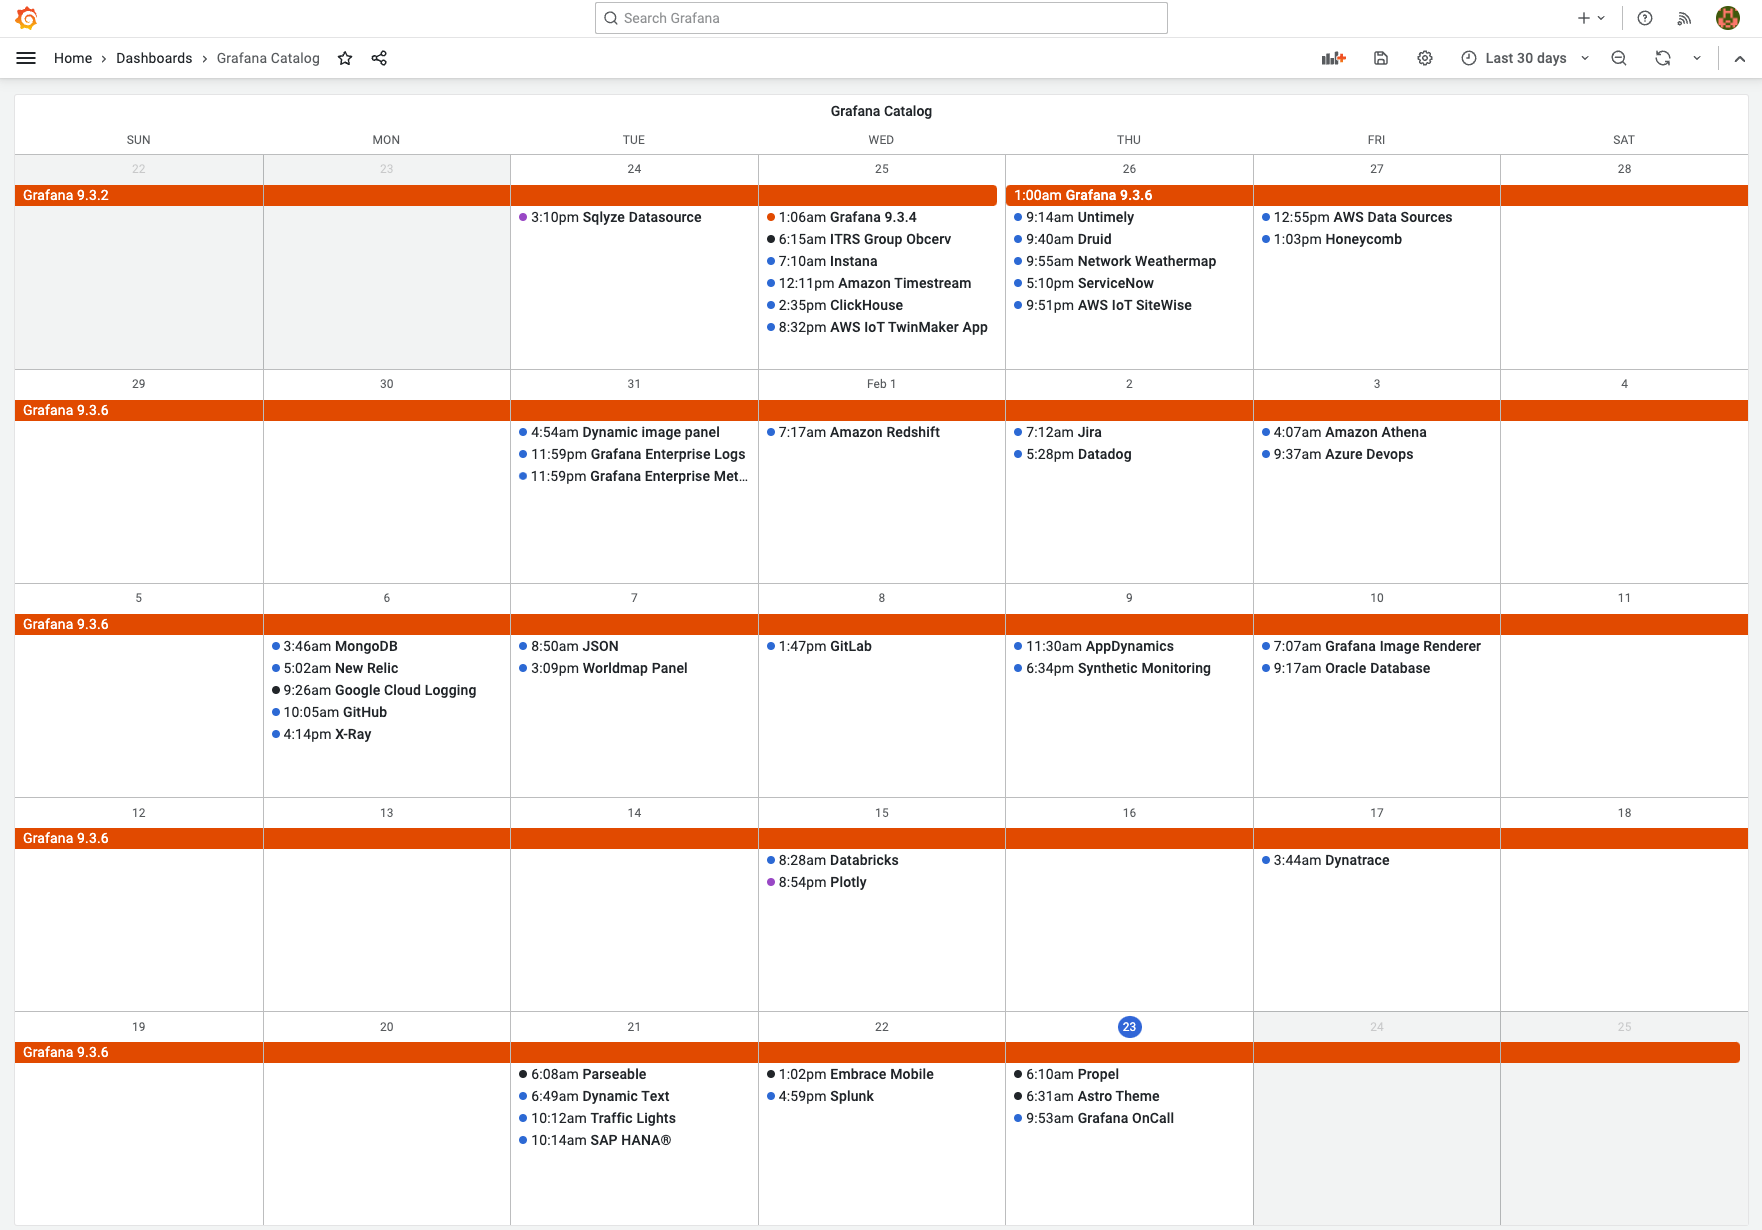
Display Events from PostgreSQL
Learn how to configure the Business Calendar panel to fetch events from a PostgreSQL database. This tutorial applies to any supported data source in Grafana.
Modernized Styles with Theme v2
We’ve upgraded from Theme v1 to v2, revamping the plugin’s appearance for a polished, user-friendly experience. The new Display Time option lets you view event times before titles, enhancing readability.
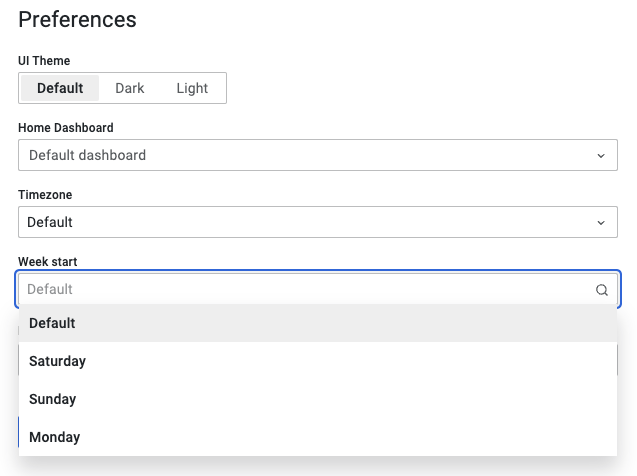
Custom Week Start
Set the first day of the week—Saturday, Sunday, or Monday—based on Grafana’s system settings or user preferences. This ensures the calendar aligns with your workflow.
Dynamic Event Coloring
One of the most requested features is here! Color events dynamically based on configured threshold ranges to highlight critical data at a glance.
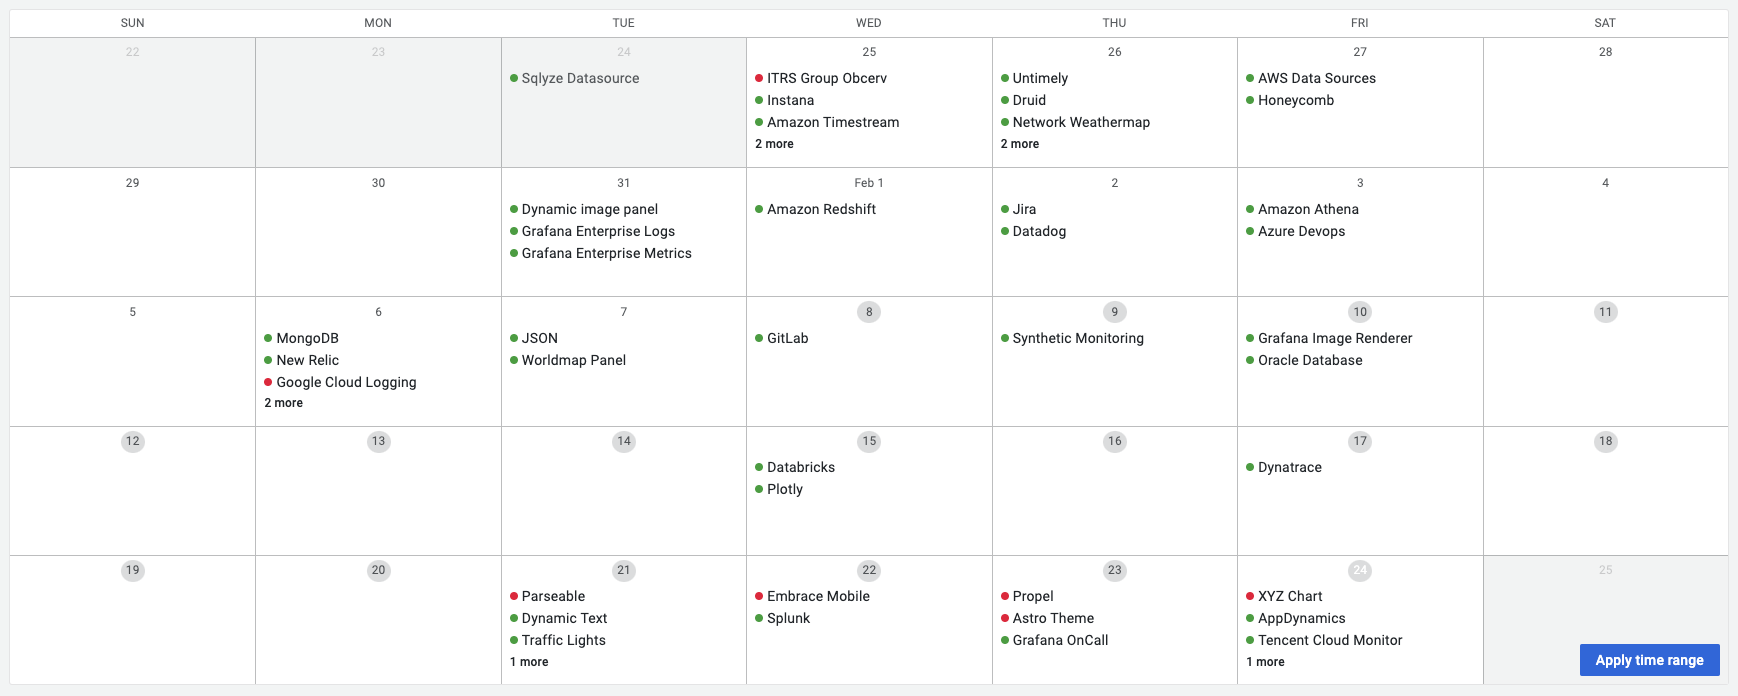
Enhanced Event Details
When events overflow a day cell, a "N more" link appears. Click it to view the full list in a sidebar. You can also click individual events to see detailed information or follow data links if the On Click option is set to Open Link.
Time Range Selection
Easily filter events by selecting a time range directly on the calendar. Click a day, hold Shift, and drag to the desired end date. Confirm by clicking Apply time range to update your view.
Getting Started
You can install the Business Calendar panel plugin from the Grafana Plugins catalog or use the Grafana command line tool.
For the latter, please use the following command:
grafana cli plugins install marcusolsson-calendar-panel
Tutorial
This video is a detailed review of all configurable options. To ensure you can follow, Daria starts with fetching publicly available Grafana plugin catalog data and then demonstrates how the Business Calendar plugin options change the panel appearance and behavior.
We have many other tutorials that you can find helpful. You can review all related to this plugin tutorials here.
Release Notes
Refactoring and style migration may introduce breaking changes. We recommend testing the update in a non-production environment before deploying to live Grafana instances.
Features & Enhancements
- Added color customization for calendar entries (#67).
- Filtered out undefined events for cleaner displays (#69, #81).
- Updated CI and release workflows for smoother development (#72).
- Ensured compatibility with Grafana 9.3.6 (#73).
- Refactored plugin options to use field pickers (#74).
- Redesigned Day and Events drawers with modern UI (#75).
- Removed panel padding for a cleaner look (#75).
- Updated day view and styling (#76).
- Migrated to Theme v2 for a modern aesthetic (#79).
- Applied Grafana system settings for week start day (#80).
- Added time display option for events (#82).
- Refreshed styles and updated screenshots (#83).
We're Always Happy to Hear From You!
We value your feedback and are eager to connect with our community and partners. Whether you have a question, an idea, or an issue to report, here’s how you can reach out:
- Community Members: Have a question, want to suggest a new feature, or found a bug? We’d love to hear from you! Please create a GitHub issue to start the conversation.
- Enterprise Partners: Need assistance or have an urgent request? Open a Zendesk ticket for a prompt and dedicated response from our team.
- Join the Conversation: Stay updated and share your thoughts! Subscribe to our YouTube Channel and leave your comments—we can’t wait to hear what you think.
Your input helps us improve, so don’t hesitate to get in touch!