Observability without Data Manipulation is a lost opportunity


It was a rainy, gloomy day. Billy had been working on a presentation for an important customer since early in the morning. He spent hours carefully inspecting all formulas and resulting calculations. The presentation looked perfect. All numbers copied from the Grafana dashboard were added up adequately. To simplify the understanding of specific slides, Billy has added several visualizations. The only little component he did not comprehend completely was the coefficient that had to be applied to all formulas. Still, he did not appear concerned since the customer, in the prior communication, confirmed it was supposed to be 0.3.
The rain outside kept up, and thunders added worrisome tunes to the late night. Yet, everything was ready. The clock showed 6 PM.
At 6:04 PM, the phone rang, and Peter, the client representative, without any excitement, said that it was a mistake. The coefficient should have always been 0.6. He expressed his hope that Billy had not started working on the deck just yet. Otherwise, Billy would have to redo everything. The rain started pouring, and the thunderclaps followed one another. After saying his goodbyes, Billy went back to his chair. The long night was ahead.
Billy had to redo everything, but not before contacting a database developer for assistance in updating the coefficient value in the database.
Billy's sole thought in the morning was how awesome it would have been if the client could have inserted a coefficient value directly into the database and triggered the recalculation of everything from the Grafana dashboard.
A new chapter
In general, data visualizations are secured against the users' interventions. However, there are times when granting access to specific database items is helpful for performance, accuracy, and convenience.
After the presentation the next day, Billy inadvertently learned about Data Manipulation panel for Grafana, which started a new chapter in his life.
Grafana is a fantastic tool for visualizing a broad spectrum of metrics. The Grafana journey began with observability. However, flexible architecture paved the road to many industrial and commercial domains that go well beyond providing system monitoring metrics.
Grafana, among other areas, is gaining popularity as a platform for software development. Many of the use cases that adopted Grafana interact directly with users. Aside from analyzing the Grafana dashboard to make informed analytical decisions, users anticipate the ability to interact with the database, enter data instantly, and have it appear on the dashboard right away.
Initially, the Grafana inventors neither provisioned such functionality nor even had it on their roadmap. Regardless, they engineered the adaptable Grafana architecture, which enables full-fledged modifications implemented with plugins utilizing all of the latest advantages of the Grafana toolkit to go above and beyond observability.
The Data Manipulation panel plugin was created in May-June of this year in response to the rapidly growing demand from the community. It is an open source project distributed under [Apache License Version 2.0].(https://github.com/volkovlabs/business-forms/blob/main/LICENSE).
Data Manipulation panel
There are various ways to install it. The easiest one is to use the Plugins Configuration menu when you are in the Grafana Plugins catalog with admin permissions. You can also download the plugin from the Grafana website or GitHub repository.
The most adventurous method, however, is to study the Data Manipulation panel plugin page. You will definitely discover a lot of useful information as well as find effective tips and techniques there.
The Data Manipulation plugin allows you to insert and update data, as well as make configuration changes, directly from your Grafana dashboard.
API Server
Data Manipulation panel requires the installation of the API server on the same server where the database runs or on a separate host.
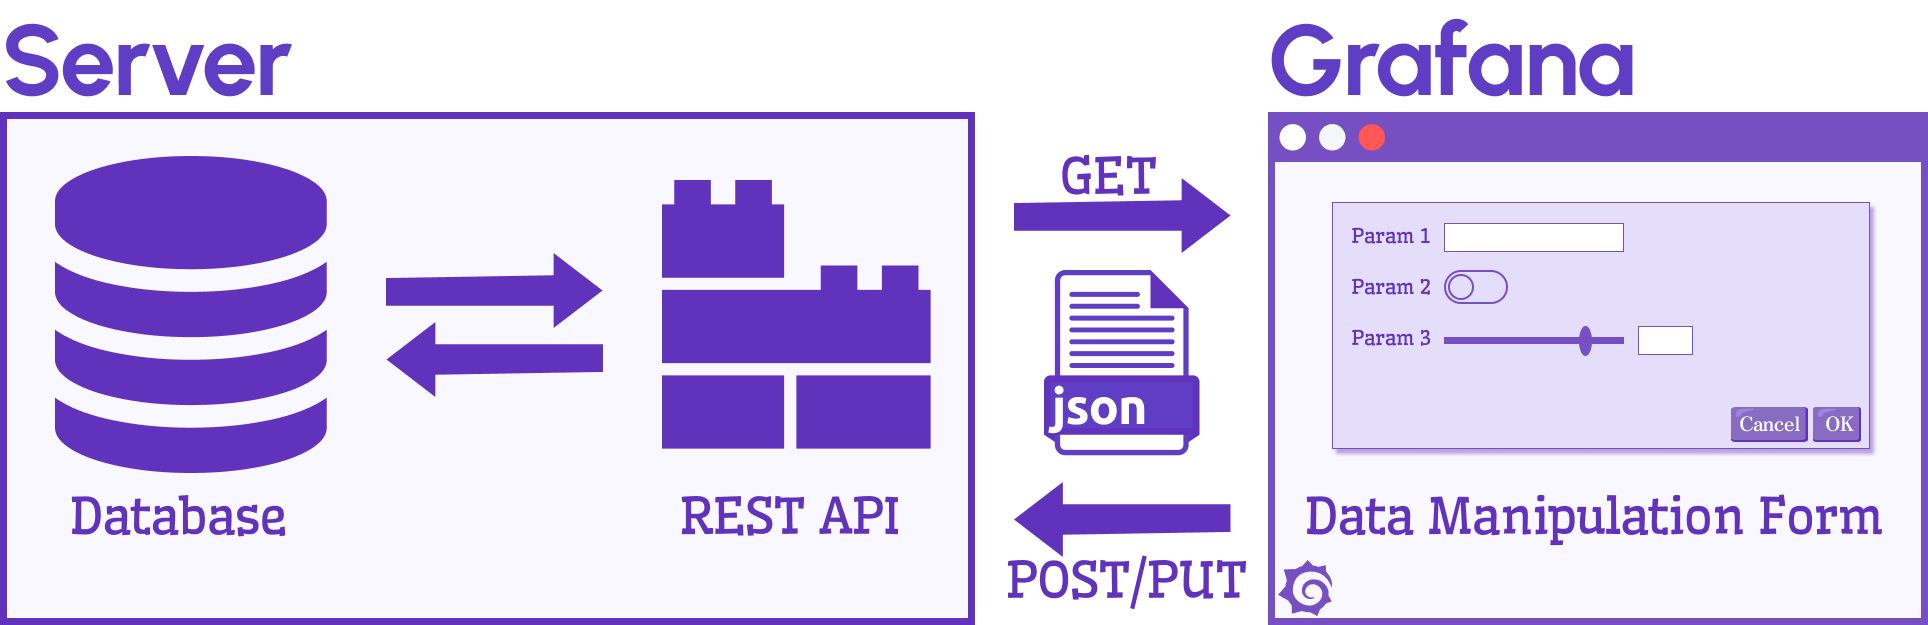
The API server is an effective approach to guarantee that only approved data operations are permitted.
PostgreSQL
Look at a simple API server, which returns submitted feedback from the PostgreSQL database.
loading...
You can find more PostgreSQL and MySQL database examples in our GitHub repository.
For an extra security layer, we recommend running Grafana behind an NGINX reverse proxy. The reverse proxy also lets you provision additional API endpoints and static files within the same domain, making them CORS-compliant. It is described in How to Connect the Data Manipulation Plugin for Grafana to API Server.
Static and Dynamic forms
Business Forms panel, like Grafana itself, was designed to embrace flexibility. You can get started with static forms and progress to dynamic ones.
- A static form is hard-coded and constructed just once.
- A dynamic form can be generated on the fly from a data source (such as a database or a CSV file) based on rules and parameters.
For instance, your application may display different forms depending on the logged-in user, time of the day, IP address, and so on.
const feedback = context.panel.data.series.find(
  (serie) => serie.refId === "Feedback"
);
const typeOptions = context.panel.data.series.find(
  (serie) => serie.refId === "Types"
);

if (feedback?.fields.length) {
  const ids =
    feedback.fields.find((f) => f.name === "id").values.buffer ||
    feedback.fields.find((f) => f.name === "id").values;
  const titles =
    feedback.fields.find((f) => f.name === "title").values.buffer ||
    feedback.fields.find((f) => f.name === "title").values;
  const types =
    feedback.fields.find((f) => f.name === "type").values.buffer ||
    feedback.fields.find((f) => f.name === "type").values;

  /**
   * Set Elements
   */
  const elements = ids.map((id, index) => {
    return { id, title: titles[index], type: types[index] };
  });

  /**
   * Find Type element
   */
  const typeSelect = elements.find((element) => element.id === "type");
  if (typeSelect && typeOptions?.fields.length) {
    const labels =
      typeOptions.fields.find((f) => f.name === "label").values.buffer ||
      typeOptions.fields.find((f) => f.name === "label").values;
    const values =
      typeOptions.fields.find((f) => f.name === "value").values.buffer ||
      typeOptions.fields.find((f) => f.name === "value").values;

    /**
     * Update Types
     */
    typeSelect.options = labels.map((label, index) => {
      return { label, value: values[index] };
    });
  }

  /**
   * Update Panel Options
   */
  context.panel.onOptionsChange({ ...context.panel.options, elements });
}
Business Forms panel is a brand-new Grafana plugin. It is the first plugin that allows you to insert and update application data, as well as modify settings, straight from your Grafana dashboard. You can find more details about it in our product documentation.
Any suggestions and ideas are greatly appreciated. Please feel free to challenge us with your questions. They help us deliver the top-notch product!