Keep up with the most recent news while working in Grafana


When you open Grafana, what is the first panel you see? It's most likely the News panel on the Home dashboard, which contains the most recent blog entries from the Grafana team and community. The News panel directly loads the RSS feed into the browser, and while it works for some feeds, it has numerous restrictions.
Looking around, we discovered several open conversations and issues related to updating the News panel or creating an RSS and Atom data source. The question is, how to display data from such data sources? Time series or table panels are not appropriate alternatives for displaying news in a custom layout.
You can find a video version of this post on our YouTube channel.
An RSS data source was implemented with the recently released Data Source Template. This template is similar to the panel plugin template introduced in the previous articles. Business News Data Source retrieves a feed and returns data frames to display news in the Business Text panel or other custom panels.
Data source plugin
Data source plugins can communicate with external data sources and return the data in a format that Grafana can understand. You can immediately display the data in any of your current dashboards by adding a data source plugin.
The Grafana Plugins catalog now lists 120 data source plugins, 22 of which were added this year. There are several questions you need to address when thinking about developing a new data source plugin:
- Is it possible to retrieve the data via the HTTP(S) protocol?
- Does a standard HTTP(S) application backend meet your requirements and provide all necessary options for authentication?
- Does the data source need support for alerting?
The HTTP(S) protocol can be used to read RSS and Atom feeds, and in most circumstances, no authentication is required. Authentication can be introduced in a future release, and the default authentication options in the HTTP(S) backend should be sufficient.
We decided to develop the Business News data source without the backend using our data source plugin template. Similar to the panel plugin template, this template comes preconfigured with Docker Compose, initial provisioning, and continuous integration with test coverage settings.
Add Data Source
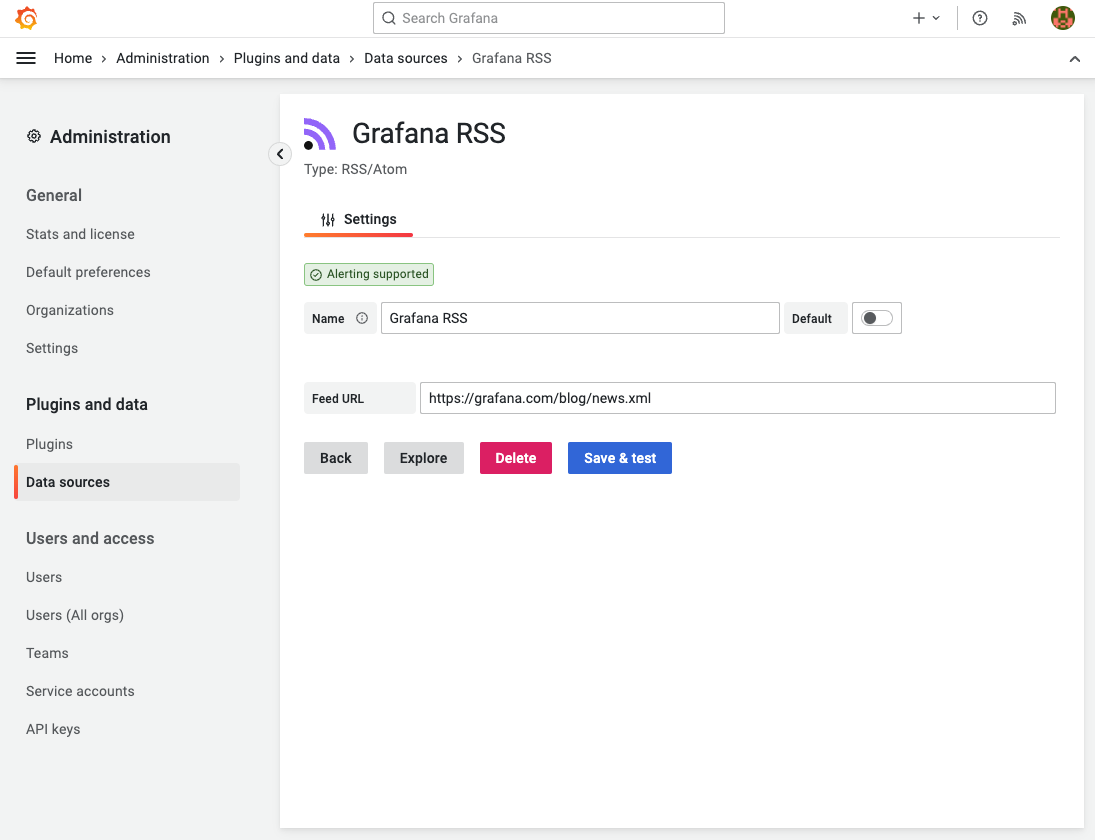
Let's add a new Business News data source to the Grafana blog and create a panel to display the latest news similar to the News panel plugin.
You can add the Business News data source manually in the Data Sources Configuration menu or provision it through configuration files.
datasources:
  - name: Volkov Labs RSS
    type: volkovlabs-rss-datasource
    access: proxy
    isDefault: true
    orgId: 1
    version: 1
    editable: true
    jsonData:
      feed: https://volkovlabs.io/blog/rss.xml
  - name: AWS CloudFront RSS
    type: volkovlabs-rss-datasource
    access: proxy
    orgId: 1
    version: 1
    editable: true
    jsonData:
      feed: https://status.aws.amazon.com/rss/cloudfront.rss
  - name: Grafana RSS
    type: volkovlabs-rss-datasource
    access: proxy
    orgId: 1
    version: 1
    editable: true
    jsonData:
      feed: https://grafana.com/blog/news.xml
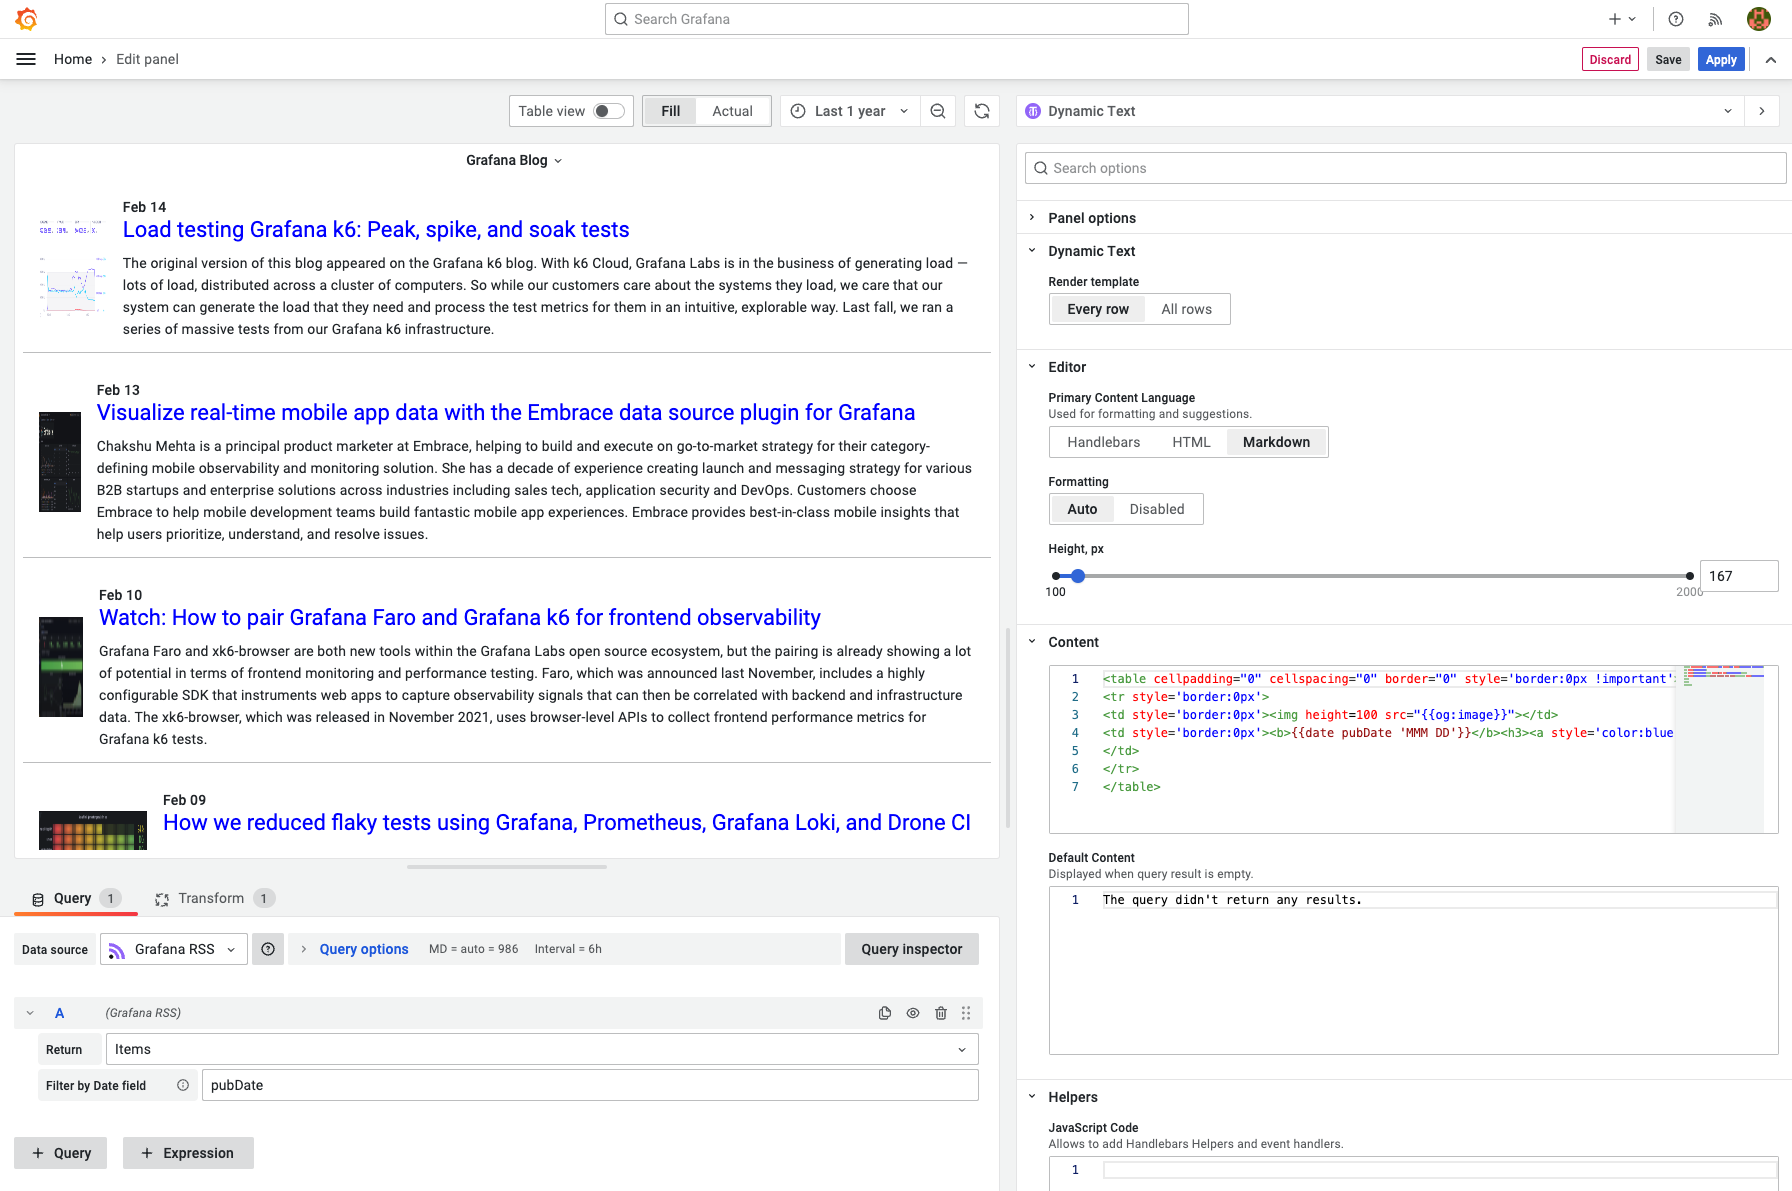
Business Text panel
The next step is to add a Business Text panel on the dashboard and set content with Markdown, HTML, and Handlebars.
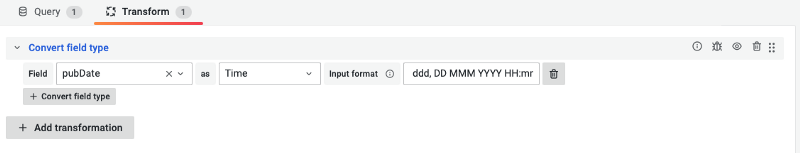
To correctly display the date, it should be of the Time type. All fields returned by the data source should be of the String type and can be transformed by converting a field type with a specified input format to Time or Number.
Here is the content of the panel to imitate the look of the News panel:
<table cellpadding="0" cellspacing="0" border="0" style="border: 0">
  <tr style="border: 0">
    <td style="border: 0"><img height="100" src="{{og:image}}" /></td>
    <td style="border: 0">
      <b>{{date pubDate 'MMM DD'}}</b>
      <h3>
        <a style="color: blue" target="_blank" href="{{link}}">{{title}}</a>
      </h3>
      {{description}}
    </td>
  </tr>
</table>
You can find more information about the Business Text panel plugin and various helpers in our documentation.
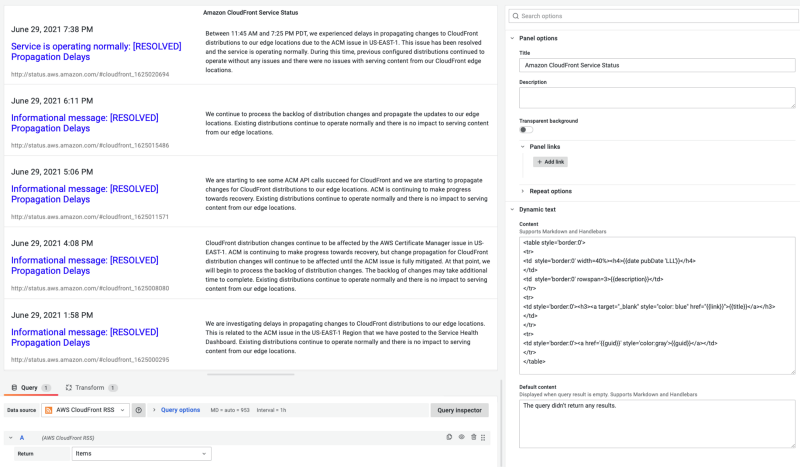
AWS feed
If AWS experiences an unexpected outage, you can track the status directly on your Grafana dashboard.
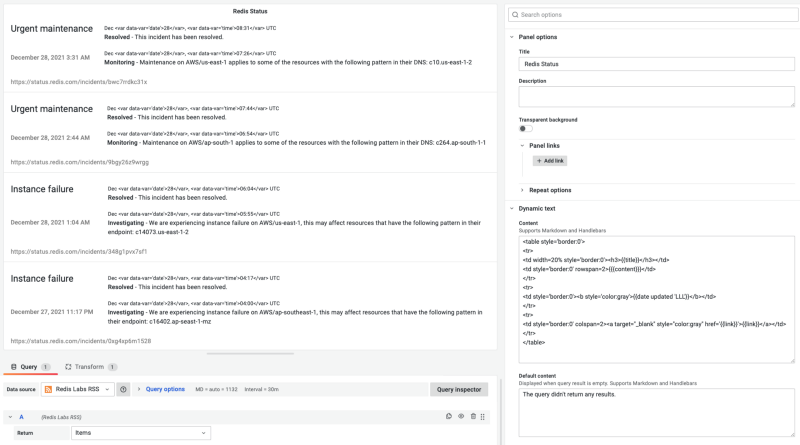
Redis Status page
The Redis Status page is based on the Atom format and can be displayed using this data source.
Using the Business News data source, you can combine your system and application metrics with newsfeeds from AWS, Redis, and other providers to stay up to date on any issues on their side.
We're Always Happy to Hear From You!
We value your feedback and are eager to connect with our community and partners. Whether you have a question, an idea, or an issue to report, here’s how you can reach out:
- Community Members: Have a question, want to suggest a new feature, or found a bug? We’d love to hear from you! Please create a GitHub issue to start the conversation.
- Enterprise Partners: Need assistance or have an urgent request? Open a Zendesk ticket for a prompt and dedicated response from our team.
- Join the Conversation: Stay updated and share your thoughts! Subscribe to our YouTube Channel and leave your comments—we can’t wait to hear what you think.
Your input helps us improve, so don’t hesitate to get in touch!