How to customize Grafana 11.1.0

Customization in Grafana has been discussed previously in our blog. Still, as time passes, new Grafana releases see the dawn of day and bring many changes along with them, and we are ready for a refresher.
In this post, you will find a vast collection of various commands that intend to help you adjust Grafana as an application according to your style and requirements.
In the end, I reference the docker file that we use in many of our projects to give you a better understanding of how we do it.
I tried to include everything related to the subject without referencing the previously published information. That, however, unavoidably means some material re-iteration. So, if you are familiar with a prior version of this material, do not be surprised by repetition.
Customization
I need to start by saying that there is no one straightforward way for Grafana customization. Once you choose that path, you will have to carefully adjust with each new release. But always keep in mind the end goal, and I am sure you would agree, it is all worth it.
To bring some clarity and order to customization, I categorized all commands into four groups:
- Configuration - working with Grafana parameters and environment variables.
- Cleaning - removing unnecessary files.
- Visual - replacing image files.
- Hands-on - working directly with JavaScript and HTML files to replace certain parts before rendering.
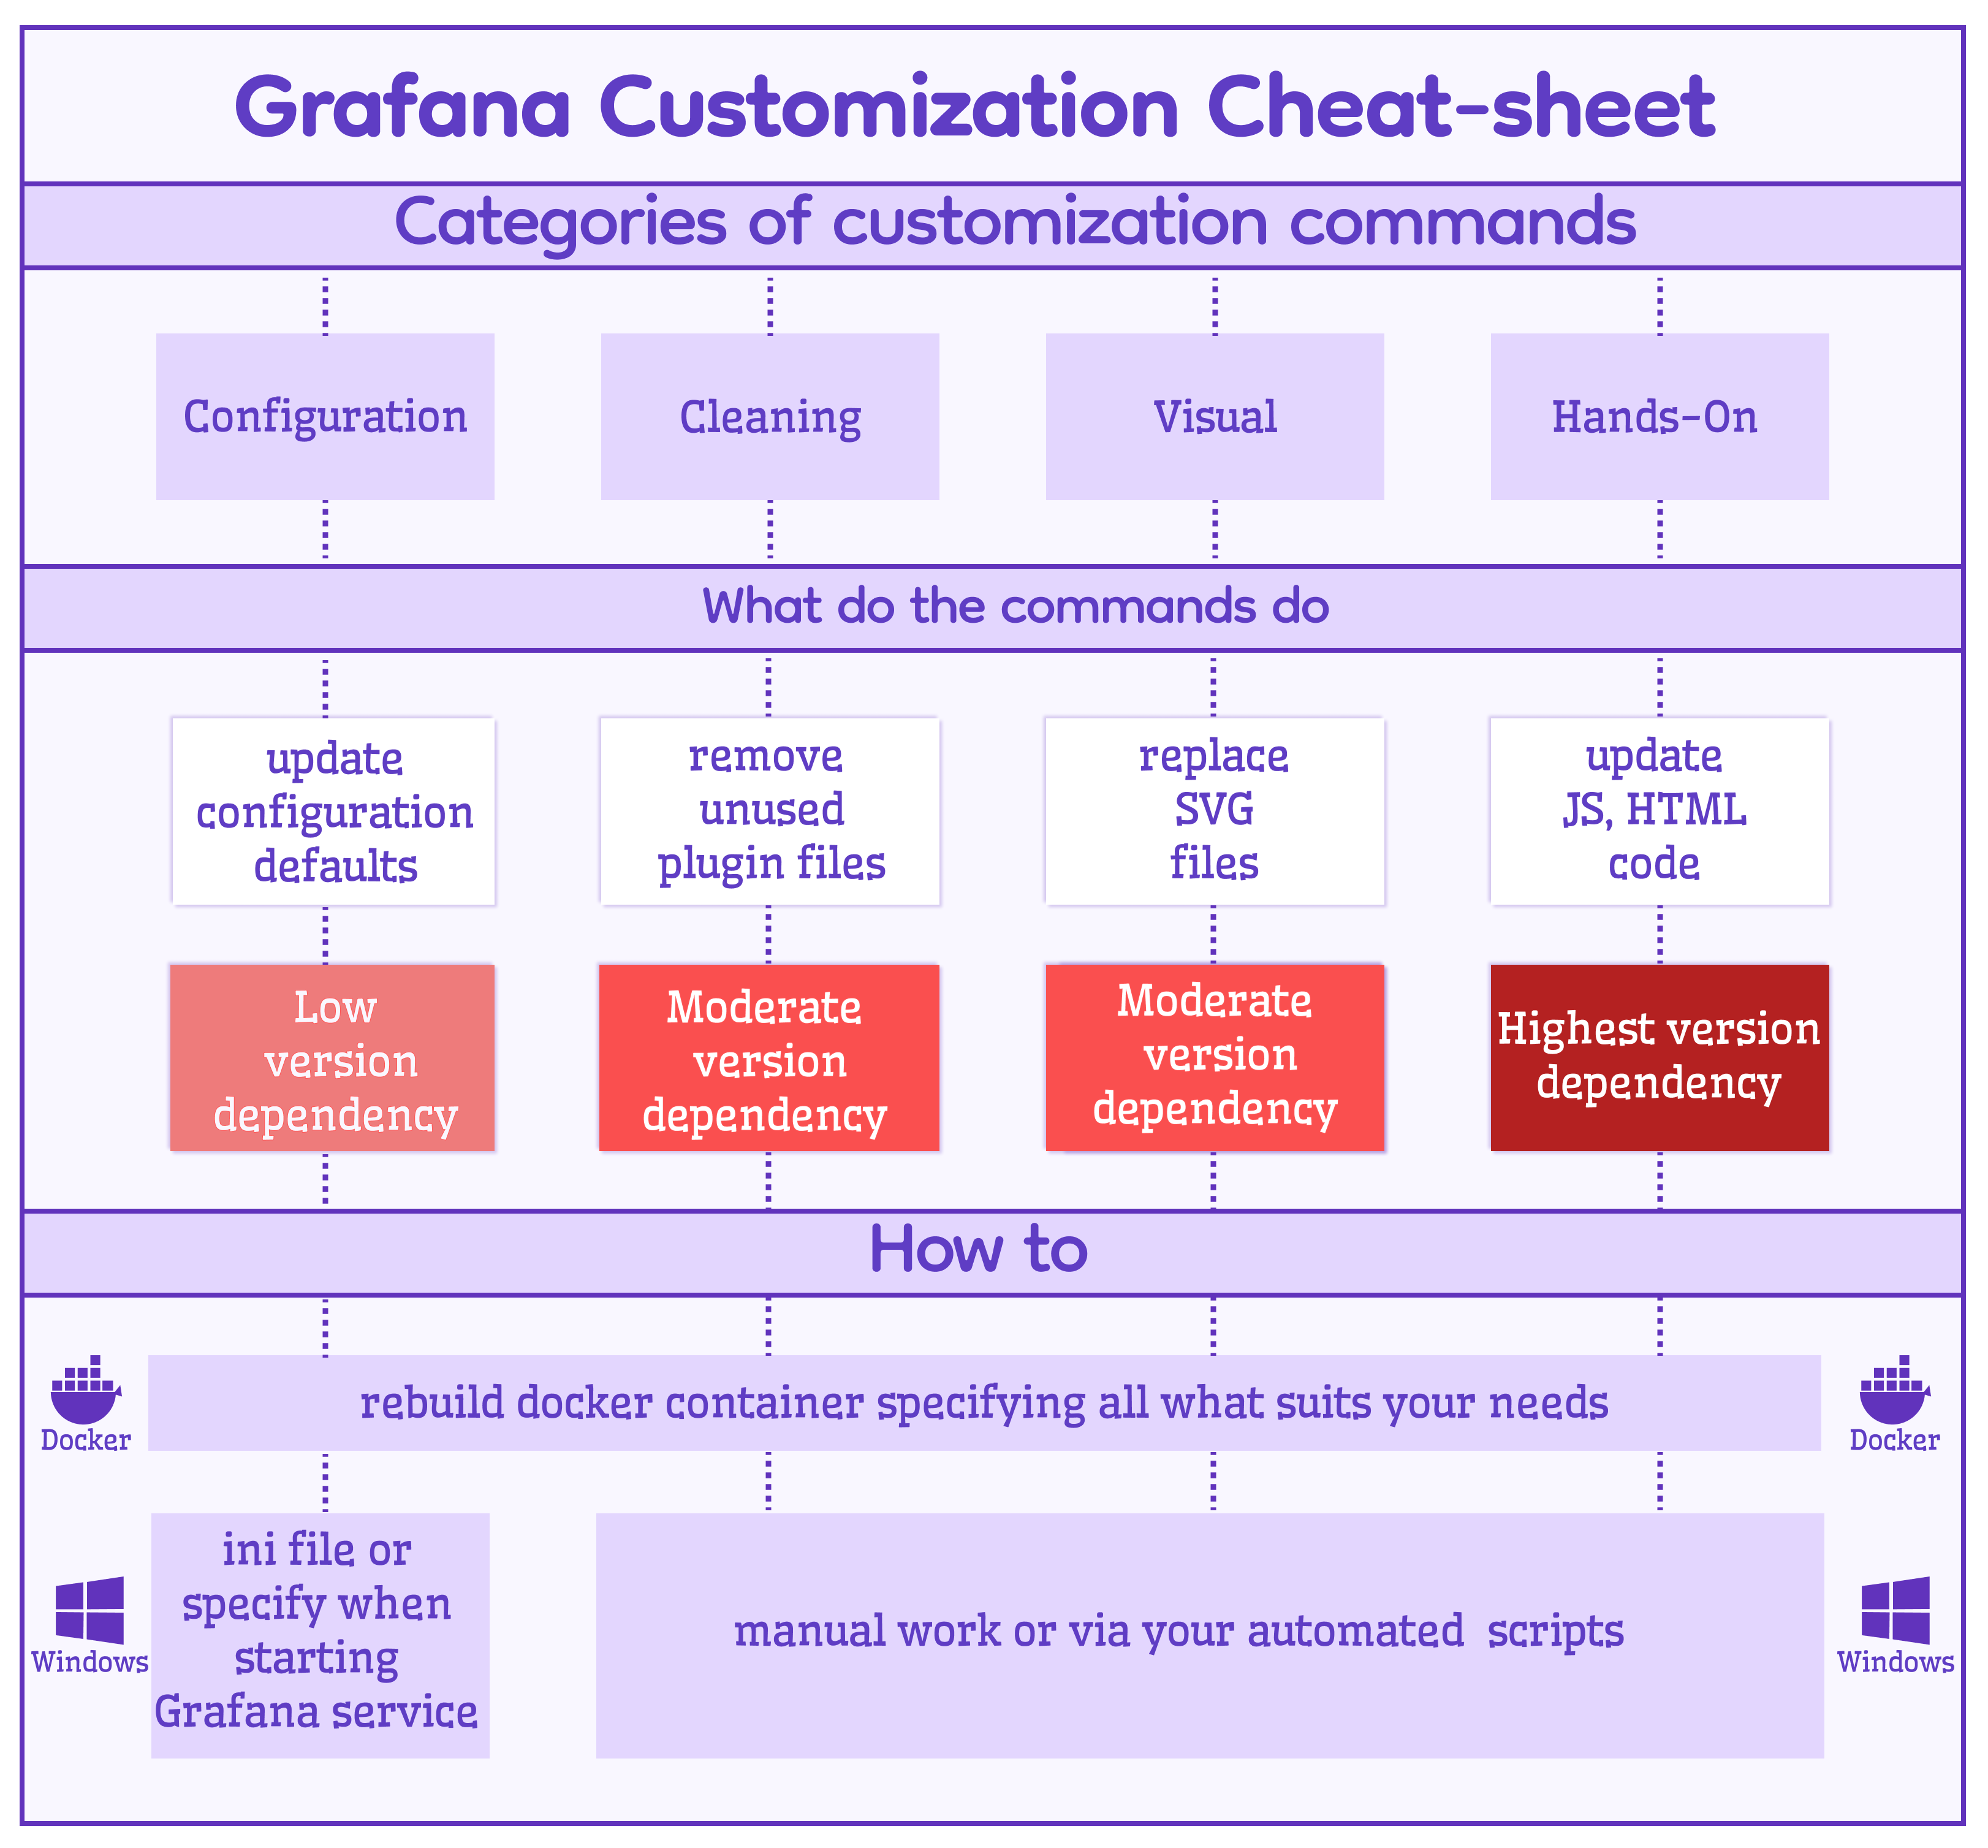
Note, that version dependency differs between the customization groups.
Configuration
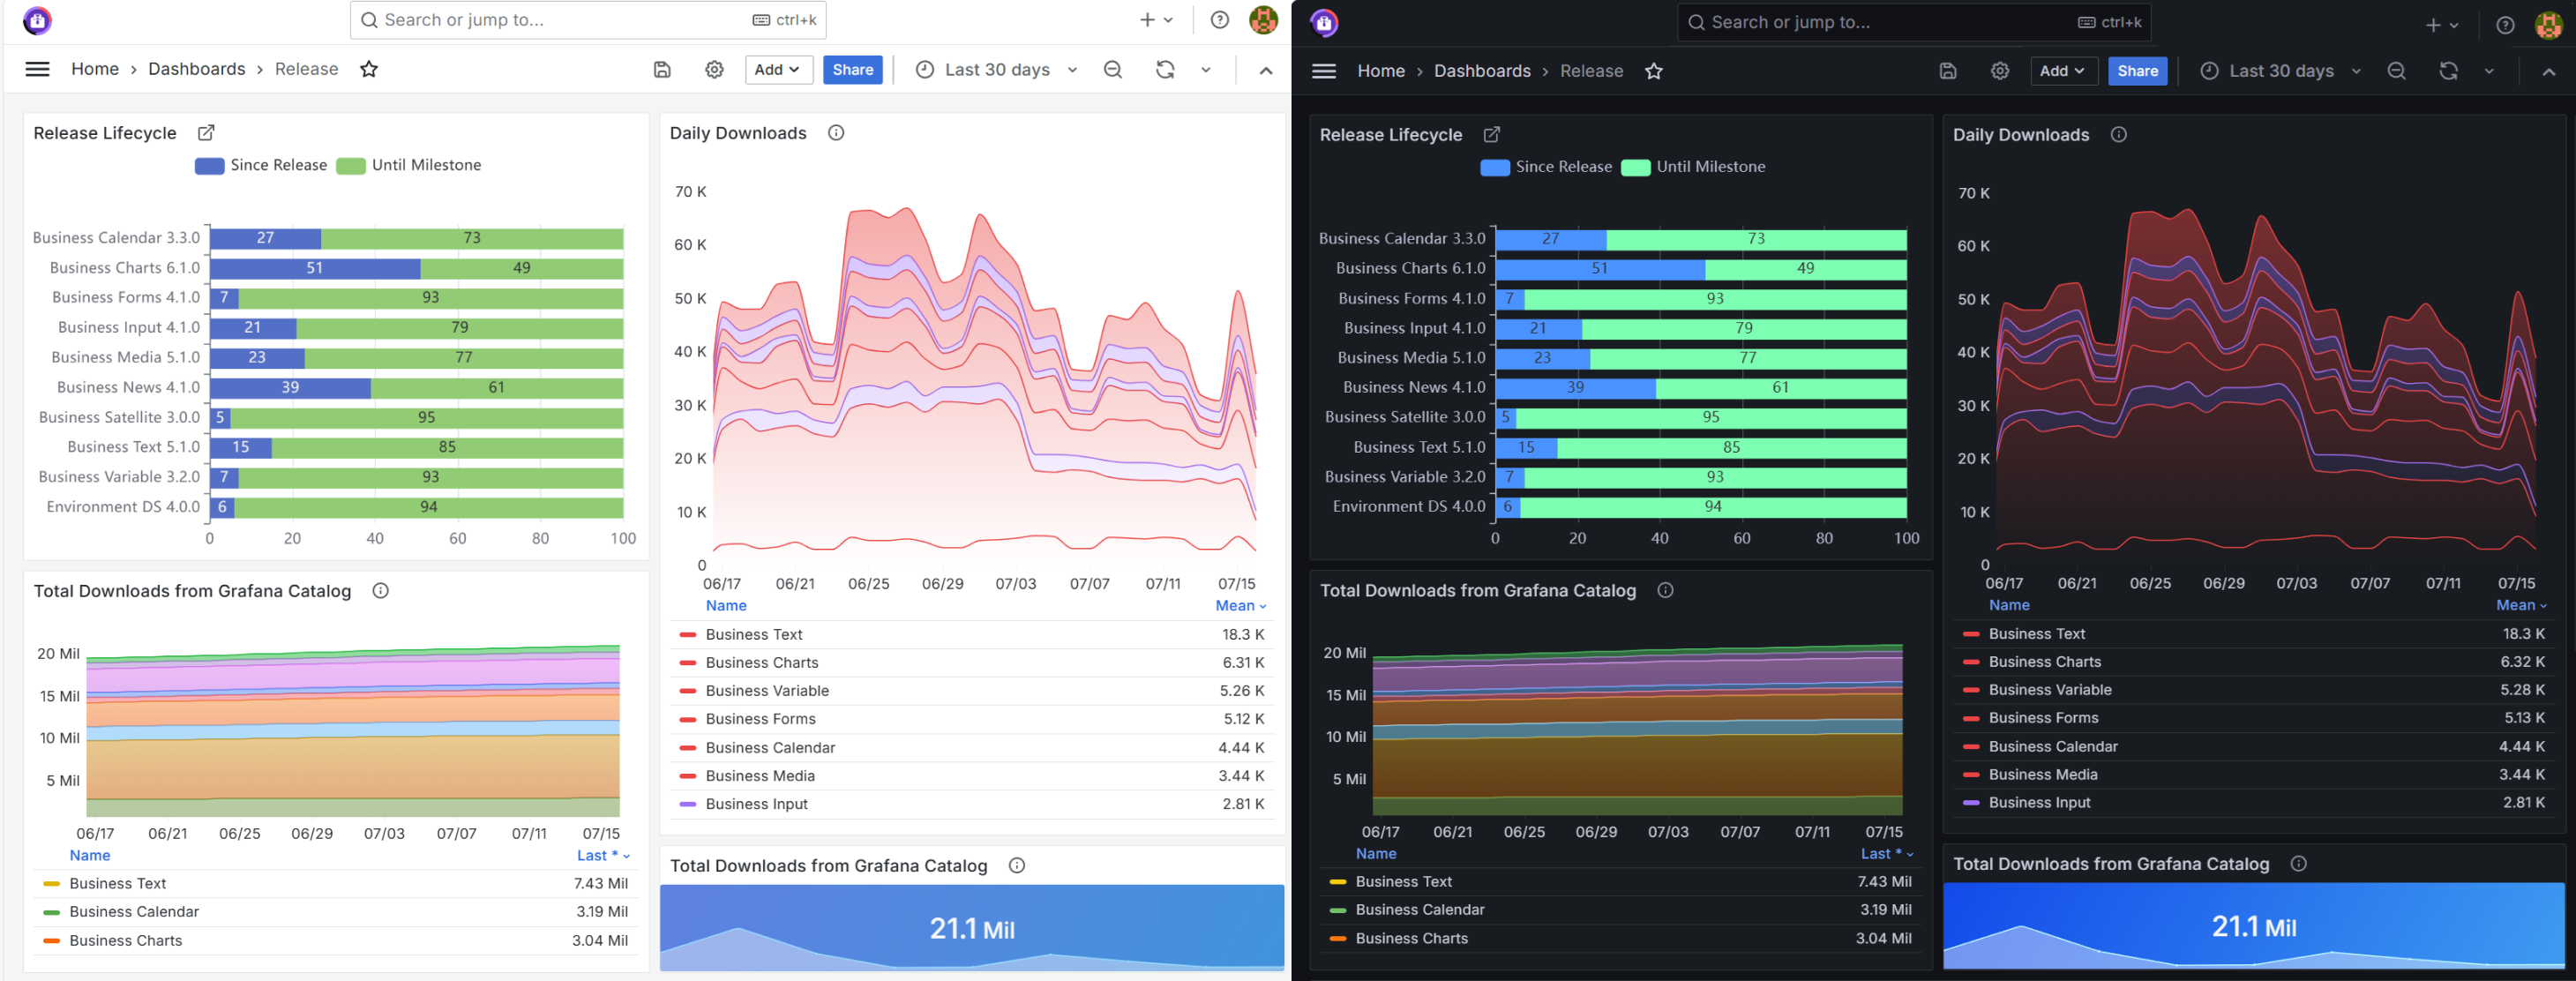
Default theme
Users have UI access to some of the Grafana configuration settings. The default theme is one of them.
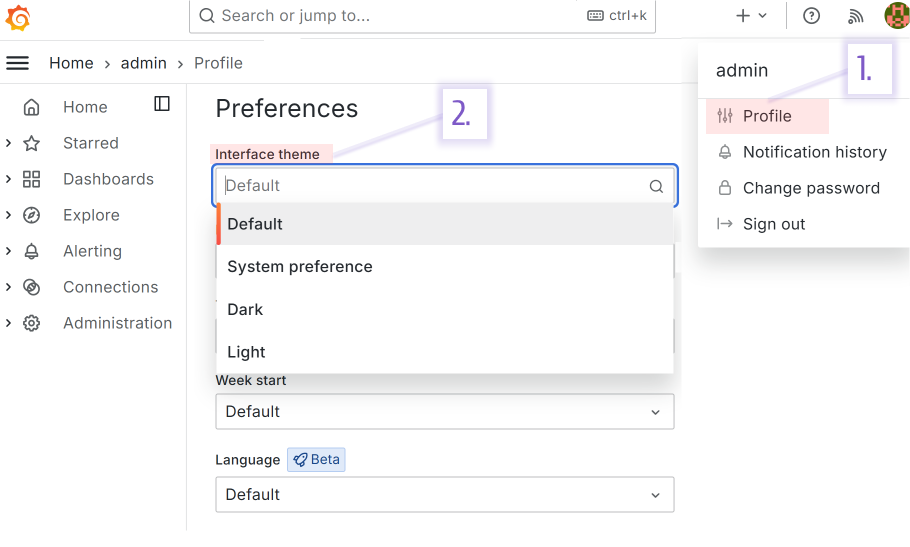
Grafana started with dark colors, as it is believed those suit better the observability purpose. The Light option was introduced in version 7 and became equally famous as the Dark one.
You can make the UI style coherent by specifying the default theme for the whole Docker container by clearly assigning a value to the following environment variable.
ENV GF_USERS_DEFAULT_THEME=light
Sanitize HTML
HTML sanitizing is enabled by default. If you need to use the actionable HTML tags (such as button, script, etc.), set the below to true.
ENV GF_PANELS_DISABLE_SANITIZE_HTML=true
As a side note, HTML sanitizing is one of the major settings for the Business Text plugin. Look at the rendering order schema for users for more details.
Home Dashboard
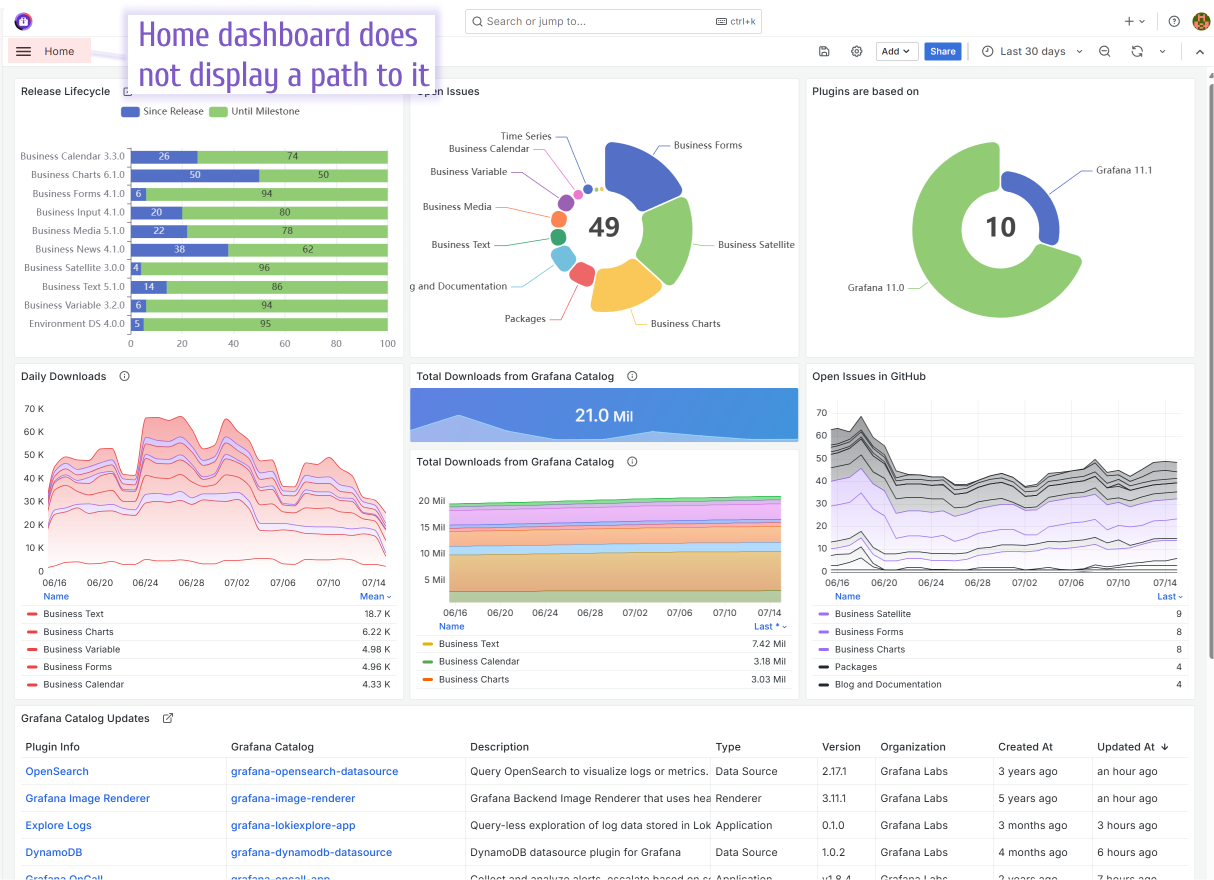
To set the dashboard of your choice as a Home dashboard, you would need to replace the default.json file located in ../usr/share/grafana/public/dashboards/default.json with the file containing your JSON code.
You can do so by running the following command.
COPY dashboards/home.json /usr/share/grafana/public/dashboards/default.json
If the dashboard is ever modified, the Docker container has to be rebuilt with a new JSON file.
If your dashboard is a part of the Application plugin, you can override the environment variable to specify a new file.
ENV GF_DASHBOARDS_DEFAULT_HOME_DASHBOARD_PATH=/var/lib/grafana/plugins/volkovlabs-app/dashboards/supervisor.json
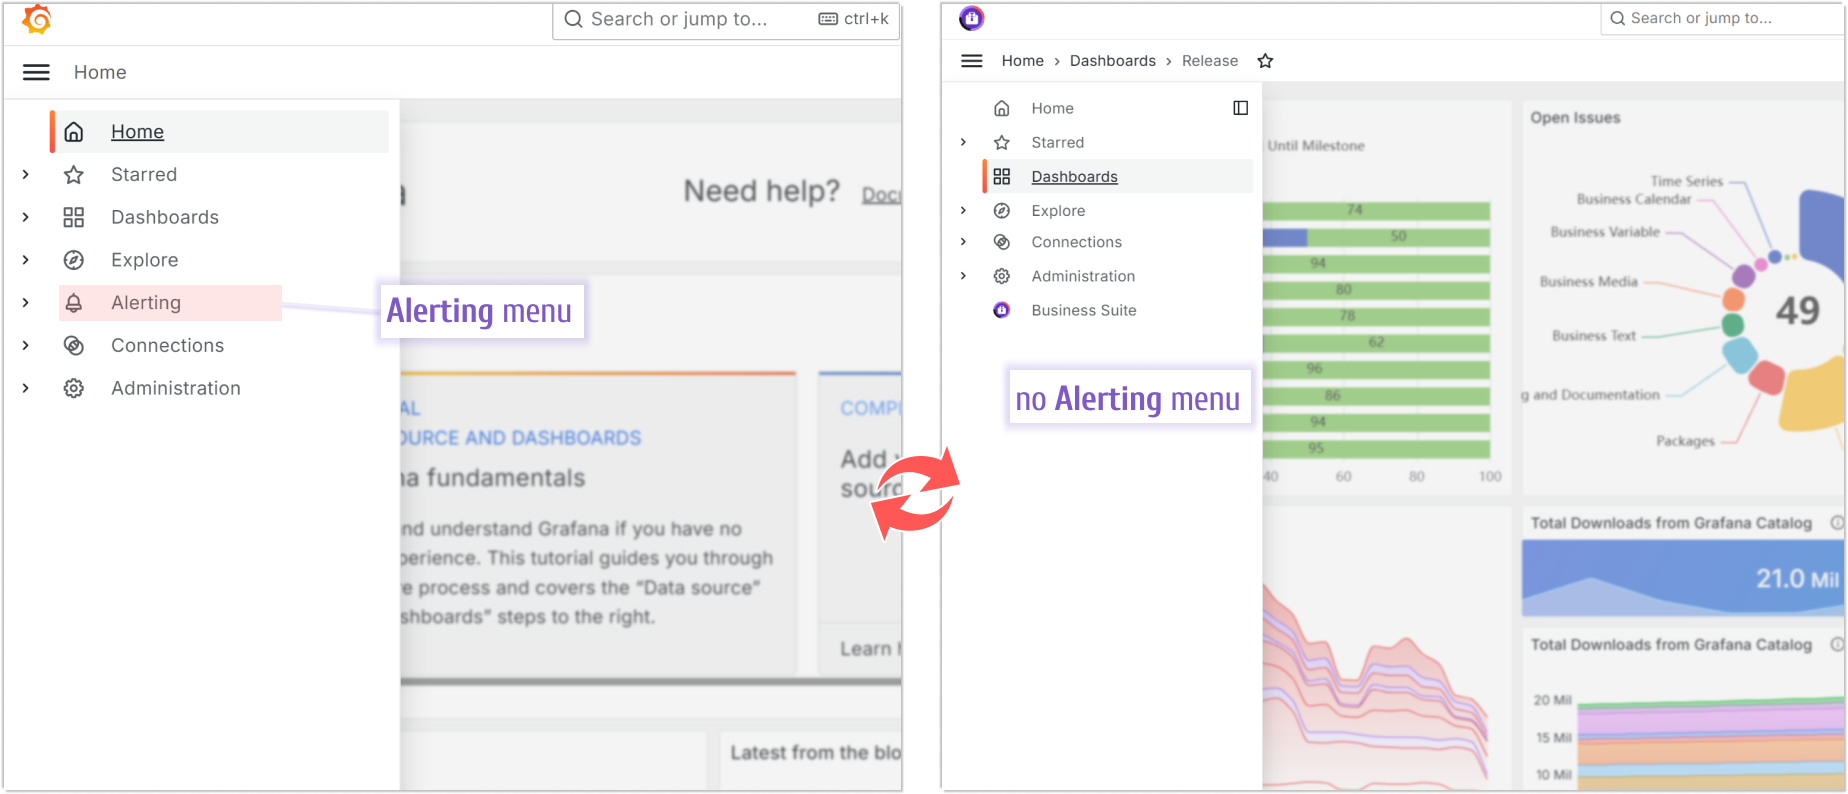
Disable Alerting and Explore
More and more applications are being built to utilize Grafana as a platform for data visualization. Those applications do not require Alerting or Explore components.
To simplify your Grafana interface, consider disabling those features by including the following environment variables.
# Explore
ENV GF_EXPLORE_ENABLED=false

# Alerting
ENV GF_ALERTING_ENABLED=false
ENV GF_UNIFIED_ALERTING_ENABLED=false
Anonymous Authentication
In some cases, you might need to remove the login page completely and make a dashboard available for the public. For that, you would need to allow Anonymous access.
ENV GF_AUTH_ANONYMOUS_ENABLED=true
ENV GF_AUTH_BASIC_ENABLED=false
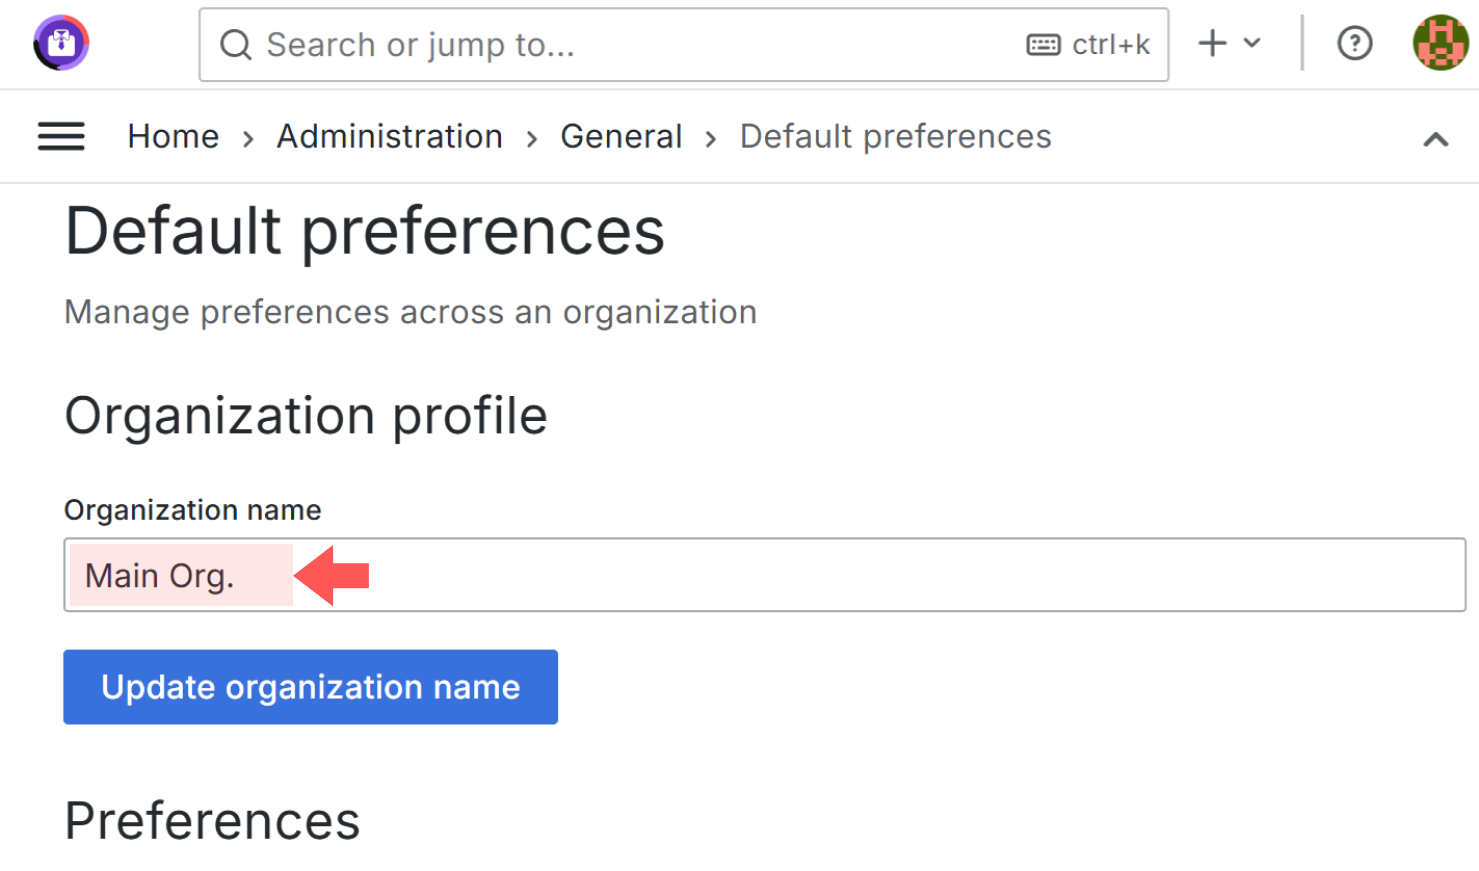
Main Organization
To update the name of the Main Organization, update the binary file grafana-server. The new name should be exactly 9 letters to avoid memory issues.
RUN sed -i 's|Main Org.|AwsomeOrg|g' /usr/share/grafana/bin/grafana-server
Visual
For any command from the Visual group, you need to start by creating an SVG or PNG file to replace its default analog.
Bookmark Icon (Favicon)
The favicon is the icon next to the application title on the browser tab.
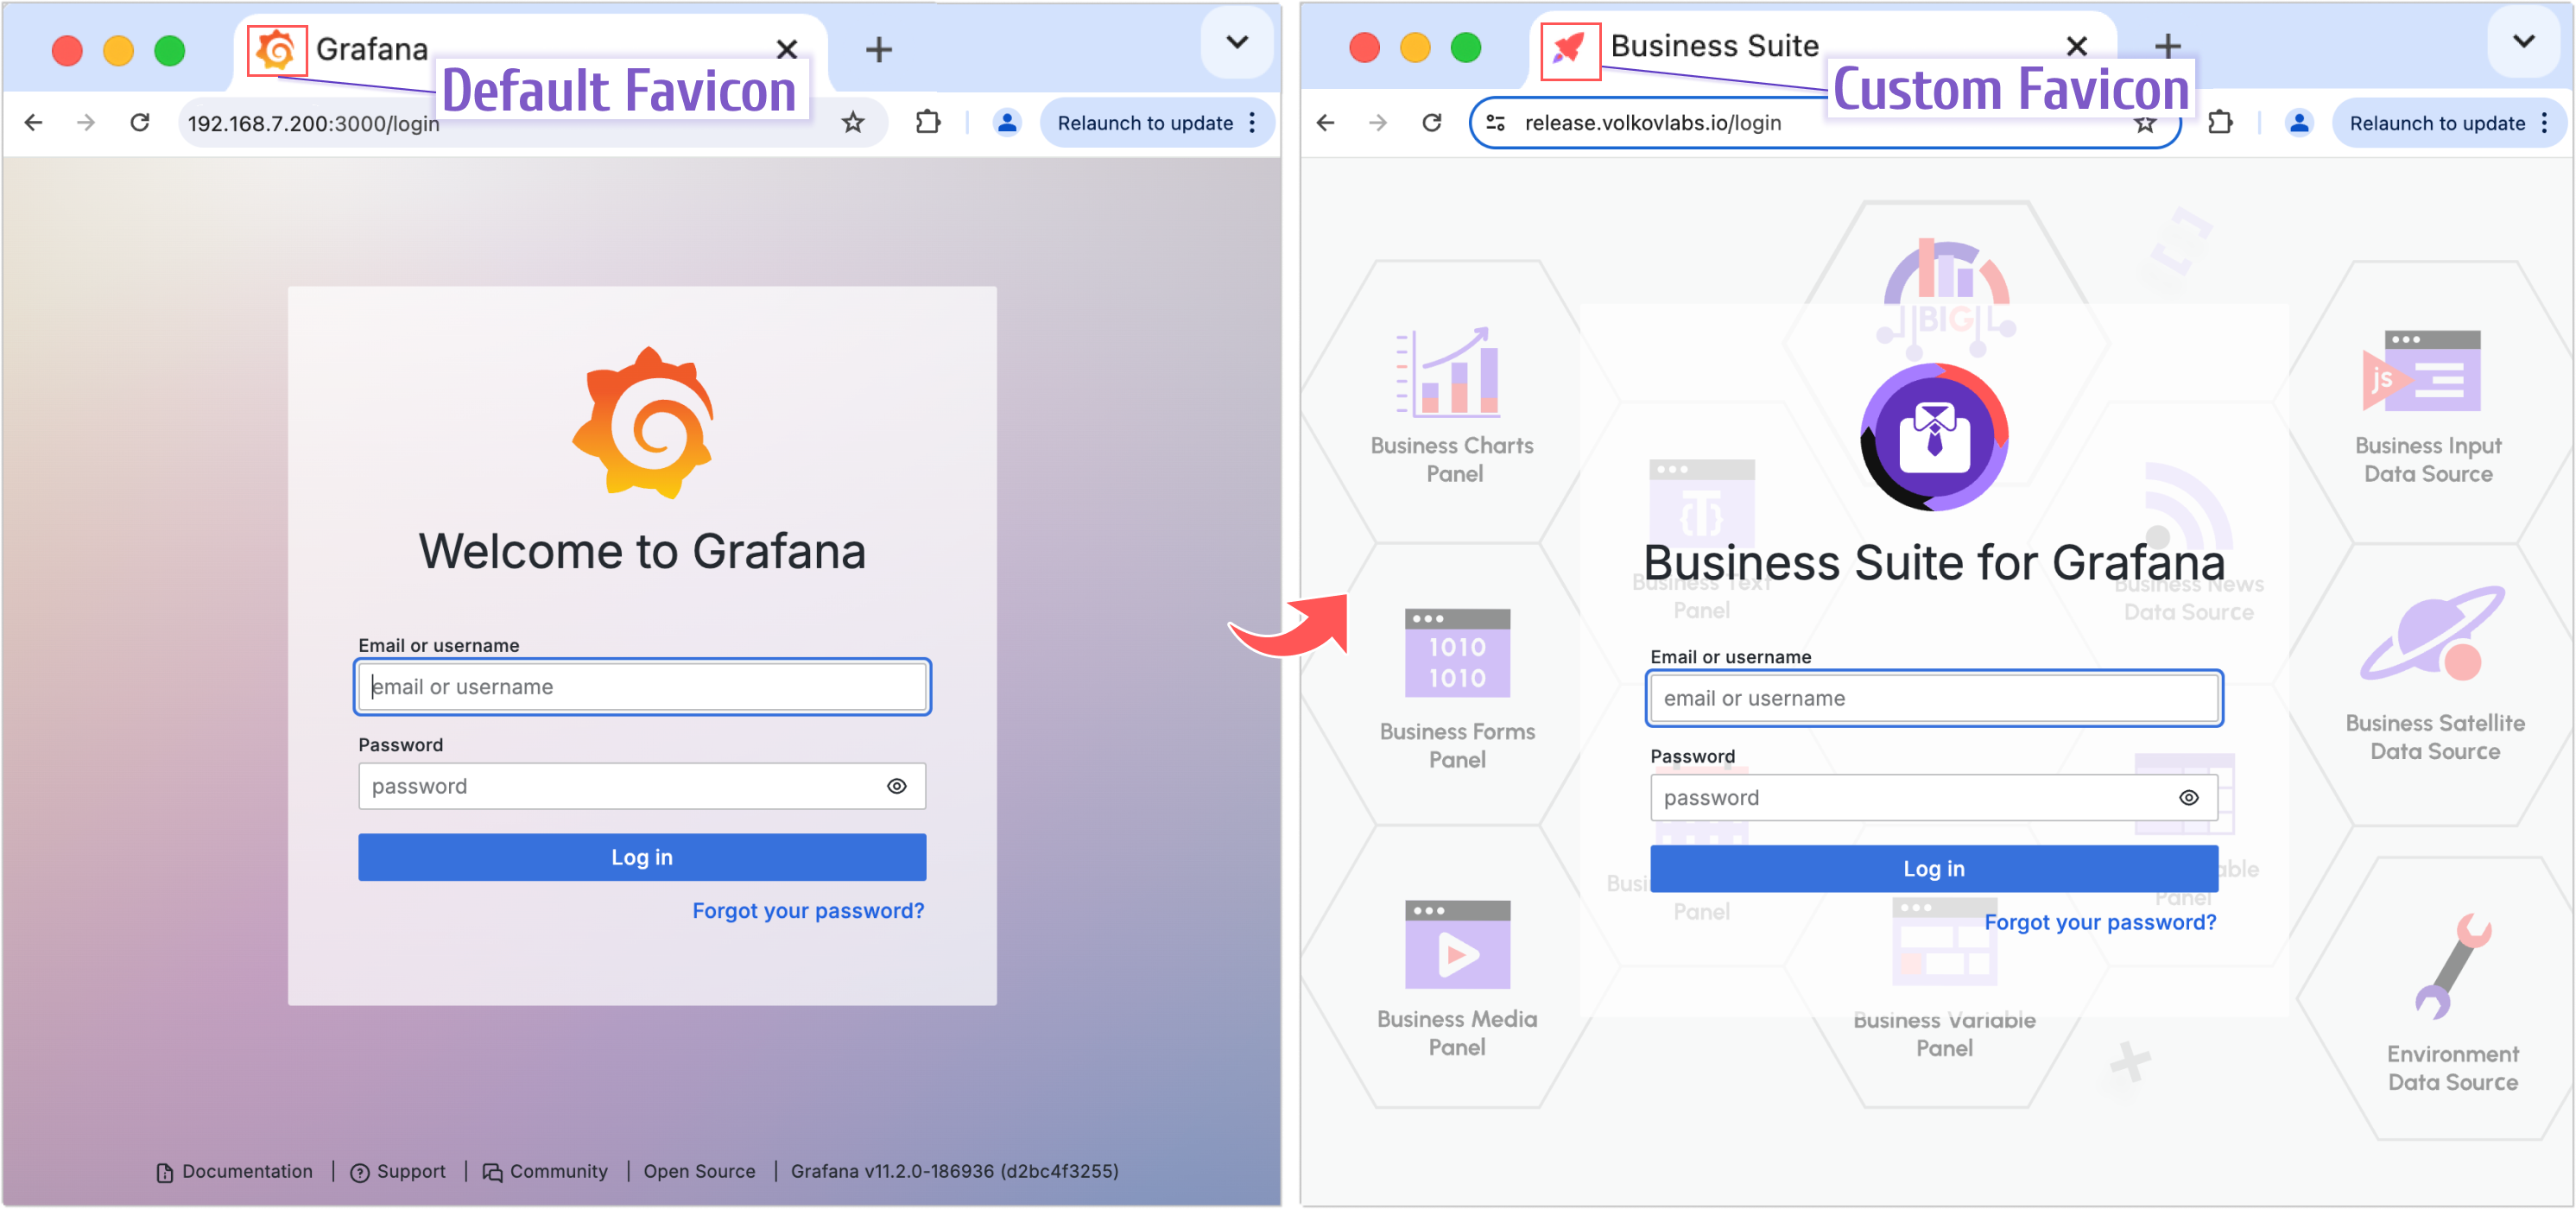
To have your own, you can replace fav32.png and apple-touch-icon.png with the images of your choice.
Use the following command for that.
COPY img/fav32.png /usr/share/grafana/public/img/fav32.png
COPY img/fav32.png /usr/share/grafana/public/img/apple-touch-icon.png
Logo
The logo on the Login page is the first graphical element that users want to change.
The big Grafana icon, the first image that draws users' attention when they open the application, can be customized by substituting the grafana_icon.svg file located in ../usr/share/grafana/public/img/.
COPY img/logo.svg /usr/share/grafana/public/img/grafana_icon.svg
Login Background
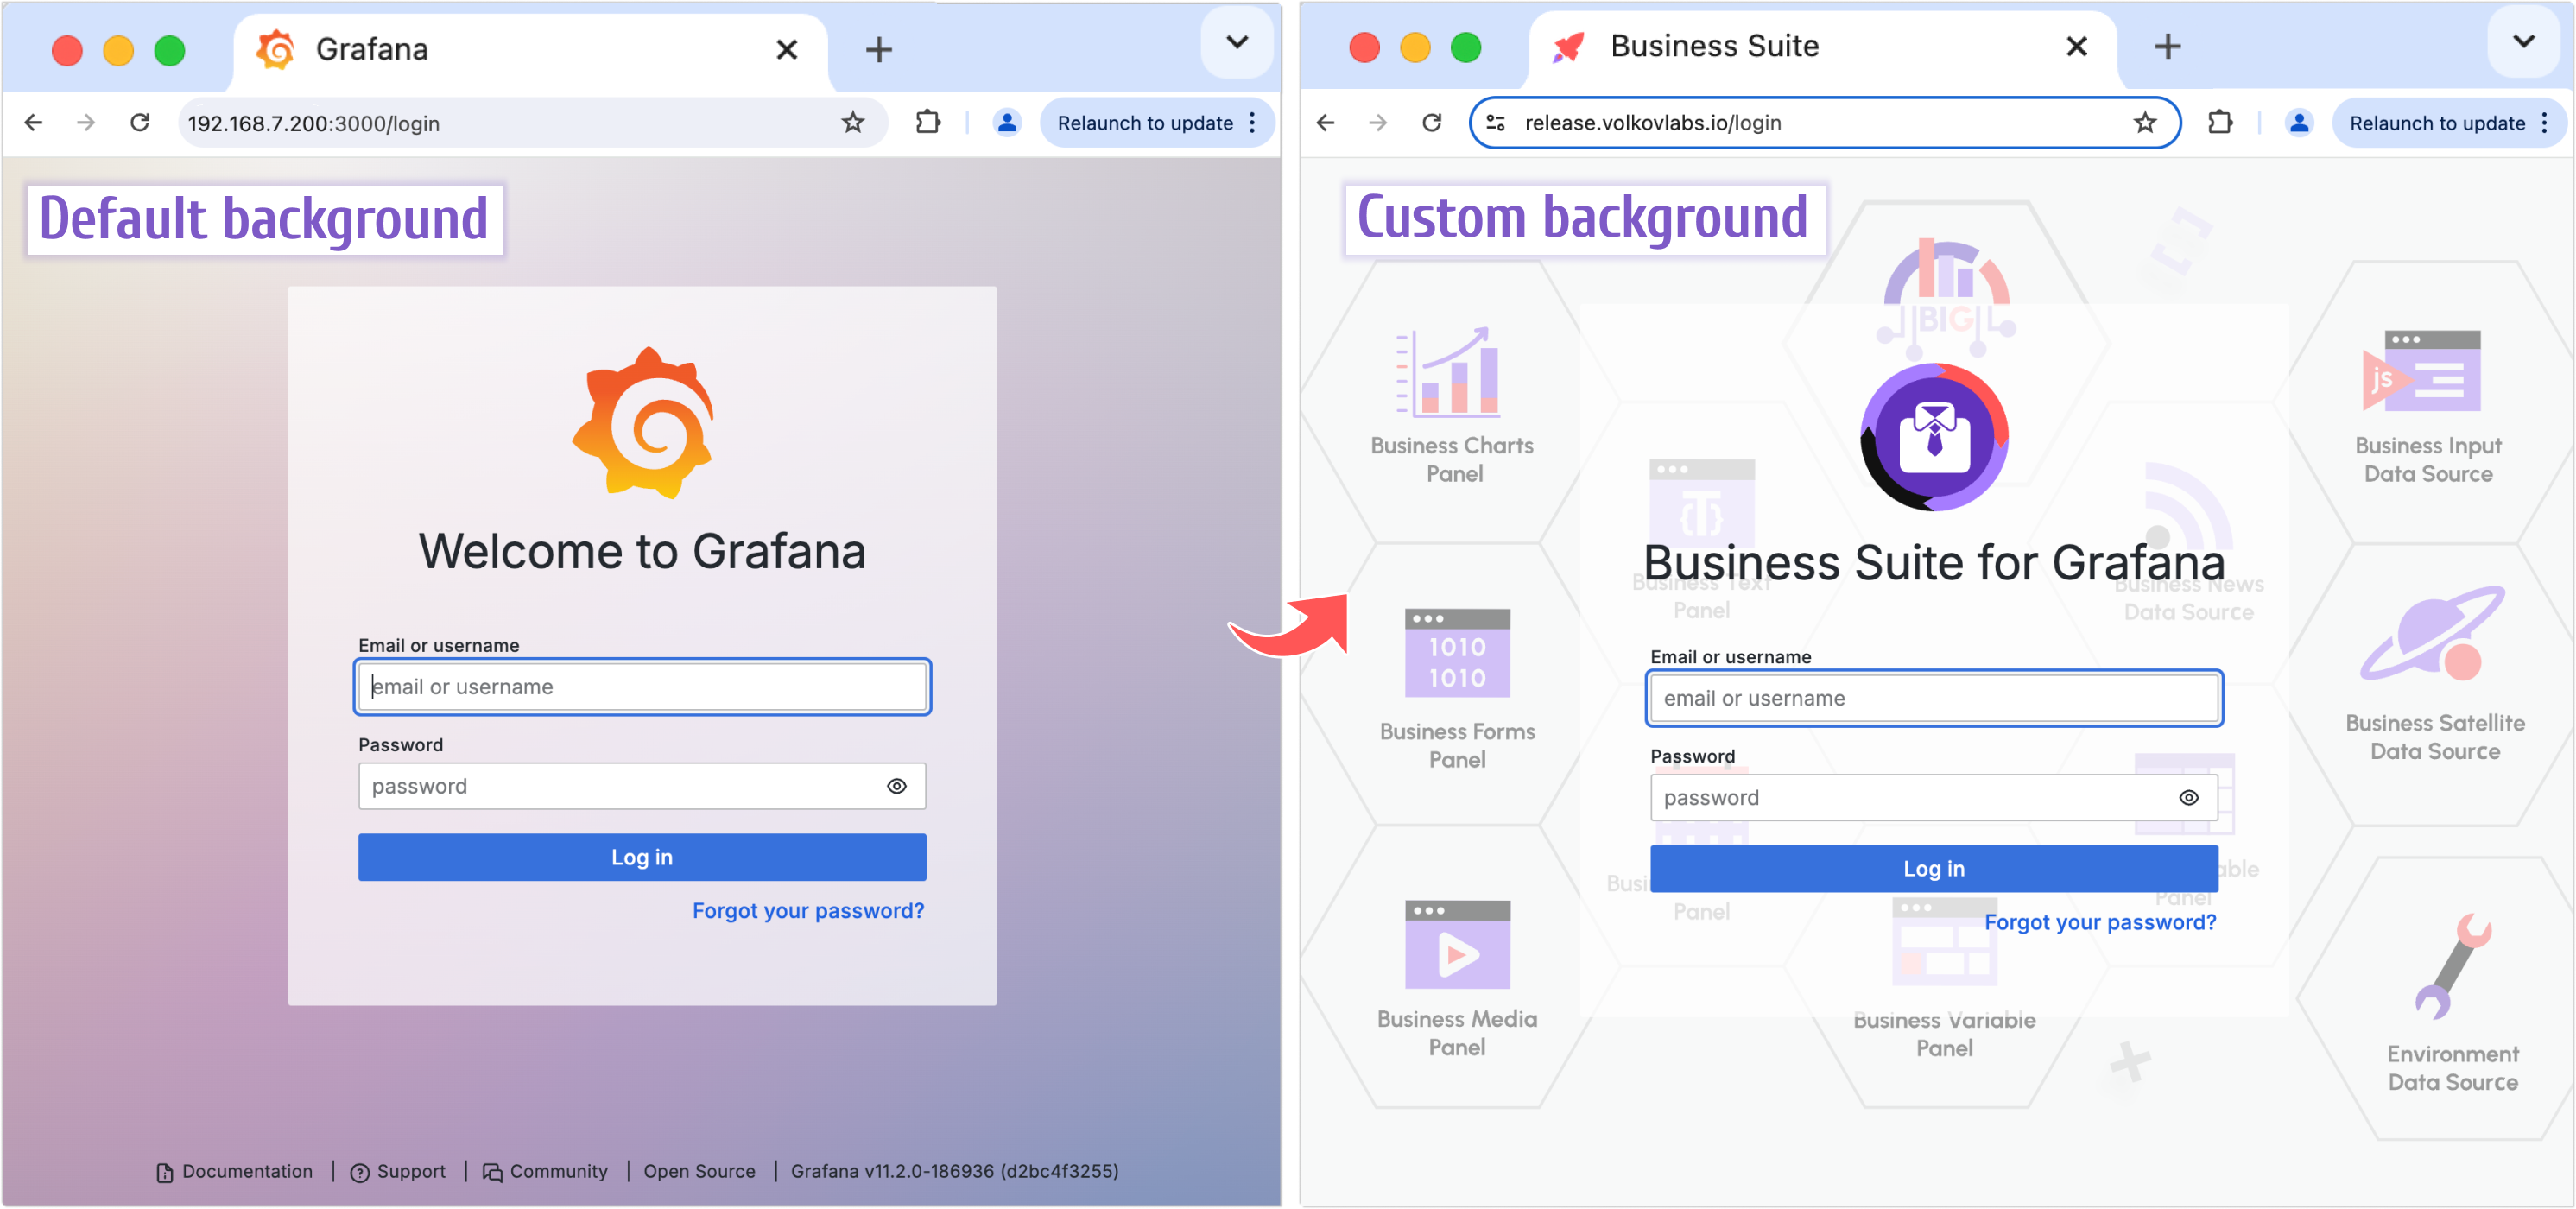
When customizing the background image, replace images for both themes. You can go with the same picture, but both files need to be replaced.
COPY img/background.svg /usr/share/grafana/public/img/g8_login_dark.svg
COPY img/background.svg /usr/share/grafana/public/img/g8_login_light.svg
Hands-on (JavaScript and HMTL)
Many elements are hard-coded and the only way to customize them is to alter the source code file before rendering the Docker container.
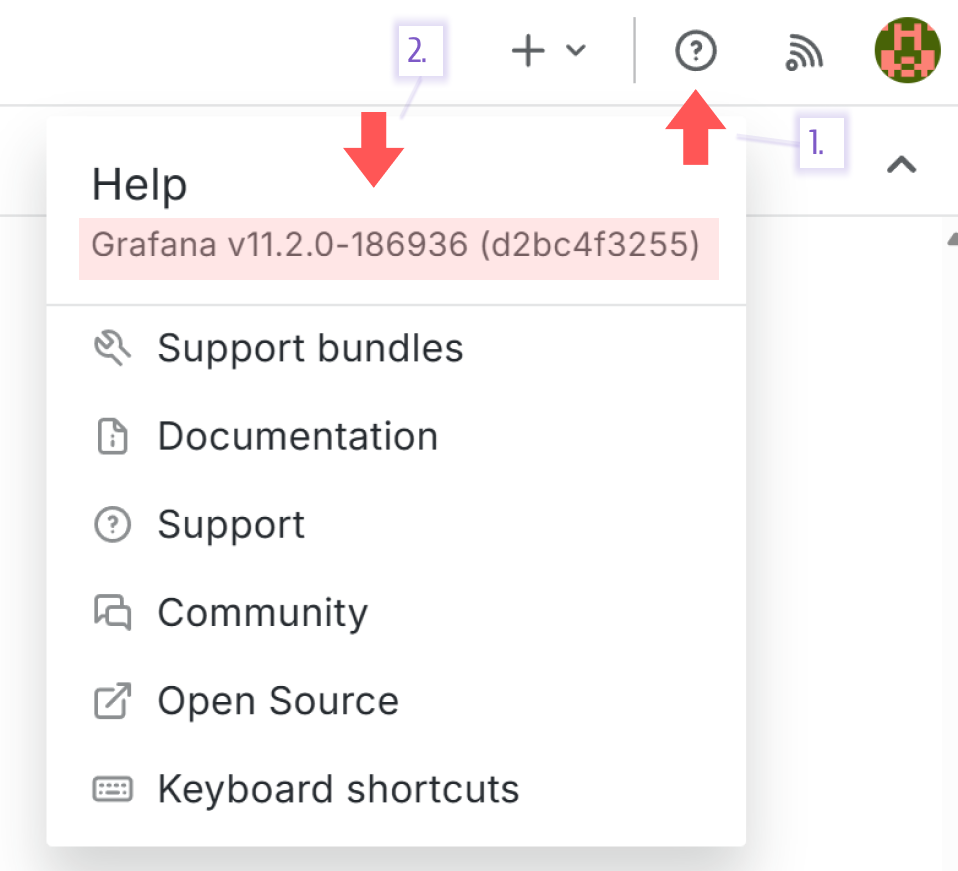
Update Navigation (Mega) Menu and help menu
The help menu opens when a user clicks on a question mark in a circle located in the top right corner.
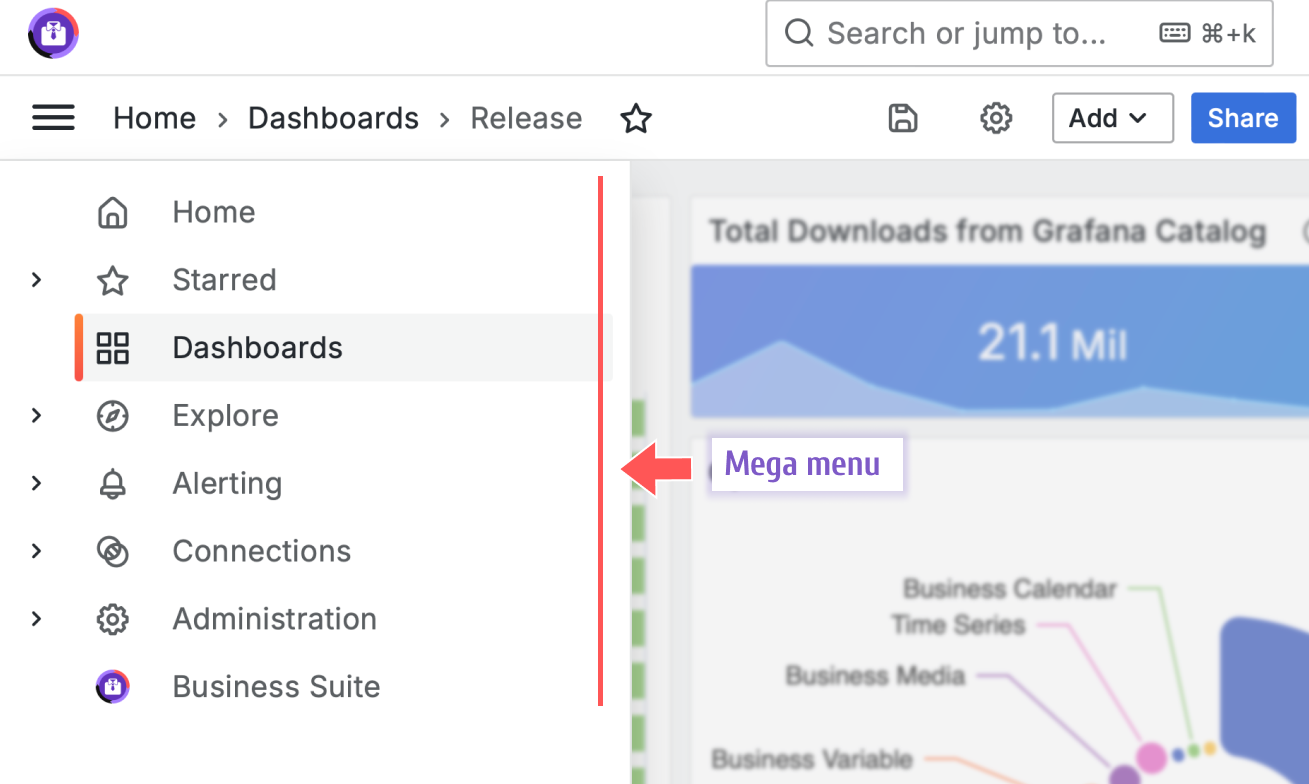
The mega menu is the left-side menu added in Grafana 9.5. It's hard-coded and there is no way to update it via the UI.
Below is an example of how you can update the help and mega menu.
## Update Mega and Help menu
RUN sed -i "s|\[\[.NavTree\]\],|nav,|g; \
    s|window.grafanaBootData = {| \
    let nav = [[.NavTree]]; \
    const alerting = nav.find((element) => element.id === 'alerting'); \
    if (alerting) { alerting['url'] = '/alerting/list'; } \
    const dashboards = nav.find((element) => element.id === 'dashboards/browse'); \
    if (dashboards) { dashboards['children'] = [];} \
    const connections = nav.find((element) => element.id === 'connections'); \
    if (connections) { connections['url'] = '/datasources'; connections['children'].shift(); } \
    const help = nav.find((element) => element.id === 'help'); \
    if (help) { help['subTitle'] = 'Business Suite 4.0.0'; help['children'] = [];} \
    window.grafanaBootData = {|g" \
    /usr/share/grafana/public/views/index.html
The menu elements can be added using JavaScript when rendering.
RUN sed -i 's|\[navigation.app_sections\]|\[navigation.app_sections\]\nvolkovlabs-app=root|g' /usr/share/grafana/conf/defaults.ini
Replace with regex
The application title (the name that appears on the browser tab), login page title, and bottom-page links are trickier than others. The files keeping those settings are scattered in various locations depending on the Grafana version.
To simplify customization, we use a regex pattern to find all occurrences and alter them accordingly.
Application Title
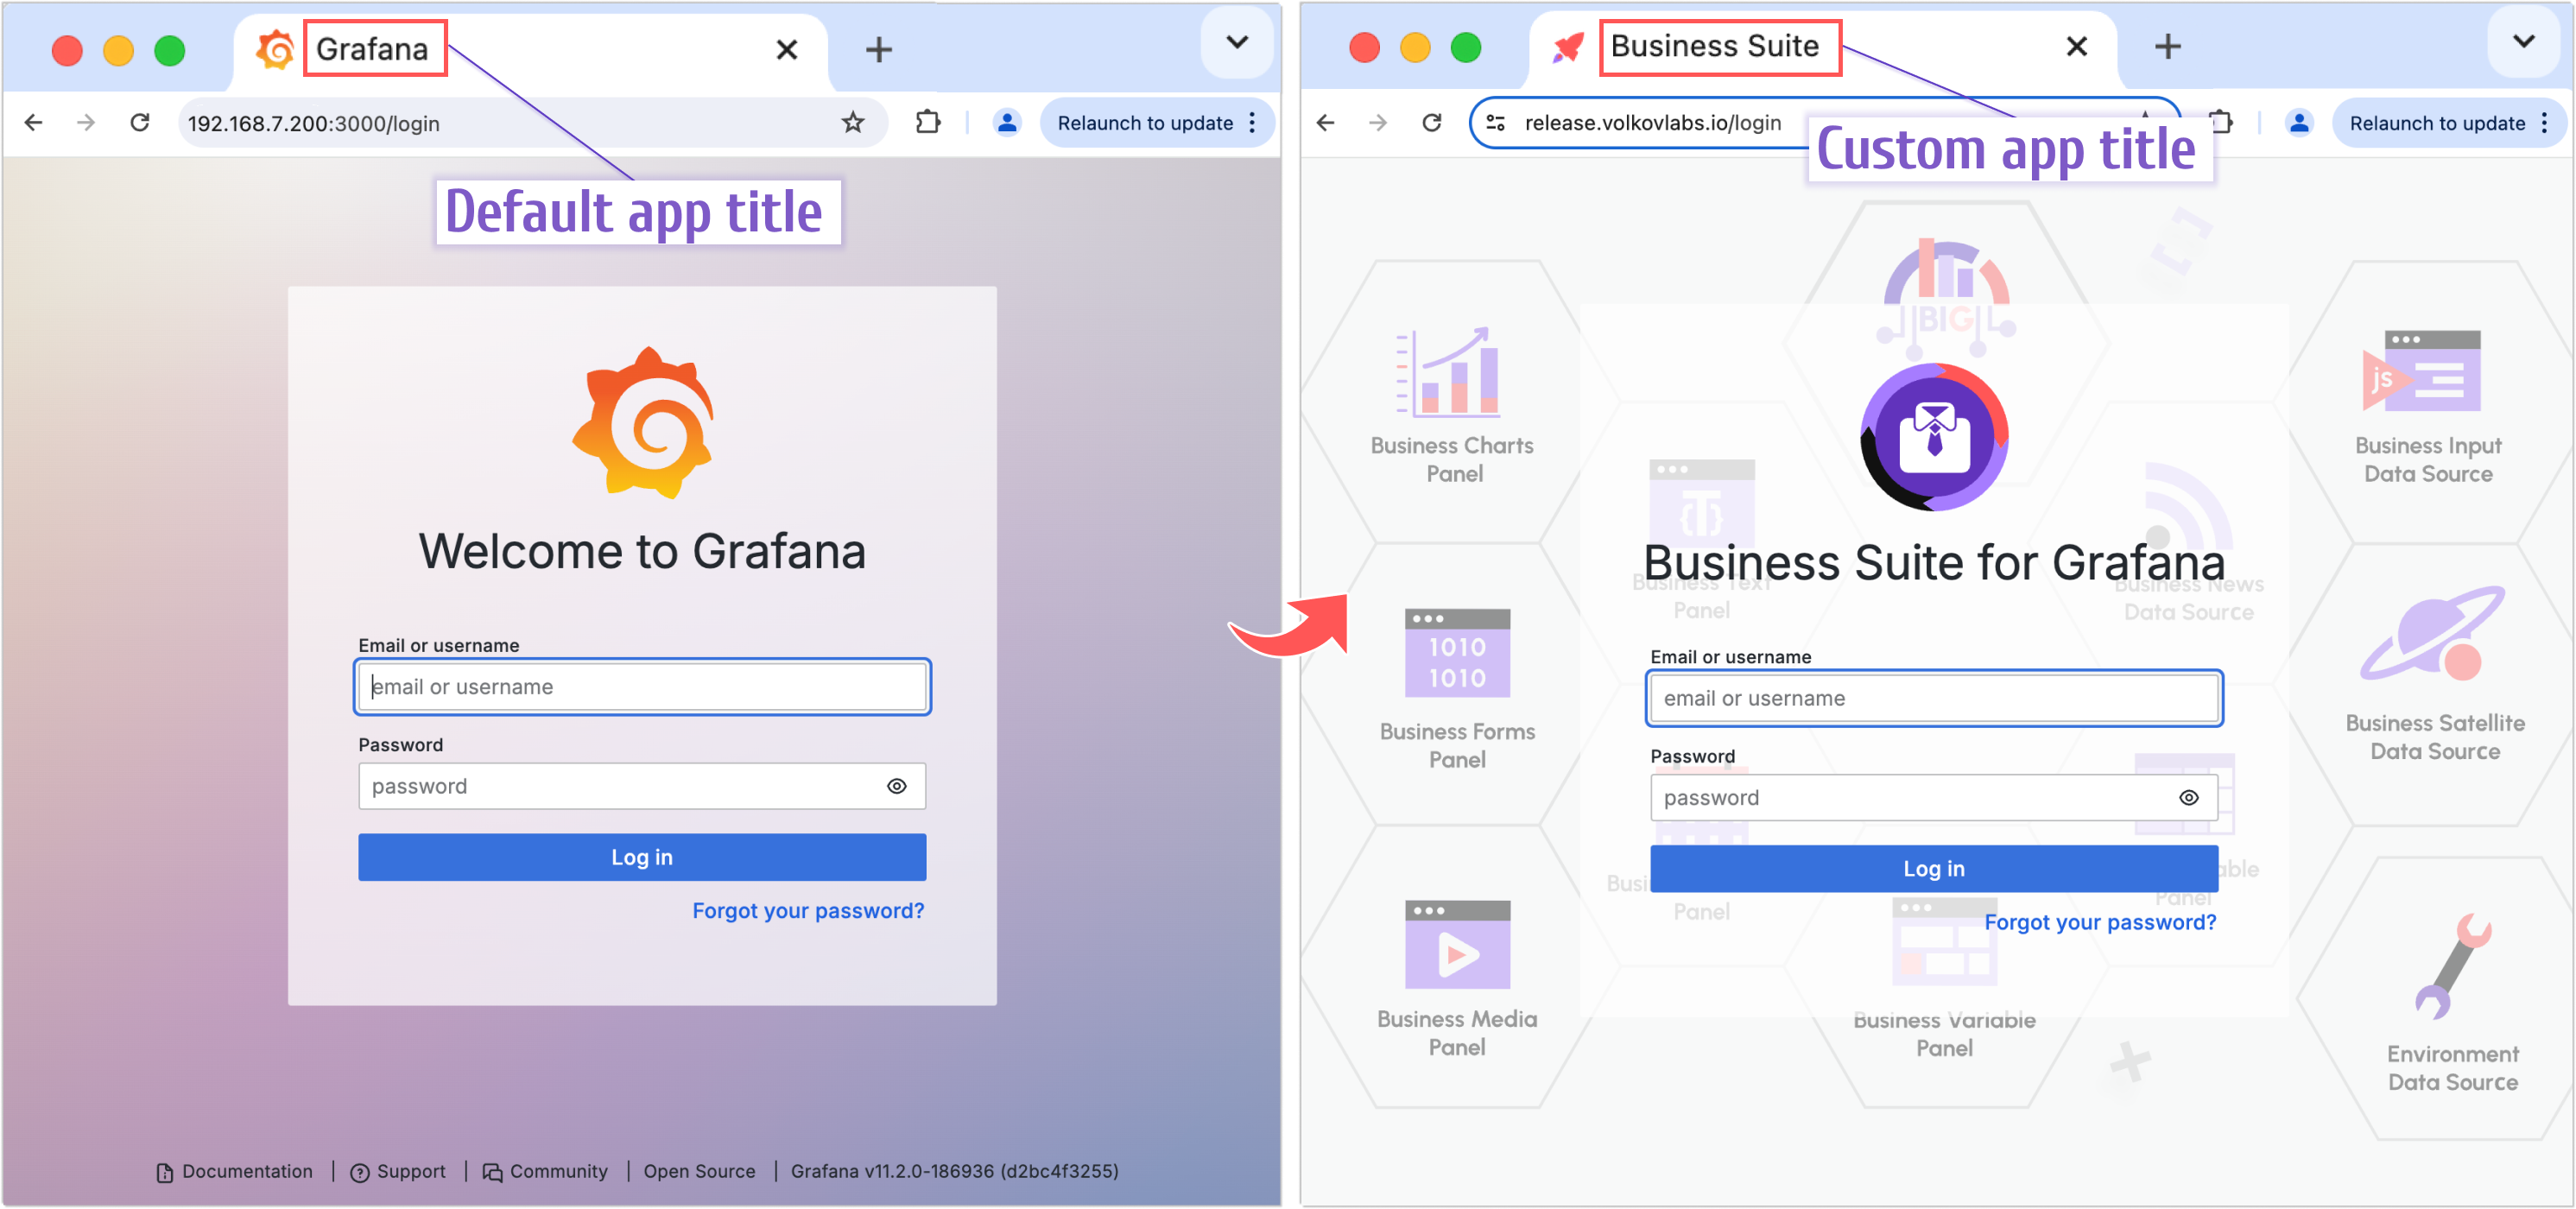
RUN find /usr/share/grafana/public/build/ -name *.js \
## Update Title
    -exec sed -i 's|AppTitle="Grafana"|AppTitle="Business Suite"|g' {} \; \
Login Title
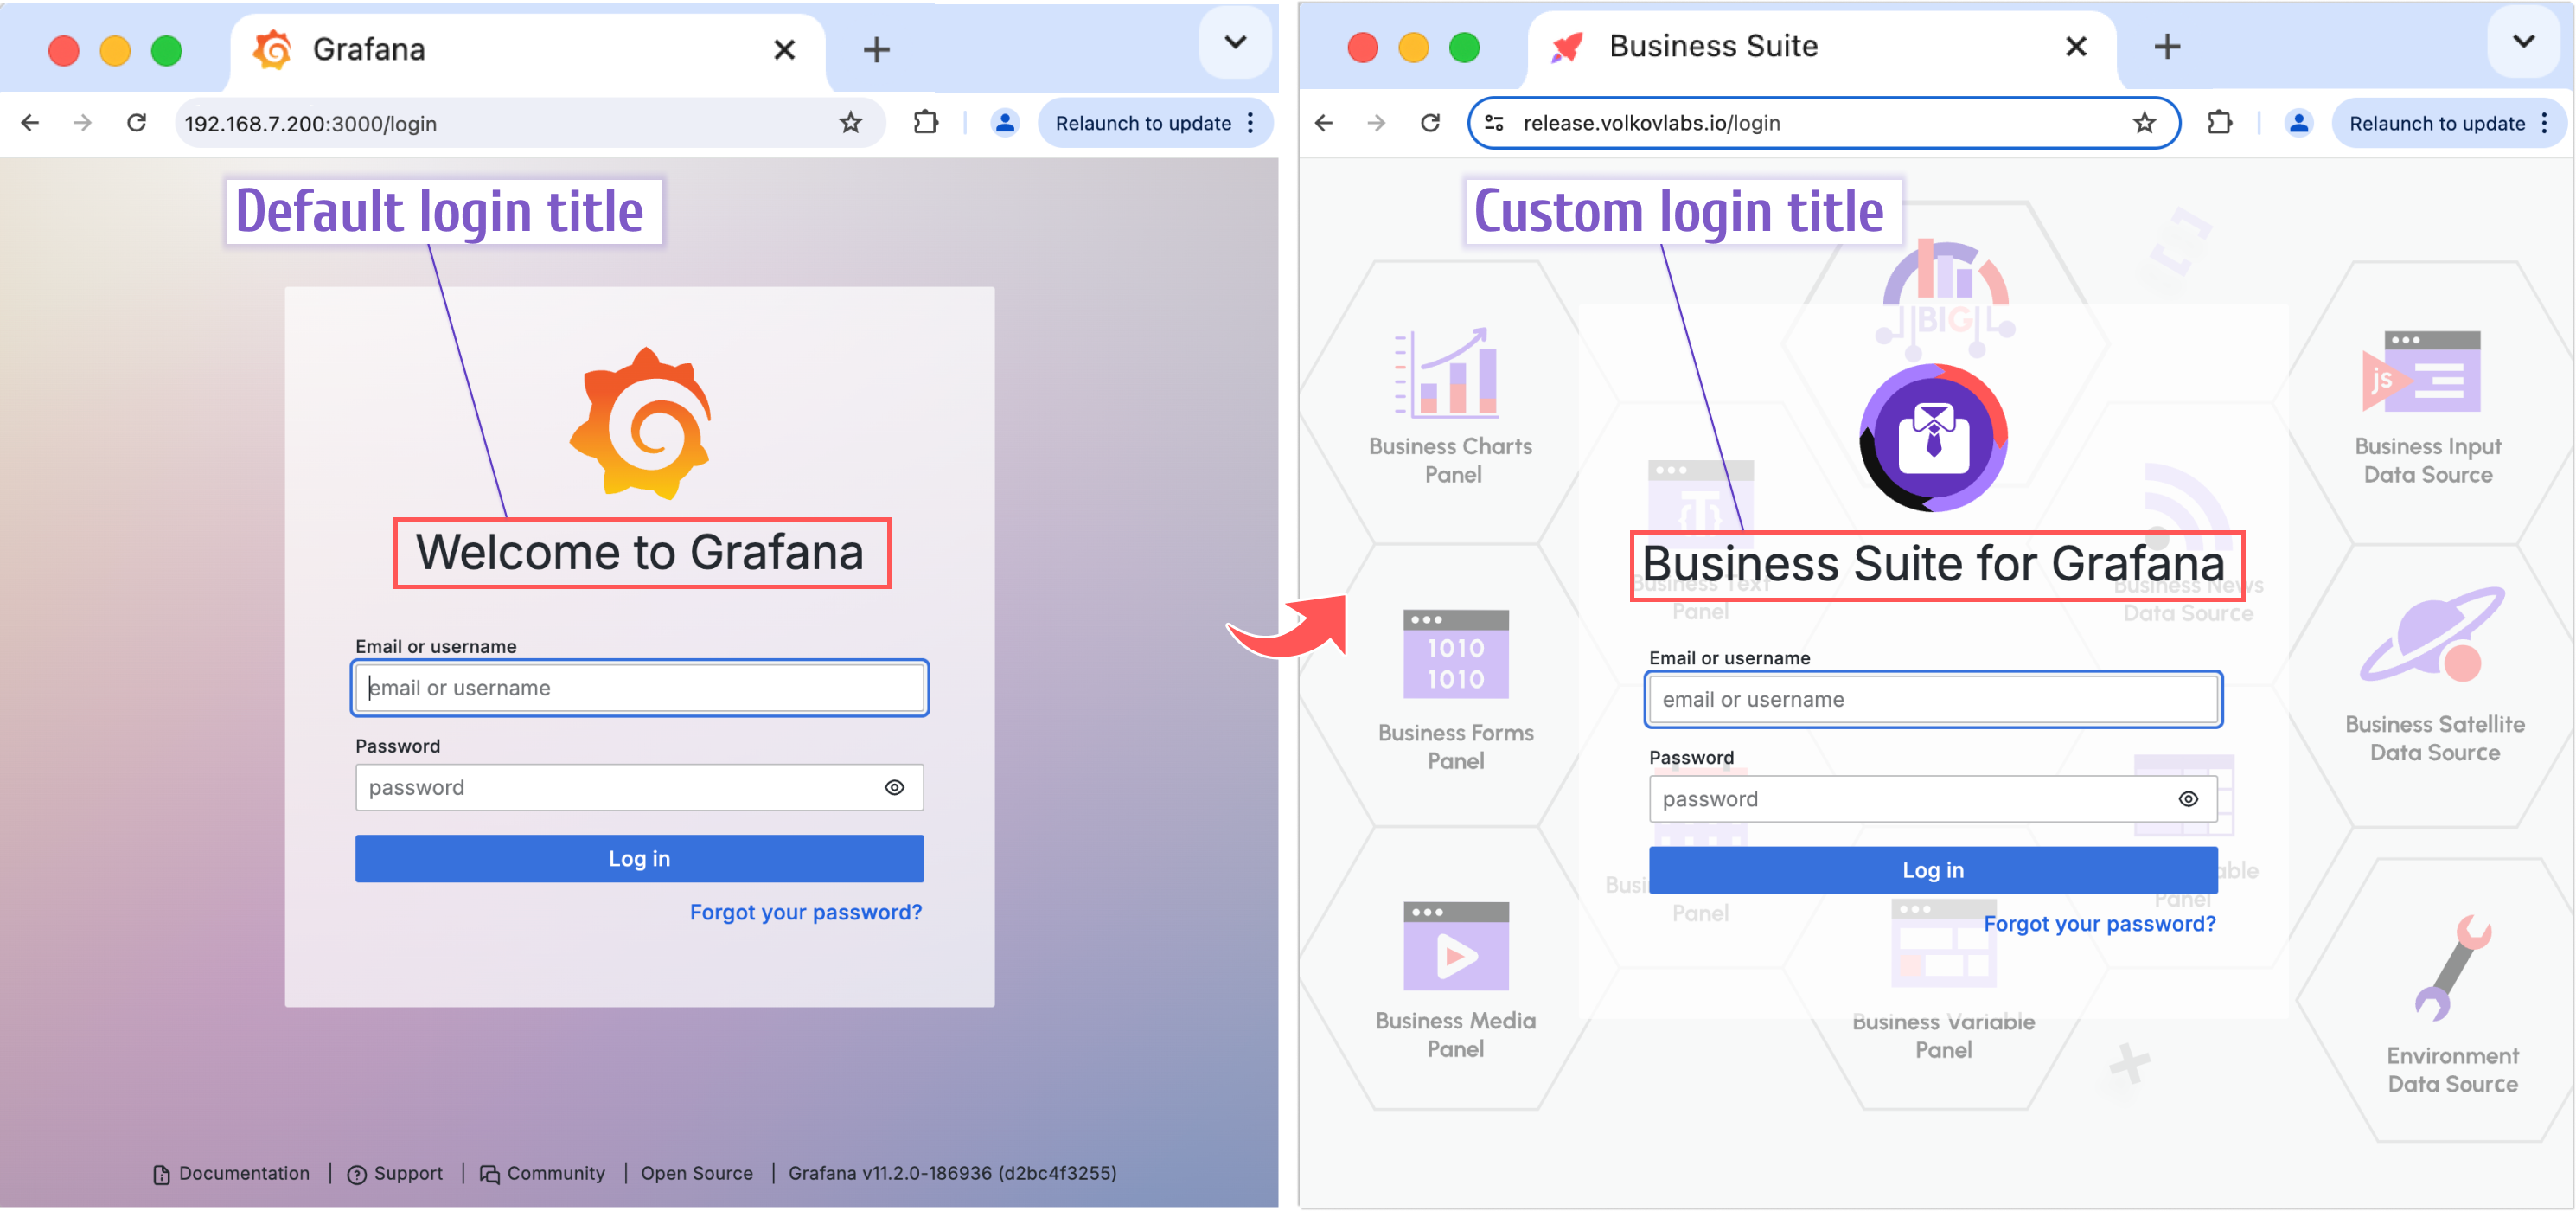
RUN find /usr/share/grafana/public/build/ -name *.js \
## Update Login Title
    -exec sed -i 's|LoginTitle="Welcome to Grafana"|LoginTitle="Business Suite for Grafana"|g' {} \; \
Login Footer
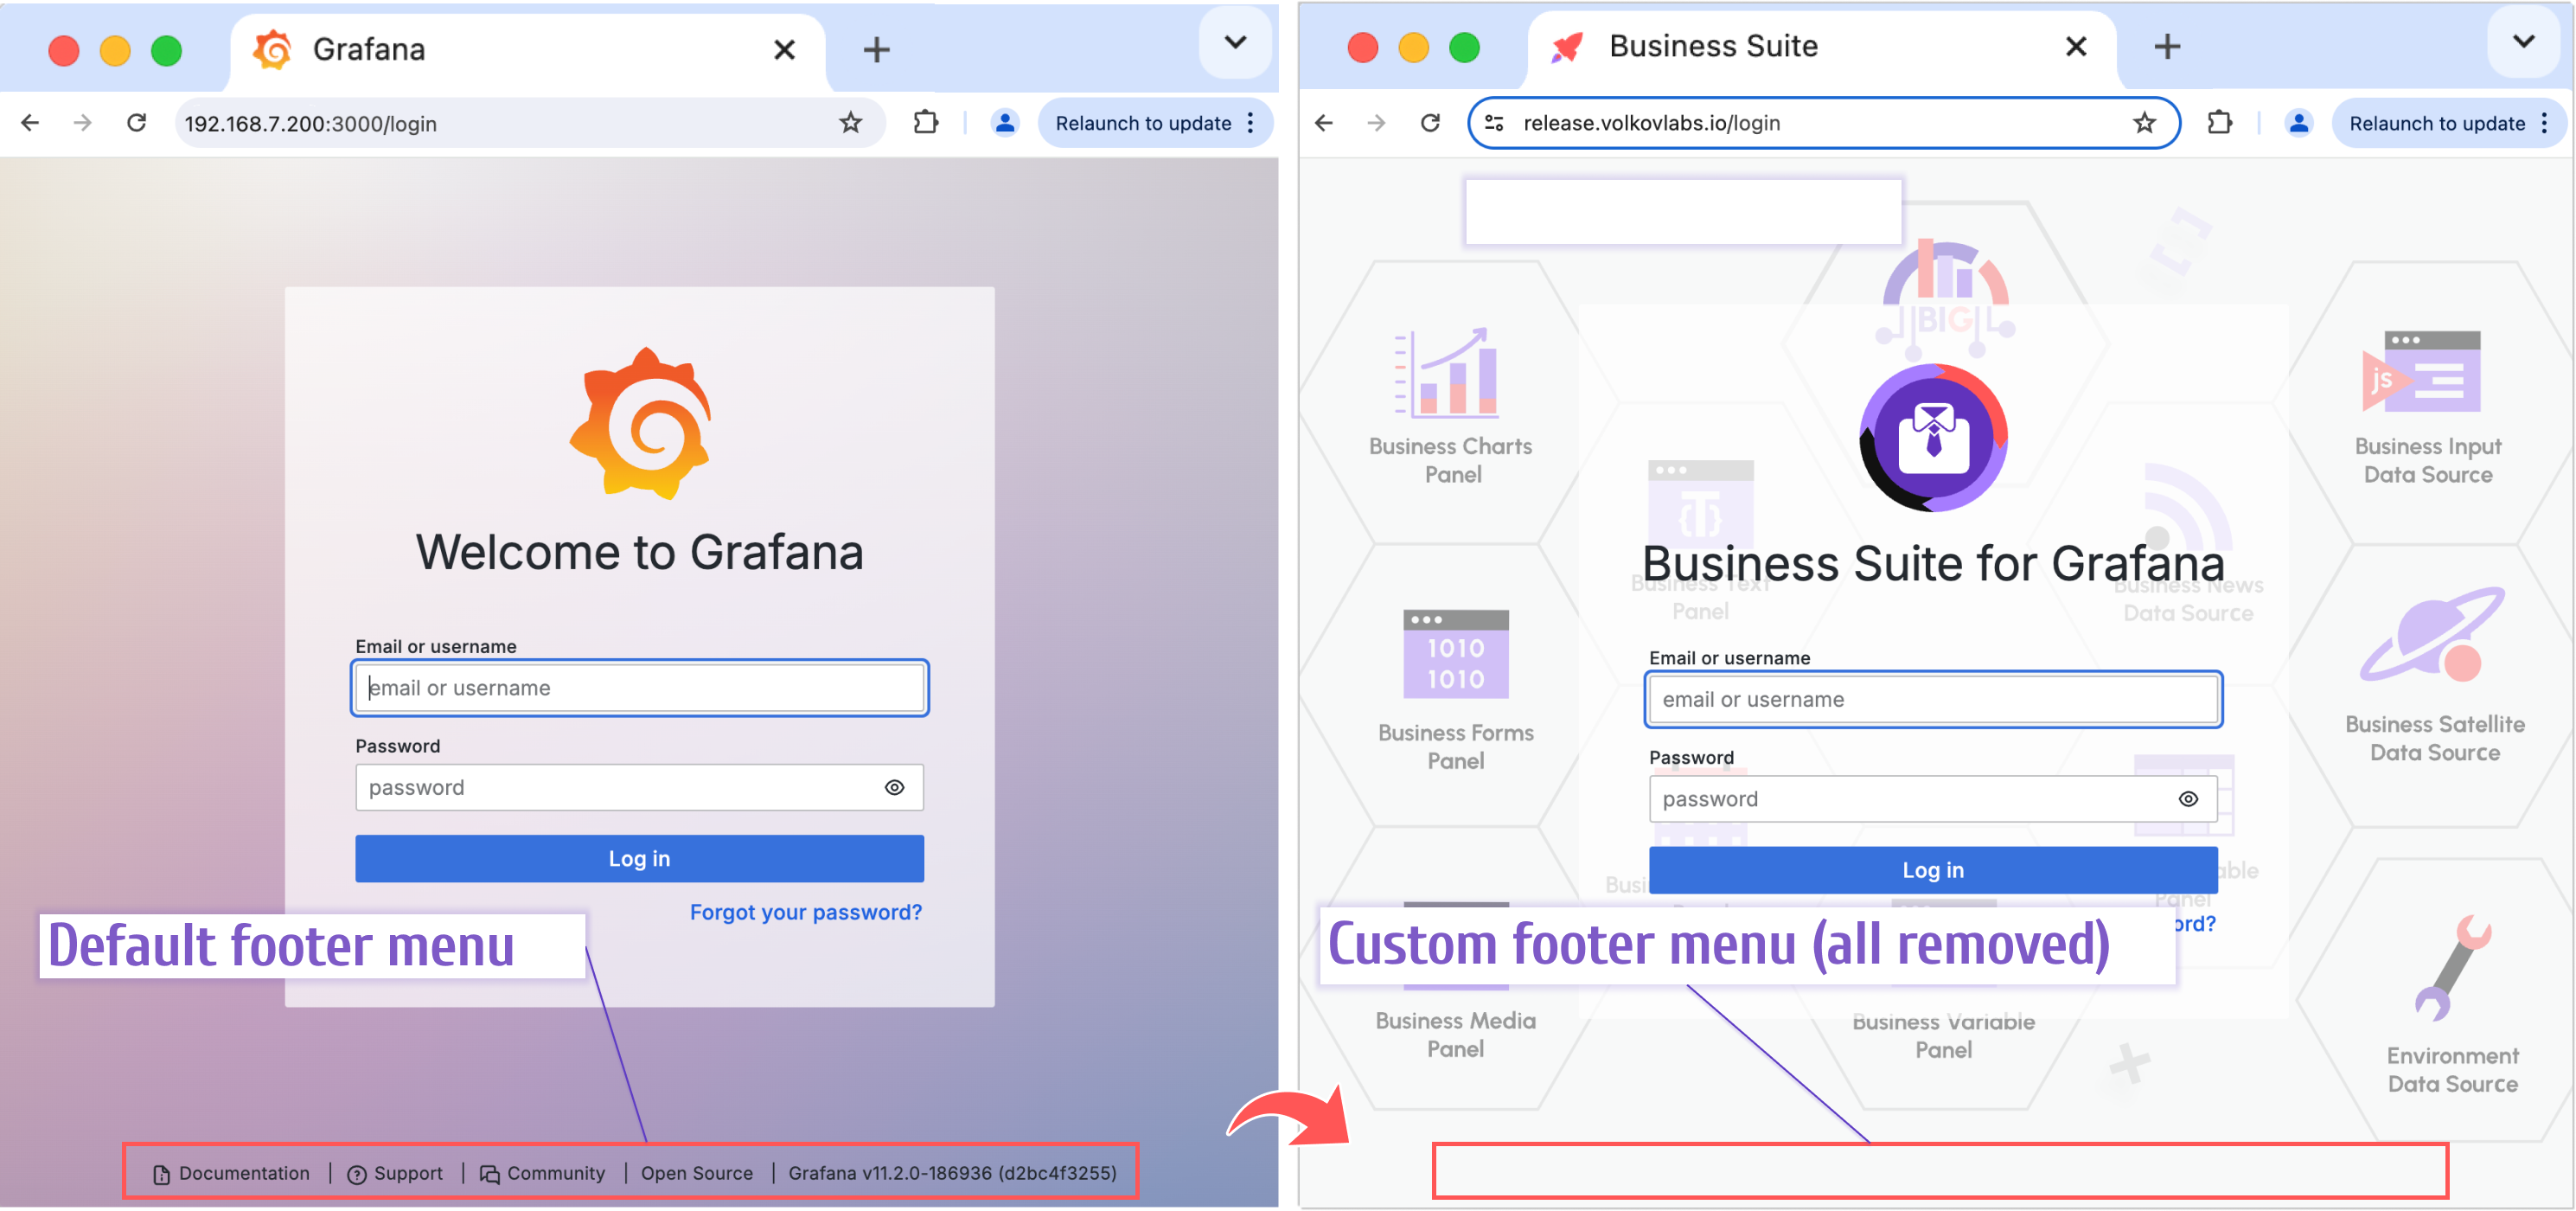
RUN find /usr/share/grafana/public/build/ -name *.js \
## Remove Documentation, Support, Community in the Footer
    -exec sed -i 's|\[{target:"_blank",id:"documentation".*grafana_footer"}\]|\[\]|g' {} \; \
## Remove Edition in the Footer
    -exec sed -i 's|({target:"_blank",id:"license",.*licenseUrl})|()|g' {} \; \
## Remove Version in the Footer
    -exec sed -i 's|({target:"_blank",id:"version",.*CHANGELOG.md":void 0})|()|g' {} \; \
The news icon
You can remove the news icon if needed.
RUN find /usr/share/grafana/public/build/ -name *.js \
## Remove News icon
    -exec sed -i 's|..createElement(....,{className:.,onClick:.,iconOnly:!0,icon:"rss","aria-label":"News"})|null|g' {} \; \
The Open Source menu access
You can remove the open source menu if needed.
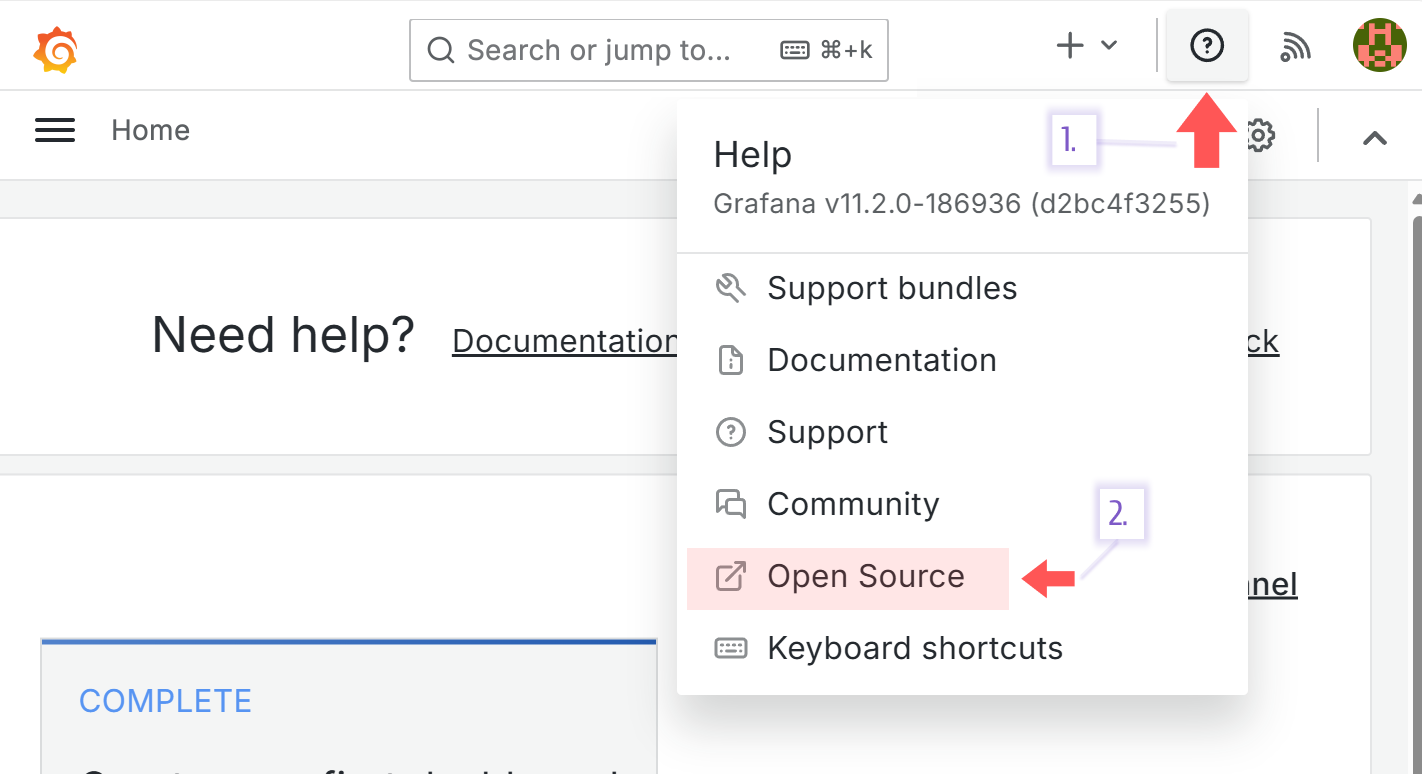
RUN find /usr/share/grafana/public/build/ -name *.js \
## Remove Open Source icon
    -exec sed -i 's|.push({target:"_blank",id:"version",text:`${..edition}${.}`,url:..licenseUrl,icon:"external-link-alt"})||g' {} \;
Cleaning
Grafana offers a lot of data sources to connect with by default along with numerous native visualization panels.
No doubt, it is an impressive and convenient functionality especially when you just getting yourself acquainted with Grafana. However, when you are ready to build an application, you might want to consider removing access to unnecessary plugins and pre-installed panels to keep your application clean looking, to avoid clutter in the Grafana UI.
Remove native visualization panels
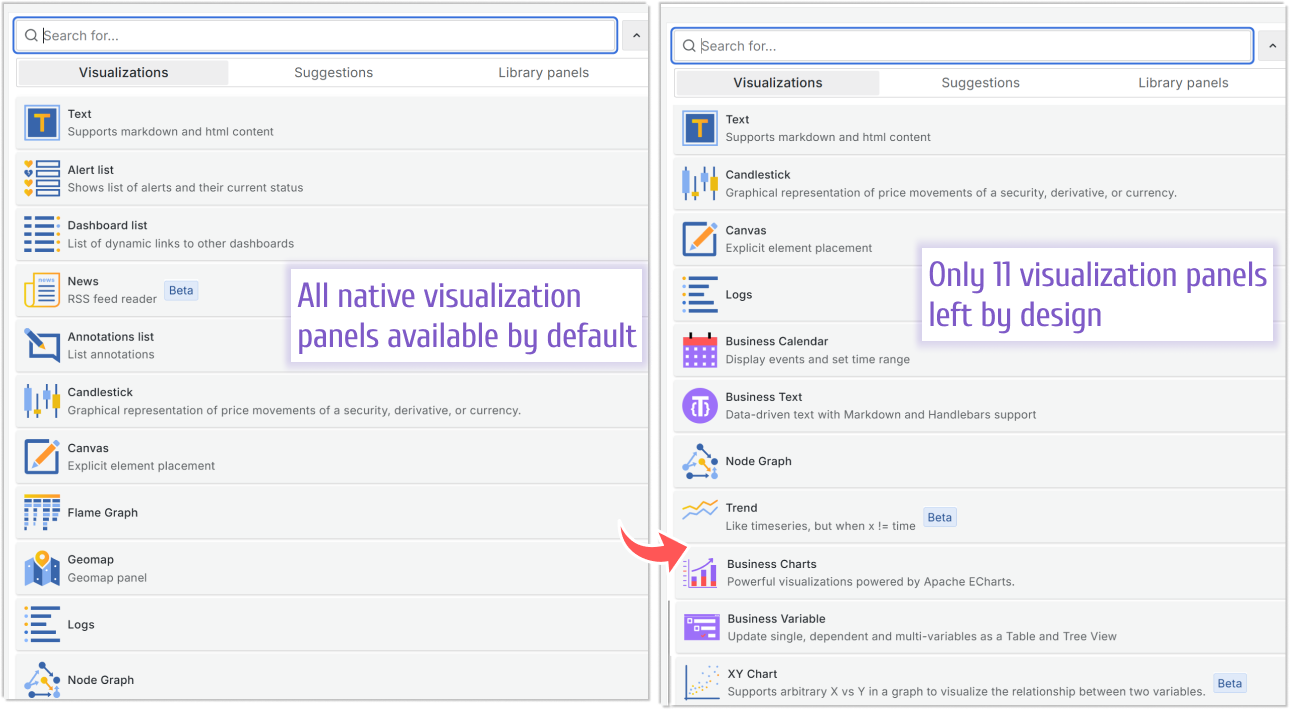
Below are some examples of removing native Grafana plugins.
RUN rm -rf /usr/share/grafana/public/app/plugins/panel/alertlist \
    /usr/share/grafana/public/app/plugins/panel/annolist \
    /usr/share/grafana/public/app/plugins/panel/dashlist \
    /usr/share/grafana/public/app/plugins/panel/news \
    /usr/share/grafana/public/app/plugins/panel/geomap \
    /usr/share/grafana/public/app/plugins/panel/table-old \
    /usr/share/grafana/public/app/plugins/panel/traces \
    /usr/share/grafana/public/app/plugins/panel/flamegraph
Remove native data sources
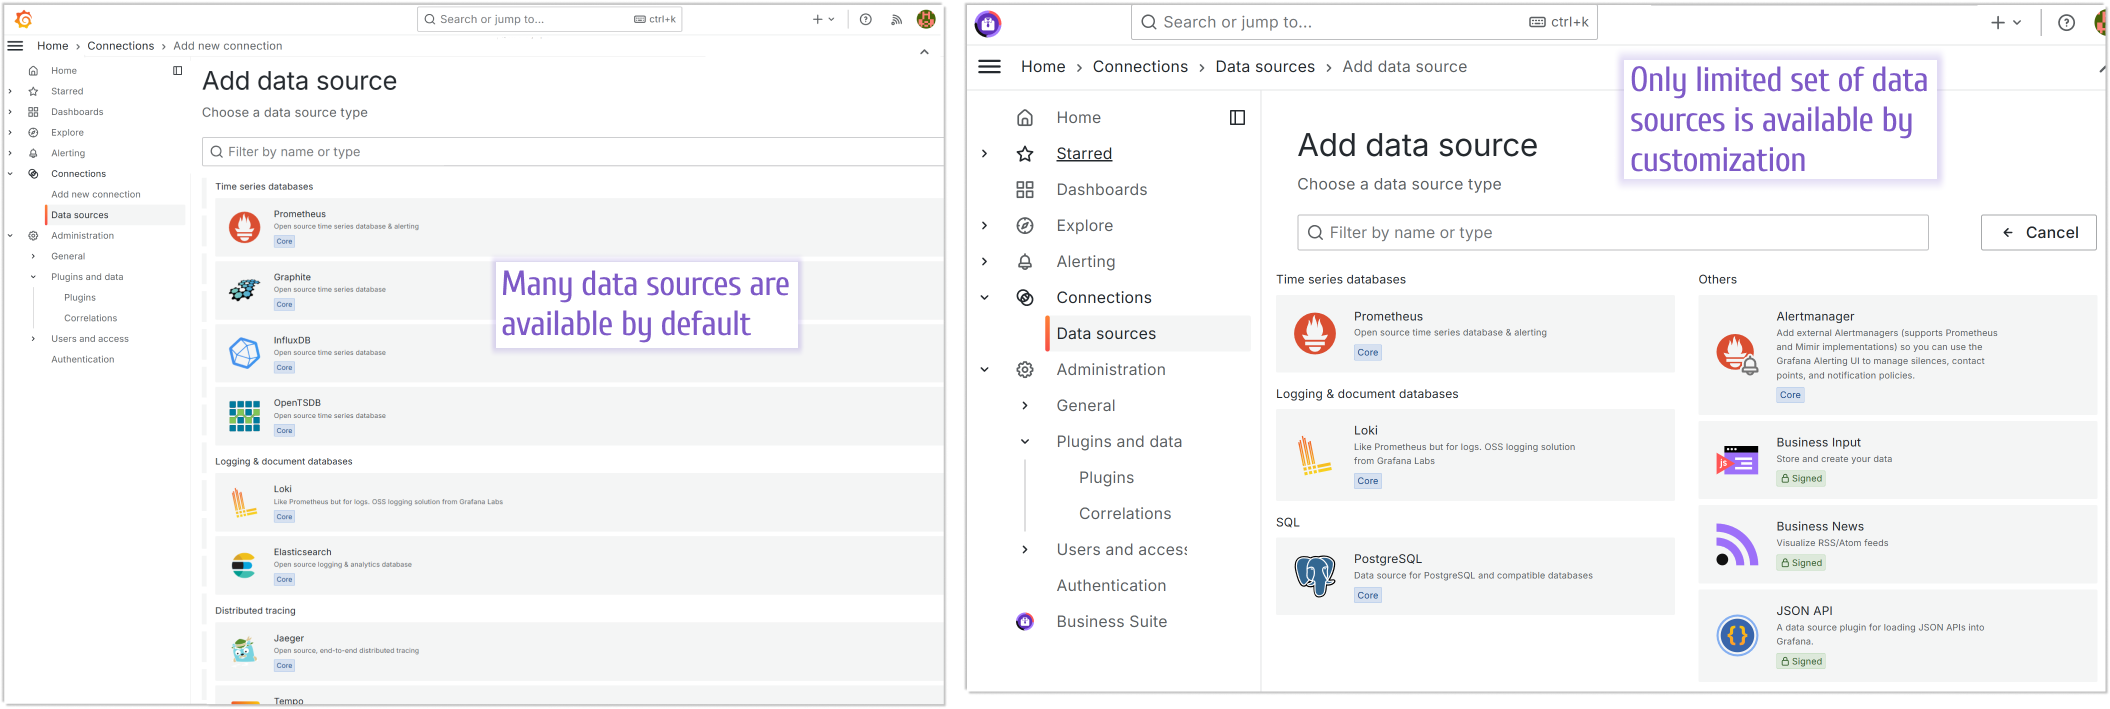
Below are some examples of removing unnecessary Grafana data sources.
RUN rm -rf /usr/share/grafana/public/app/plugins/datasource/elasticsearch /usr/share/grafana/public/build/elasticsearch* \
    /usr/share/grafana/public/app/plugins/datasource/graphite /usr/share/grafana/public/build/graphite* \
    /usr/share/grafana/public/app/plugins/datasource/opentsdb /usr/share/grafana/public/build/opentsdb* \
    /usr/share/grafana/public/app/plugins/datasource/influxdb /usr/share/grafana/public/build/influxdb* \
    /usr/share/grafana/public/app/plugins/datasource/mssql /usr/share/grafana/public/build/mssql* \
    /usr/share/grafana/public/app/plugins/datasource/mysql /usr/share/grafana/public/build/mysql* \
    /usr/share/grafana/public/app/plugins/datasource/tempo /usr/share/grafana/public/build/tempo* \
    /usr/share/grafana/public/app/plugins/datasource/jaeger /usr/share/grafana/public/build/jaeger* \
    /usr/share/grafana/public/app/plugins/datasource/zipkin /usr/share/grafana/public/build/zipkin* \
    /usr/share/grafana/public/app/plugins/datasource/azuremonitor /usr/share/grafana/public/build/azureMonitor* \
    /usr/share/grafana/public/app/plugins/datasource/cloudwatch /usr/share/grafana/public/build/cloudwatch* \
    /usr/share/grafana/public/app/plugins/datasource/cloud-monitoring /usr/share/grafana/public/build/cloudMonitoring* \
    /usr/share/grafana/public/app/plugins/datasource/parca /usr/share/grafana/public/build/parca* \
    /usr/share/grafana/public/app/plugins/datasource/phlare /usr/share/grafana/public/build/phlare* \
    /usr/share/grafana/public/app/plugins/datasource/grafana-pyroscope-datasource /usr/share/grafana/public/build/pyroscope*
## Remove Cloud and Enterprise categories
RUN find /usr/share/grafana/public/build/ -name *.js \
    -exec sed -i 's|.id==="enterprise"|.id==="notanenterprise"|g' {} \; \
    -exec sed -i 's|.id==="cloud"|.id==="notacloud"|g' {} \;
Spring cleaning
The following article was published more than a year ago, I still recommend reviewing it if you need more details about the cleaning in Grafana.

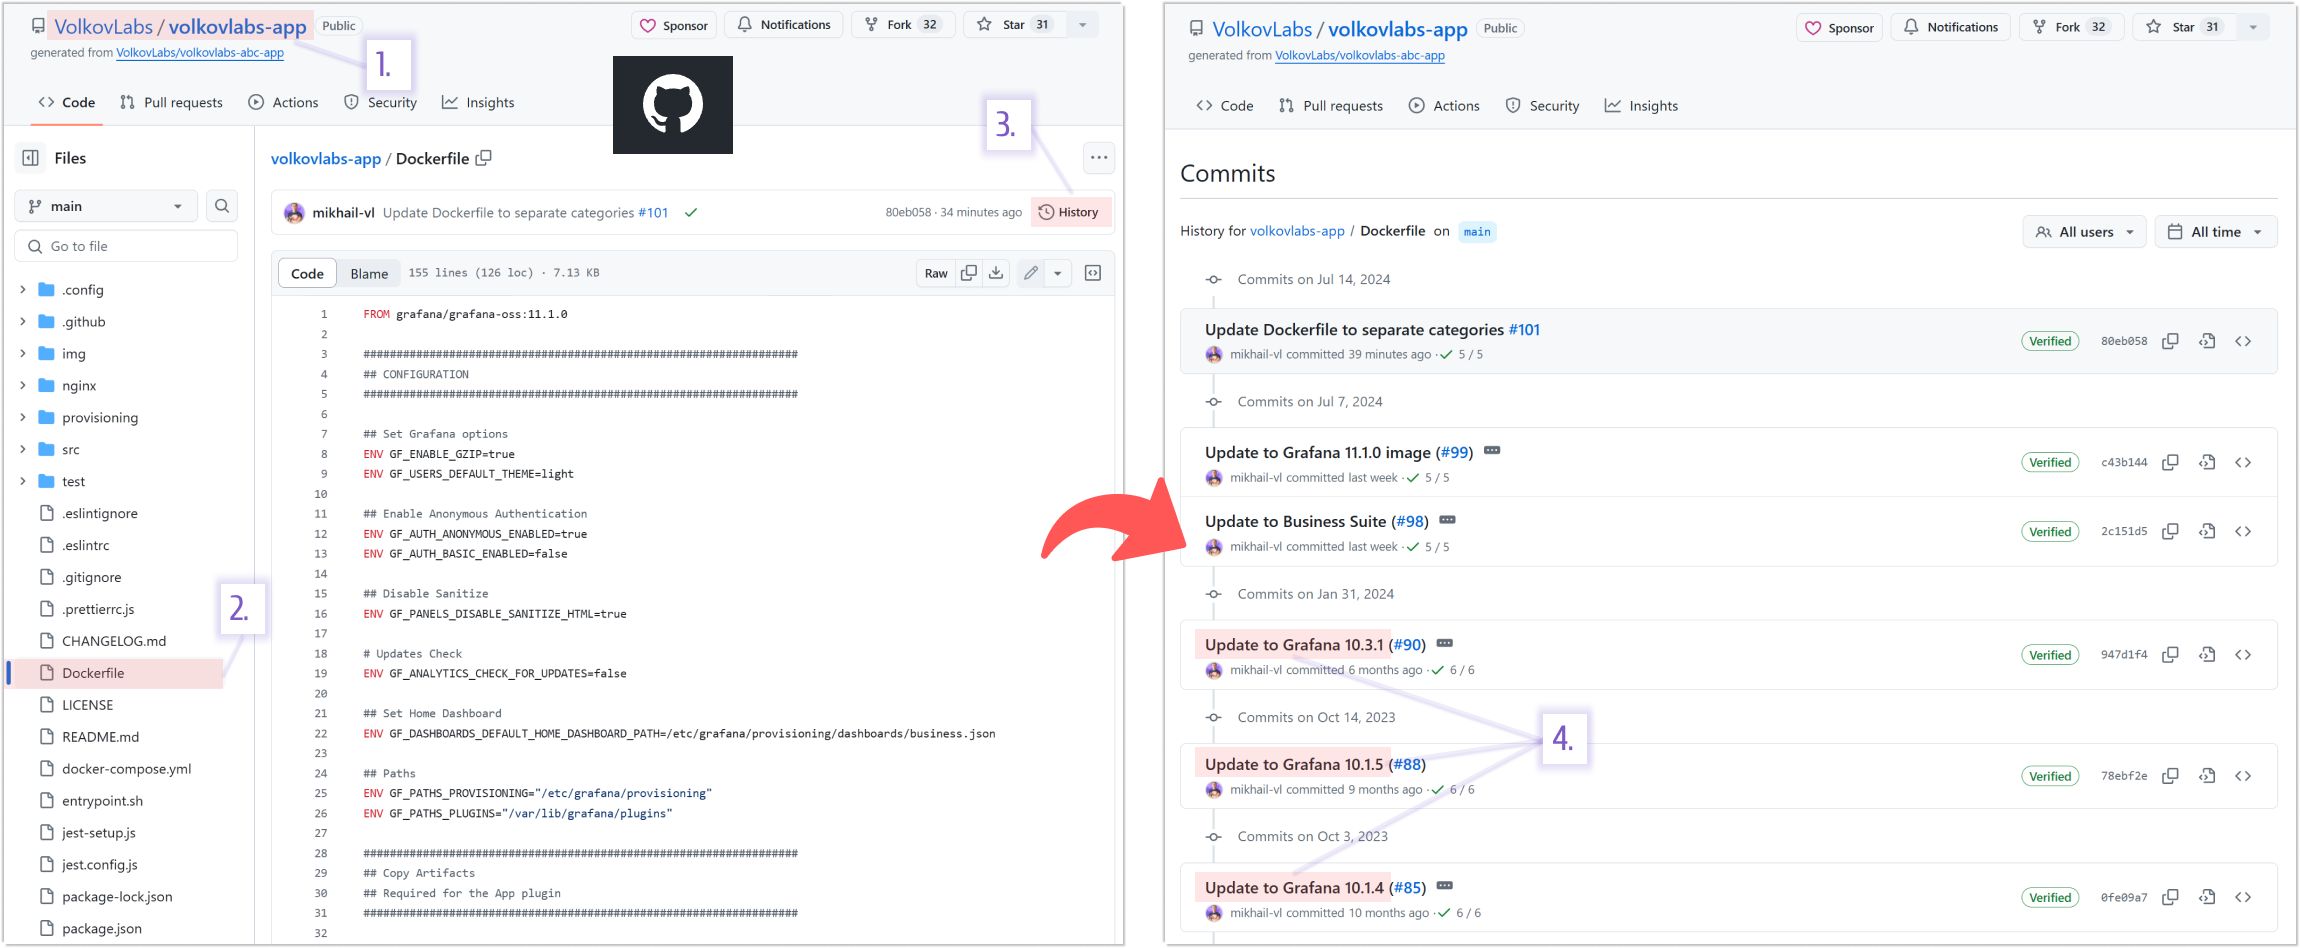
Docker file
Below we reference the GitHub latest docker file that we use for our Grafana docker build. It is constantly getting updated with all the latest configuration commands we were able to identify.
loading...
Customization for Direct Windows/Mac installation
When Grafana is installed in a Docker container, all commands can be specified in one configuration file (a Docker file) and to take effect a Docker container has to be rebuilt.
Customization for Direct Windows/Mac installation is different.
- For the configuration group command, specify them in the configuration file (in my installation, it is C:\Program Files\GrafanaLabs\grafana\conf\defaults.ini)
However, please keep in mind the command name difference. Below is one example.
| Windows | Docker file |
|---|---|
| disable_sanitize_html = true | ENV GF_PANELS_DISABLE_SANITIZE_HTML=true |
- Commands that fall into the cleaning (removing files), visual(replacing SVG), hands-on(updating JavaScript/HTML code) have to be performed either manually or via your automated scripts.
You still can use everything from this article as your guide, to get an idea of what is possible to customize and how.
Customization of previous Grafana versions
In order to find the customization command collection for a particular Grafana version, feel free to search in our GitHub repository. You might be lucky and find what you need.
Let’s Stay Connected!
Join the Conversation: Stay updated and share your thoughts! Subscribe to our YouTube Channel and leave your comments—we can’t wait to hear what you think.
Your input helps us improve, so don’t hesitate to get in touch!